Using science in targets for biodiversity - Planetary boundaries and the MSA indicator - Planetary boundary
←
→
Page content transcription
If your browser does not render page correctly, please read the page content below
Using science in targets for biodiversity
                 Planetary boundaries and the MSA indicator

30-4-2019 | Rob Alkemade, PBL Netherlands Environmental Assessment Agency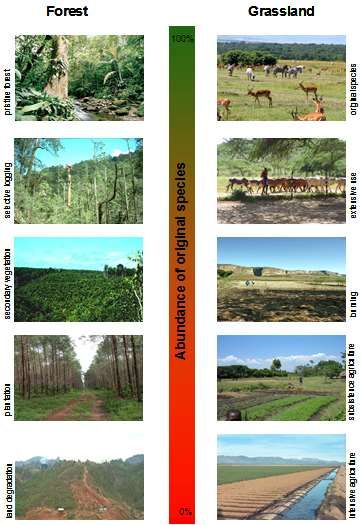
Overview

›   The 2050 vision for biodiversity
›   Operationalizations:
    – Half earth – whole earth
    – Based on planetary boundaries for biodiversity
›   Indicators: Mean Species Abundance
›   Contributions of economic sectors
›   Down-scaling to country level

30-4 2019 | Rob Alkemade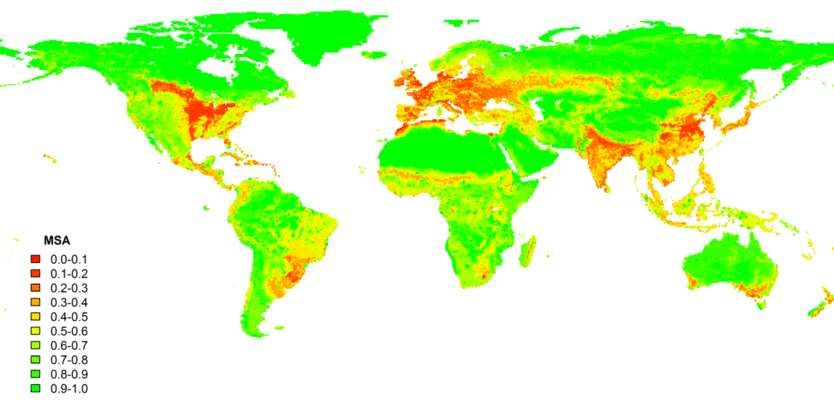
2050 vision on biodiversity

‘Living in harmony with nature’ where ‘by
2050, biodiversity is valued, conserved,
restored and wisely used, maintaining
ecosystem services, sustaining a healthy
planet and delivering benefits essential
for all people’
30-4 2019 | Rob Alkemade
Half earth – whole earth

›   Nature needs half (e.g. Wilson et al., 2016)
    – Increase protected areas as to protect half of the land an sea area
    – What about the rest ?

›   Whole earth
    – Sustainable use of the whole planet

30-4 2019 | Rob Alkemade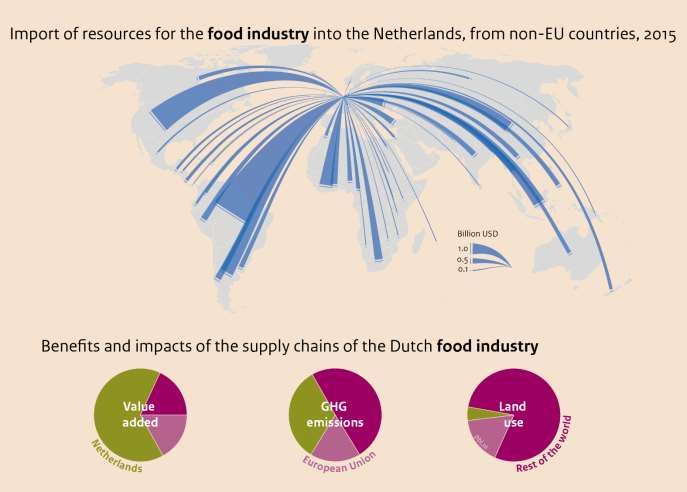
Planetary boundaries (1)
›   A safe operating space for humanity
    (Rockstrom et al., 2009)

    – Environmental changes remain within the
      conditions of the ‘Holocene’

    – Critical processes for the functioning of the Earth
      System

    – Biodiversity loss: indicated by species extinction
      rate
30-4 2019 | Rob Alkemade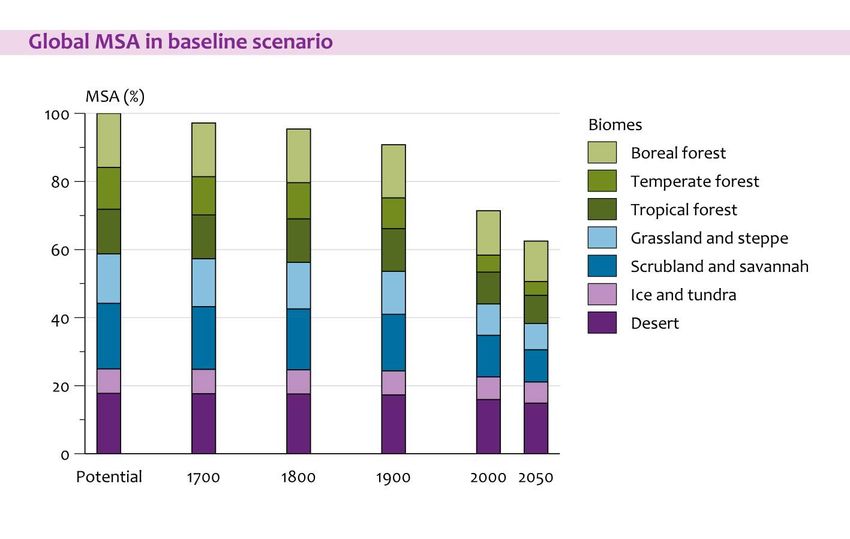
Planetary boundaries (2)

›   Crossing boundaries could
    generate abrupt or irreversible
    environmental changes
    – Precautionary limits

›   Many scientific
    uncertainties/discussions still
    ongoing
    – Boundary processes; indicators; limits;
      …
    – Used as science-based targets / global
      resource budgets

30-4 2019 | Rob Alkemade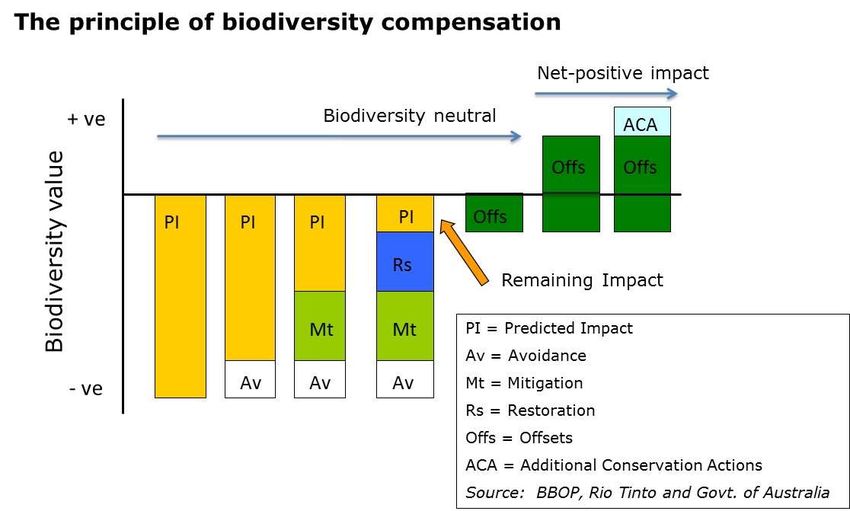
Planetary boundaries (3)

›   For biosphere integrity:
    – Genetic diversity: Species
      extinctions between 10-100
      E/MSY

    – Functional diversity: BII set
      at 90%, but with range
      between 30-90%

        Steffen et al., Science, 2015
30-4 2019 | Rob Alkemade
Bending the trend

Global view using scenarios
-   Biodiversity decline has continued despite
    repeated policy commitments
-   Models and scenarios can help to design
    Roadmaps, and find solutions
-   Alternative pathways available
      -   Sharing, sparing and caring

-   Using complementary indicators
      -   Extinction risk (BRIM, based on red list)
      -   Population abundances (LPI)
      -   Ecosystem integrity (BII, MSA)
      -   Cover of hot-spots

30-4 2019 | Rob Alkemade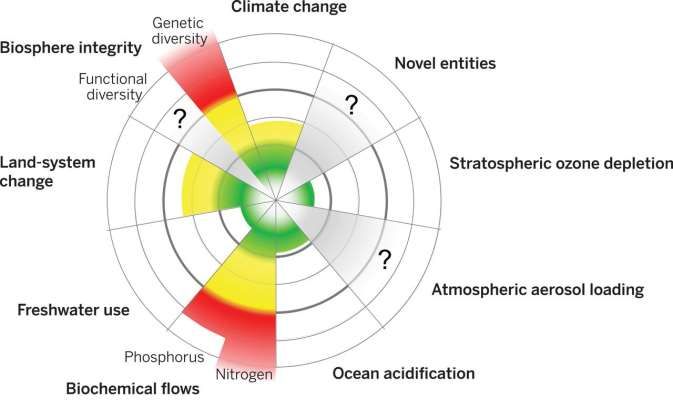
MSA indicator

›   Mean Species Abundance (MSA)
    of originally occurring species
›   Comparison between populations
    of human-disturbed habitats and
    undisturbed natural habitats
›   A measure of Naturalness
    (Ecosystem integrity)
›   Dimensions:
    - Index (0 – 1) or
    - Quality weighted areas (MSA*
    km2)

30-4 2019 | Rob Alkemade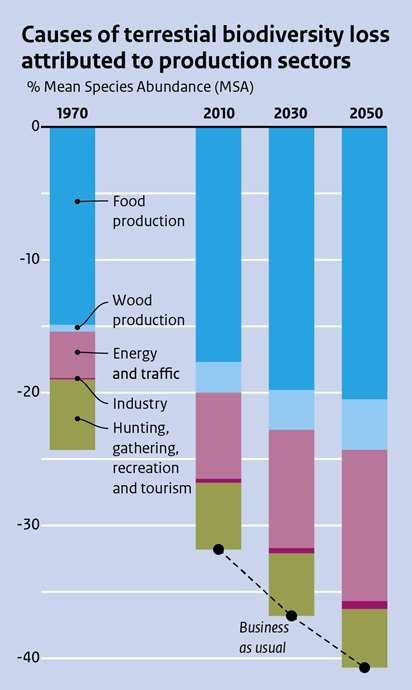
10

Planetary
Boundary

  30-4 2019 | Rob Alkemade
“Bending the curve”
                 Business is part of the problem…                             Solutions:
                                                                    Coherent packages of measures
                                                                     and concrete company action

                   … and part of the solutions,

Kok et al 2014

                                         30-4 2019 | Rob Alkemade
Steps towards No-Net-Loss 30-4 2019 | Rob Alkemade
From Planetary Boundaries to national fair shares of
the global safe operating space
›   Complex and dynamic interactions - Multi-scale systemic approach
›   Production and consumption - International trade
›   Equity and justice

30-4 2019 | Rob Alkemade
                                         Häyhä T et al. (2016). Global Environmental Change 40: 60-72.
Local impacts and regional footprint indicators CO2 emissions Cropland use Biodiversity loss
CO2 emissions Cropland
CO2 use CO2
emissions emissions Biodiversity loss
25 0.5 2.0
25 20 0.5 2.0
18 20 0.4 1.5
tCO2/cap
16
ha MSA/cap
20 14
12
tCO2/cap
18 20 10 0.4
ha/cap
8 15 0.3
1.5
tCO2/cap
16 6
ha MSA/cap
14
12 4
2
1.0
tCO2/cap
10 0 10 0.2
ha/cap
8 15 0.3
6
4 5 EU US
0.1 China
1.0 0.5 India
2
0 10 0.2
0 0.0 0.0
5 EU US
EU
0.1US China India China
EU US 0.5
China India India
EU US China India
0 Intentional
0.0 N fixation P fertiliser use 0.0
EU US China India 60 EU 6
US China India EU US China India
50 5
Production-based
40 4
Intentional N fixation P fertiliser use
kgN/cap
kgP/cap
30 3 Consumption-based
60 20 6 2
10 1 World average
50 5
0 0 Production-based
40 EU4 US China India Wilting
ChinaHC, et al. Environmental Science &
gN/cap
gP/cap
EU US India
30-4 2019 | Rob Alkemade Technology 51 (6): 3298-3306.
30 3 Consumption-basedBudget downscaling based on MSA
› Large range of allocation results
– What is favorable for one country could be
unfavorable for another
– Comparison of effort between countries required
› Allocation results differ due to
– Level of current transgression of global budget
– Differences in national environmental pressure
– Equity principle used
– If/how future generations and economic
Lucas PL and Wilting H. (2018). Using planetary
boundaries to support national implementation of developments are taken into account
30-4 2019 | Rob Alkemade
environment-related Sustainable Development Goals.Conclusions – for discussion
› Scenario building helps to address what is needed to achieve the
CBD 2050 biodiversity vision
› Planetary boundary for biodiversity is not (yet) fixed, but rather a
gradual and uncertain space, that serves inspiration
› Indicators like MSA provide insights in both the causes of
biodiversity loss AND the contribution of sector or countries to
solutions
› They also enable measuring the potential effectivity of solutions
and therefore help companies to guide actions for positive
contributions to biodiversity
30-4 2019 | Rob AlkemadeThank you
More information: Rob.alkemade@pbl.nl; www.globio.info
30-4 2019 | Rob AlkemadeDutch sectors with a highest biodiversity impact
=> Large international component
Hotels and Restaurants
Wood and Products of Wood and…
Water Transport
Coke, Refined Petroleum and…
Air Transport
Electricity, Gas and Water Supply
Food, Beverages and Tobacco
Arable farming
Forestry
Cattle farming
0.0 0.1 0.1 0.2 0.2 0.3 0.3 -0.2 -0.1 0.0 0.1 0.2 0.3
MSA.m2.year / euro MSA.m2.year / euro
GHG emissions Land use direct Land use indirect Via imports Direct on-site Domestic suppliers
global biodiversity loss per euro of sector output Wilting & van Oorschot 2017
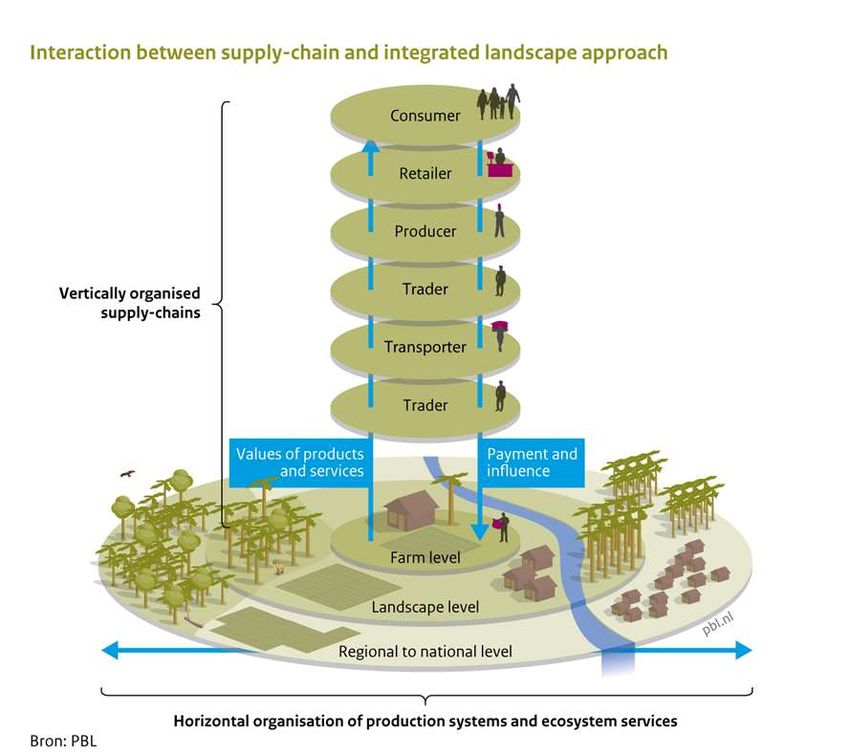
30-4 2019 | Rob AlkemadeNNL as a connecting principle for the supply-chain
Entry-points for cooperative effort
- Demand from sustainable consumption
- Shared supply-chain responsibility
- Sustainable production landscapes
30-4 2019 | Rob AlkemadeTrade connects
High resource dependence …
with remote impacts
30-4 2019 | Rob AlkemadeBe aware of the “Hidden impact”
Ask your suppliers about their suppliers!
30-4 2019 | Rob Alkemadevan den Berg NJ, van Soest HL, Hof AF, den Elzen MGJ, van Vuuren DP, et al. (2019). Implications of various effort-sharing approaches for
30-4 2019carbon
national | Rob Alkemade
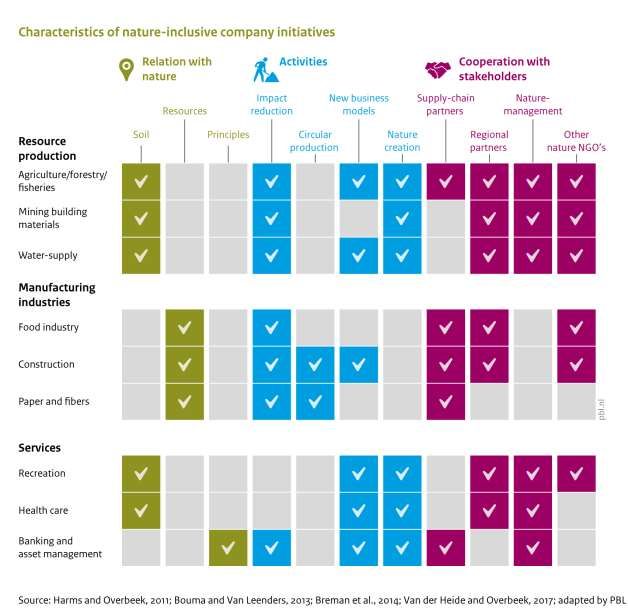
budgets and emission pathways. Climatic Change.Dutch case-studies on nature-inclusive business initiatives Many parts of the NNL-puzzle available Businesses are differently positioned: - soil bound - resource bound - principle bound Cooperation with stakeholders is key: - demand - incentives - knowledge Need to combine efforts - across sectors - national and multi-national 30-4 2019 | Rob Alkemade
You can also read