Vacancy Posting in 2020: Estimates based on Job Bank and External Providers
←
→
Page content transcription
If your browser does not render page correctly, please read the page content below
Vacancy Posting in 2020: Estimates based on Job Bank
               and External Providers
                             Fabian Lange and Casey Warman

                                           May 8th , 2020

1       Introduction
This document presents time-series of vacancy postings on a set of online job boards covering
January 5th to April 28th , 2020.1
    These data exhibit very rapid declines in vacancy postings as the COVID-19 crisis brought
the economy to a halt in mid-March. Postings declined by up to 50% until mid-April. In the
two weeks ending April 28th , we observe that vacancies rebounded to about three quarters
of the pre-period level. This rebound is however not uniform across provinces and most
pronounced in Québec.
    We note that the data is not representative for the Canadian Economy. It is however
one of the few available indicators of current hiring conditions in Canada. Nevertheless, we
caution against placing too much interpretation on these results.2

2       Data
2.1     Data Sources
The data was provided by ESDC and contains vacancies posted on the Job Bank, a Job
Board maintained by ESDC as well as vacancies posted by external providers. The external
providers include provincial job boards maintained by Employment Quebec, Saskjobs, and
WorkBC as well as some maintained by private job boards such as Monster.com, Careerbea-
con, Jobillico, PSC, and ZipRecruiter. In the following we will refer to this data in short as
“Job Bank” or “Job Bank data”. The distribution across providers is shown in Table 1.
    The data contains occupation codes for all occupations and industry codes for the subset
of the data provided by Job Bank directly rather than the external providers. Since only
about one quarter of the data is from the Job Bank directly and most of the postings come
from the other sources, we will refrain from analyzing the variation in vacancies by industry.
    1
    We measure weeks from Wednesday - Tuesday, following the convention employed by Stata.
    2
    In particular, we are worried that the recovery in Québec is overstated as we observe some occupations
in which vacancy postings have recovered to their pre-period levels, which seems unlikely at this point.

                                                    1
Table 1: Distributions of Vacancy Postings across Source
Source Vacancies Percent
Careerbeacon 6,698 2.61
Employment Quebec 95,670 37.29
Job Bank 59,850 23.33
Jobillico 49,821 19.42
Jobpostings.ca 3,332 1.30
Monster 932 0.36
Saskjobs 11,292 4.40
Unknown 744 0.29
WorkBC 12,518 4.88
ZipRecruiter 15,691 6.12
Total 256,548 100.00%
2.2 The data is not representative of the Canadian Economy
It is very clear that the vacancy data from the Job Bank is not representative of job postings
in the Canadian economy. Unfortunately, the time-series of vacancies based on the Job Bank
data do not match the time-series from the Job Vacancy and Wage Survey (JVWS) well
either. This is worrisome given the latter are based on representative surveys of employers.
Figure 1 clearly shows for the period between the 1st quarter of 2015 and the 3rd quarter
of 2019 that the Job Bank data does not track the JVWS. The figure also illustrates the
main problem with the JVWS – the vacancy data is only available until the 3rd quarter of
2019, and data on the current situation will not be available from this source in a timely
manner to shape policy now. It is for this reason that we turn to the Job Bank data, while
at the same time noting the problems with this data.3
In the 1st quarter of 2020, we see 235,911 postings in the Job Bank data, clearly below
the long run average of open positions provided by the JVWS.
One of the main shortcomings of the Job Bank data is that its coverage varies across
provinces as evident in Table 2.
The number of vacancies posted by provinces is very uneven for reasons that are not
3
One lesson to be drawn from the current crisis for data collection agencies in Canada is that vacancy
data needs to be published in a more timely fashion to help policy making. In particular, at turning points of
the business cycle, a delay of multiple quarters is simply too long. Even though JVWS is a quarterly survey,
the data is collected continuously throughout the survey period and, to our understanding, the units sampled
in a given month are randomly drawn from the overall population surveyed. Thus, it should be possible to
provide monthly estimates of vacancies, even if later revisions to these numbers might be warranted. We
believe Statistics Canada should strive to release these vacancy counts close to the monthly publication of
the employment report based on the LFS to provide a more complete picture of the evolution of the labour
market.
2Figure 1: Job Vacancy and Wage Survey (JVWS) data vs Job Bank data
Note: Quarterly vacancies in the Job Bank data as well as estimates of vacancies by quarter from JVWS
related to overall labor demand across provinces. We reweigh the data to make the va-
cancy postings in the pre-period prior to March 15th proportional to the population size of
individuals 18+ of the different provinces as observed in the 2016 Canadian Census.
3 Variation in Total Vacancies Posted
We begin by showing the overall trend in vacancies. Figure 2 shows how the vacancies, as
measured by the Job Bank data, evolved between Jan 5th to April 28th . Clearly, there is a
rapid decline in vacancy postings to about 60% of the level prior to March 15th . The most
recent data (referring to the week ending on April 28th ) suggests that vacancies rebounded
to about three quarters of the number observed during the first half of March.
3Table 2: Distributions of Vacancy Postings across Provinces
Province Vacancies Percent
Newfoundland and Labrador 2,019 0.79
Prince Edward Island 1,156 0.45
Nova Scotia 4,619 1.80
New Brunswick 4,506 1.76
Québec 137,482 53.59
Ontario 40,890 15.94
Manitoba 3,293 1.28
Saskatchewan 13,356 5.21
Alberta 13,851 5.40
British Columbia 34,817 13.57
Northern Canada 559 0.22
Total 256,548 100.00%
4 Vacancies across Occupations
4.1 Across NOC-1 Occupation Groups
The data contains almost 500 occupation codes from the 2016 National Occupation Classi-
fication (NOC) system. We show here variation in postings in the immediate aftermath of
the shutdown across the broader classification scheme defined by the 1st digit of the NOC
system.
Table 3 shows the ratio of vacancies posted in the 3 weeks following March 15th relative
to the 3 weeks prior to March 15th by 1-digit NOC. Clearly the decline in vacancies in the
immediate aftermath of the crisis was very broad with most occupation groupings showing
declines in vacancies of between one-third and fifty percent. The only outlier in the data is
health which shows a significantly smaller decline in postings.
4.2 By Ability to Work from Home
Occupations differ in the ability of workers to perform work from home rather than on-site.
The ability to work-from-home has received significant attention in the public discussion
in recent weeks and has been seen as a feature that might shield employment in some
occupations and industries from employment loss. In the U.S., Kahn et al. (2020) show that
initial unemployment claims indeed increased by more in occupations that are amenable
to work-from-home even though UI claims increased across all occupations and nearly all
industries. Kahn et al. (2020) however also demonstrate that vacancy postings declined by
4Figure 2: Job Postings January 5 - April 21
Note: Based on Job Bank data provided by ESDC. Weekends omitted. Weighted to distribution across
Provinces. Weeks are defined to start on Wednesdays following the Stata convention.
more in occupations that could be performed from home rather than required being on-site.4
Here we show how labor demand as measured by vacancies in the Job Bank data varied
across occupations in health, as well as depending on whether they can be performed from
home or not. To determine the latter, we use the Dingel and Neiman (2020) score of the
ability to work-from-home based on the O*NET data. Dingel and Neiman (2020) assign to
each occupation a score varying between 0 and 1 that measures the ability to work from
home in this occupation. We map this score onto the 4-digit NOC system at our disposal.5
Figure 3 shows the distribution of this score in our data binning occupations into 5
groups. Clearly, there are many occupations that fall on the end-points of the distribution.
4
They exclude health and essential retail, mostly grocery stores, from occupations that require work
on-site.
5
Approximately 0.35% of vacancies in the Job Bank data did not have a valid NOC code. We exclude
these vacancies from the analysis.
5Table 3: Ratio of Vacancies Prior and Post March 15th, by Occupation
Occupation Post- / Pre-March 15th
Vacancies
Management 0.63
Business, Finance, Administration 0.63
Sciences & related 0.67
Health 0.88
Education, Social, Government 0.61
Arts & Culture 0.59
Sales & Services 0.53
Trades & Transport 0.62
Nat. resources & Agriculture 0.64
Manufacturing & Utilities 0.55
Total 0.63
We then proceed to categorize an occupation as an occupation that can be performed from
home if its score exceeds 0.5. Given the distribution shown in Figure 3, our estimates are
not sensitive to changing the cutoff point of 0.5. We exclude health from this as demand
for healthcare workers clearly was subject to different considerations during the crisis. We
therefore obtain a classification scheme with 3 categories: 1. Health, 2. Wfh (work from
home), and 3. Not-Wfh, where the latter two only apply to non-health occupations.
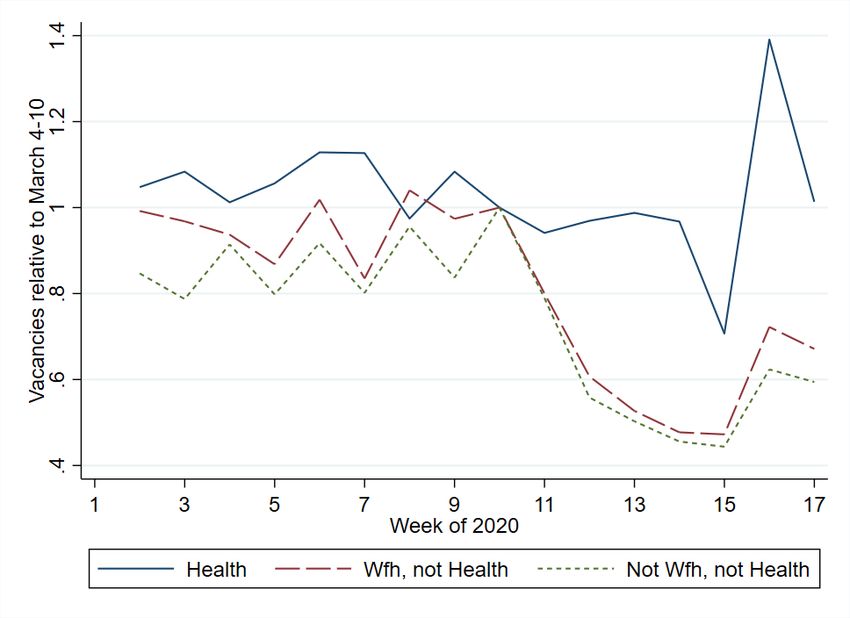
Clearly, health follows its own patterns in that the decline in vacancies was less pro-
nounced in the immediate aftermath and that the most recent increase in vacancies was
unusual strong in this profession.
The ability to work-from-home however has no impact on labor demand as measured by
vacancy postings. For both categories we see that demand declined by about 50% in the first
4 weeks of the crisis with a recovery to about 60-70% of the pre-period in the week ending on
April 21st . We interpret this as evidence that the deterioration of the labour market is broad
and driven by factors beyond the immediate ability to perform the work. This is consistent
with the data coming out of the U.S. (See Kahn et al. (2020)). Unfortunately, our data does
not allow us to separately consider essential and non-essential industries as they do.
5 Across Provinces
We close by examining the variation in postings across provinces and time. Table 5 shows
the decline across 3 week periods prior and post to the pivotal March 15th as in Table 3,
except for provinces instead of by occupational categories.
This table shows that the decline in vacancy postings was broad based and of roughly
6Figure 3: Distribution of Ability to Work from Home
Note: The histogram plots 5-bin histogram of vacancies posted in the 3 weeks prior to March 15th by the
Dingel-Neiman score of ability to work from home. We mapped the Dingel-Neiman score onto the 4-digit
NOC.
similar magnitude.
The same is not true for the recent rebound in vacancies. Figure 5 shows that this
was substantially more pronounced in Québec than in the other large provinces (Alberta,
BC, and Ontario). The other provinces did see a rebound in the last two weeks but it was
significantly smaller. Given that we observe this only for one week and that it is somewhat
limited geographically, we think it prudent to wait for another few weeks to see whether this
rebound is real or due to an aberration of the data.
7Figure 4: Vacancy Postings relative to week of March 4-10
Note: The graph shows the ratio of vacancy posted in health (NOC-Digit 3) as well as by ability to work
from home (Dingel-Neiman>0.5)
Table 4: Ratio of Vacancies Prior and Post March 15th , by Province
Province Post- / Pre-March 15th
Vacancies
Newfoundland and Labrador 0.48
Prince Edward Island 0.49
Nova Scotia 0.61
New Brunswick 0.48
Québec 0.56
Ontario 0.64
Manitoba 0.54
Saskatchewan 0.51
Alberta 0.65
British Columbia 0.65
Northern Canada 0.44
Total 0.55
8Figure 5: Vacancy Postings across the 4 largest Provinces
Note: normalized against March 4-10
9References
Dingel, Jonathan I., and Brent Neiman (2020) ‘How many jobs can be done at home?’
Working Paper 26948, National Bureau of Economic Research, April
Kahn, Lisa B., Fabian Lange, and David G. Wiczer (2020) ‘Labor demand in the time
of COVID-19: Evidence from vacancy postings and UI claims.’ Working Paper 27061,
National Bureau of Economic Research, April
10You can also read