Vaccines alone are no silver bullets: a modeling study on the impact of efficient contact tracing on COVID-19 infection and transmission in Malaysia
←
→
Page content transcription
If your browser does not render page correctly, please read the page content below
International Health 2022; 0: 1–10
https://doi.org/10.1093/inthealth/ihac005 Advance Access publication 0 2022

Vaccines alone are no silver bullets: a modeling study on the impact of

                                                                                                                                                 ORIGINAL ARTICLE
  efficient contact tracing on COVID-19 infection and transmission
                              in Malaysia

                                                                                                                                                         Downloaded from https://academic.oup.com/inthealth/advance-article/doi/10.1093/inthealth/ihac005/6545987 by guest on 04 July 2022
     Dhesi Baha Rajaa , Nur Asheila Abdul Taiba , Alvin Kuo Jing Teob , Vivek Jason Jayarajc and Choo-Yee Tingd,∗

  a
    Ainqa Health, Lot 7.01 B & C, Menara BRDB, 285 Jalan Maarof, Bukit Bandaraya, 59000 Kuala Lumpur, Malaysia; b Saw Swee Hock
 School of Public Health, National University of Singapore, National University Health System, 12 Science Drive 2, #10-01, Singapore
117549; c Department of Social and Preventive Medicine, Level 5, Block I, Faculty of Medicine, Universiti Malaya, 50603, Kuala Lumpur,
 Malaysia; d Faculty of Computing and Informatics, Multimedia University, Persiaran Multimedia, 63100 Cyberjaya, Selangor, Malaysia
                                    ∗ Corresponding   author: Tel: +60133996236; E-mail: cyting@mmu.edu.my

         Received 9 September 2021; revised 26 October 2021; editorial decision 25 January 2022; accepted 31 January 2022

           Background: The computer simulation presented in this study aimed to investigate the effect of contact tracing
           on coronavirus disease 2019 (COVID-19) transmission and infection in the context of rising vaccination rates.
           Methods: This study proposed a deterministic, compartmental model with contact tracing and vaccination
           components. We defined contact tracing effectiveness as the proportion of contacts of a positive case that was
           successfully traced and the vaccination rate as the proportion of daily doses administered per population in
           Malaysia. Sensitivity analyses on the untraced and infectious populations were conducted.
           Results: At a vaccination rate of 1.4%, contact tracing with an effectiveness of 70% could delay the peak of
           untraced asymptomatic cases by 17 d and reduce it by 70% compared with 30% contact tracing effectiveness.
           A similar trend was observed for symptomatic cases when a similar experiment setting was used. We also per-
           formed sensitivity analyses by using different combinations of contact tracing effectiveness and vaccination
           rates. In all scenarios, the effect of contact tracing on COVID-19 incidence persisted for both asymptomatic and
           symptomatic cases.
           Conclusions: While vaccines are progressively rolled out, efficient contact tracing must be rapidly implemented
           concurrently to reach, find, test, isolate and support the affected populations to bring COVID-19 under control.

Keywords: contact tracing, COVID-19, transmission, vaccination.

Introduction                                                              tifying and isolating those in close contact with an infected in-
                                                                          dividual.4 It leverages proximity and geospatial technologies to
The pandemic caused by severe acute respiratory syndrome coro-            provide a comprehensive approach to collect spatio-temporal
navirus 2 (SARS-CoV-2) has infected >200 million people and led           data.5,6 The data can be used to study the movement and inter-
to 4.5 million deaths worldwide, as of 26 August 2021.1 Since             action of humans across time, which can then be utilized further
January 2021, approximately 2 billion people have been fully vac-         for investigating disease transmissions such as COVID-19, TB and
cinated against coronavirus disease 2019 (COVID-19), with sev-            other communicable diseases. Successful digital contact tracing
eral countries, mostly upper middle-income economies, having              can keep the reproduction number(R0 ) under control, while fail-
reached 70% full vaccination to date.1,2 Despite this, the pan-           ing to have efficient digital contact tracing could cause the num-
demic shows no sign of abatement, with the spread of the delta            ber of daily cases to increase exponentially. A study conducted
variant triggering new outbreaks in many countries globally.3             by Mizumoto et al. has shown that, for COVID-19, 70% of trans-
   Governments of various countries have started to invest in             missions occur before someone is symptomatic,7 indicating the
digital contact tracing since 2020. Digital contact tracing is an         importance of having a speedy and accurate contact tracing
approach to disrupt the chains of disease transmission by iden-           mechanism. Another study performed by Abueg et al. has also

© The Author(s) 2022. Published by Oxford University Press on behalf of Royal Society of Tropical Medicine and Hygiene. This is an Open Access
article distributed under the terms of the Creative Commons Attribution License (https://creativecommons.org/licenses/by/4.0/), which
permits unrestricted reuse, distribution, and reproduction in any medium, provided the original work is properly cited.

                                                                                                                                             1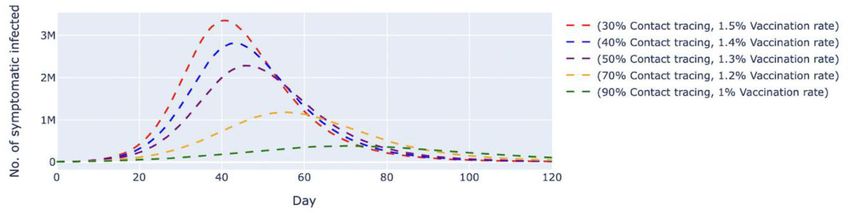
D. Baha Raja et al.

reported that if digital contact tracing is used by 75% of the pop-
ulation, the number of infections can be reduced by 73–79%.8                Table 1. Description of compartments in the SEIRV model
     Among those fully vaccinated, reports of breakthrough infec-
tions, severe illness and deaths have since been reported in coun-          State variable   Description
tries like Iran and Indonesia.9,10 The evidence on the protective
                                                                            S                Susceptible individuals
effect of several COVID-19 vaccines in the WHO Emergency Use
                                                                            T                Infected individuals in latent period (exposed)
Listing against the delta variant has gradually emerged, with their

                                                                                                                                                Downloaded from https://academic.oup.com/inthealth/advance-article/doi/10.1093/inthealth/ihac005/6545987 by guest on 04 July 2022
                                                                                               that were traced and quarantined
reported effectiveness being lower than the protection conferred
                                                                            E                Infected individuals in latent period (exposed)
against the alpha variant.11–13 Nevertheless, the evidence thus far
                                                                                               that were untraced
indicates that vaccines are effective against symptomatic and
                                                                            Qsym             Symptomatic infectious individuals that were
severe COVID-19,12,14,15 and vaccine uptake and administration
                                                                                               traced and quarantined
should be ramped up globally. From a public health perspective,
                                                                            Qasym            Asymptomatic infectious individuals that were
it is vital to reduce the transmission and incidence of infection to
                                                                                               traced and quarantined
protect pockets of populations that could not be vaccinated and
                                                                            Isym             Symptomatic infectious individuals that were
to allow economies to open in a safe and calibrated manner.
                                                                                               untraced
     As of 26 August 2021, the cumulative number of COVID-19
                                                                            Iasym            Asymptomatic infectious individuals that were
cases in Malaysia exceeded 1.5 million, and the daily new con-
                                                                                               untraced
firmed cases per 100 000 population remains one of the high-
                                                                            R                Recovered individuals with immunity
est in the world.1 Although Malaysia has consistently rolled out
                                                                            D                Deaths due to COVID-19
400 000–500 000 doses of vaccines per day since July 2021 and
                                                                            V                Vaccinated individuals
implemented multiple iterations of movement control orders
with different measures since March 2020, the pandemic contin-
ues to rage, with a record number of cases and deaths daily. Con-
tact tracing efforts are also severely hampered due to the strain        (D) and vaccinated (V). The susceptible compartment (S)
on the public health system, resulting in missed contacts, who           was composed of all healthy individuals who could get in-
might have been infected but did not know their risk, to delay           fected with SARS-CoV-2. Individuals in the exposed com-
testing and further transmit the virus.16,17                             partment (E) were those who had been infected with the
     It is increasingly evident that a single intervention, be it vac-   virus but remained in their latent period and untraced. The
cine, public health or social measures, is insufficient to control       traced exposed (T) compartment referred to infectives in their
COVID-19. Hence, in this theoretical strategy exploration study,         latent period who were successfully traced and isolated. The
we aimed to investigate the importance of implementing effec-            quarantined symptomatic infected (Qsym ) compartment com-
tive contact tracing on COVID-19 transmission and infection in           prised infected individuals who were infectious with symptoms
the context of rising vaccination rates using a deterministic, com-      and in quarantine either at home or in hospital, whereas the quar-
partmental modeling approach as an experimental basis for our            antined asymptomatic infected (Qasym ) compartment was com-
discussion.                                                              posed of those infectious individuals without symptoms and in
                                                                         quarantine. Individuals in the symptomatic infected (Isym ) com-
                                                                         partment referred to those untraced infectious individuals who
                                                                         have developed the symptoms, while those untraced infectious
Materials and Methods                                                    individuals without symptoms belonged in the asymptomatic in-
Design                                                                   fected (Iasym ) compartment. Those who recovered with COVID-19
                                                                         immunity made up the recovered (R) compartment, and those
First, we proposed a novel transmission model that factored in           who received COVID-19 immunity through vaccination formed
contact tracing effectiveness and vaccination. Next, we deter-           the vaccinated (V) compartment. Lastly, victims who died from
mined the parameters using estimations based on Malaysian                COVID-19 were represented by the compartment D. Individuals
COVID-19 data and information from published literature. Finally,        could transition from one compartment over time but were only
we conducted sensitivity analyses of the parameters on the               allowed to be in one compartment at a time. These compart-
number of untraced, infectious individuals.                              ments are summarized in Table 1.

Epidemic model                                                           Model assumptions
We developed a deterministic, compartmental susceptible-                 The susceptibles (S) could become infectives when they met with
exposed-infected-recovered-vaccinated (SEIRV) model to study             either symptomatic (Isym ) or asymptomatic (Iasym ) infectious in-
the transmission dynamics of COVID-19 when contact trac-                 dividuals at different transmission rates of βsym or βasym , respec-
ing and vaccination were incorporated. The human popula-                 tively. This transmission rate was the product of contact rate and
tion was subdivided into 10 classes according to their dis-              the probability of transmission given contact. In this paper, we
ease status, namely, the susceptibles (S), exposed (E), traced           assumed that these public health and social measures (PHSM)
exposed (T), quarantined symptomatic infected (Qsym ), quar-             did not vary across time and that the population was not parti-
antined asymptomatic infected (Qasym ), symptomatic infected             tioned according to age or comorbidity. Also, natural births and
(Isym ), asymptomatic infected (Iasym ), recovered (R), death            deaths were not considered. Our focus was on analyzing the

2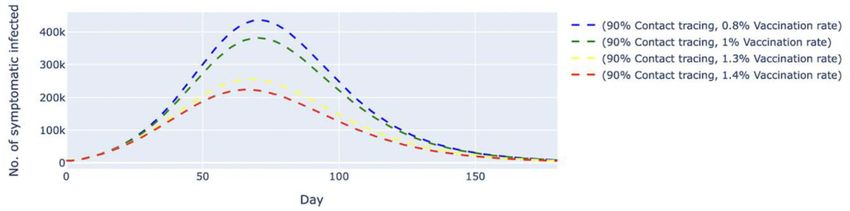
International Health

‘trace and isolate’ policy, whereby tracing could be done manu-            protection and will not be infected after interacting with an in-
ally or through an automated process using tracing apps. Hence,            fectious individual, except for when they have lost their acquired
we subdivided the exposed compartment (infectives in the latent            immunity due to the probability of vaccination failure (1–p). The
period) further into traced exposed (T) and untraced exposed (E)           dynamics of transmission are visualized in Figure 1, with the de-
compartments, that is, compartments (E, T ) are the subpopula-             scription of parameters listed in Table 2.
tions of the exposed population separated according to their con-
tact tracing status. The implementation of the ‘trace and isolate’
                                                                           Model equations

                                                                                                                                                Downloaded from https://academic.oup.com/inthealth/advance-article/doi/10.1093/inthealth/ihac005/6545987 by guest on 04 July 2022
approach could reduce the transmission of COVID-19 by forcing
the traced exposed individuals into quarantine (T) through self-           Following the previous assumptions, our SEIRV model was
isolation. Therefore, we assumed that all the traced individuals in        described by a non-linear system of 10 ordinary differential equa-
quarantine (T) will have full compliance.                                  tions with 12 parameters:
    As they were unaware of their disease status, asymptomatic
infectious individuals (Iasym ) would continue to contribute to the                 dS
                                                                                       = (1 − p) αV − (βsym ωτ SIsym + βasym SIasym
transmission of the virus when they met another susceptible at                      dt
a rate of βasym , leading to untraced infectives in the E compart-                        + βsym (1 − ωτ ) SIsym + v pS),
ment. Following the work of Grimm and colleagues,18 the pa-
rameter ω denoted the proportion of the symptomatic infectious                    dT
population (Isym ) detected by the health authorities out of all                      = βsym ωτ SIsym − σ T,
                                                                                  dt
symptomatic infections, while the parameter τ was the contact
                                                                                  dE
tracing effectiveness that described the fraction of the contacts                     = βsym (1 − ωτ ) SIsym + βasym SIasym − σ E,
traced either manually or via digital tools such as tracing apps.                 dt
Hence, the product ωτ gave the total proportion of infectives in                  dQsym
                                                                                         = (1 − ε ) σ T − γsym + μ Qsym ,
their latent period who were successfully traced and transitioned                   dt
into the (T) compartment at a rate of βsym , whereas (1–ωτ ) re-                  dQasym
                                                                                          = εσ T − γasym Qasym ,
ferred to tracing failures and, thus, (1–ωτ ) proportion of infectives              dt
would enter the untraced exposed (E) compartment at a rate                        dIsym
of βsym .                                                                                = (1 − ε ) σ E − γsym + μ Isym ,
                                                                                   dt
    Furthermore, infectives in their latent period (E, T) would be-               dIasym
come infectious at a rate of σ , which denoted the reciprocal of                         = εσ E − γasym Iasym ,
                                                                                    dt
the latent period. With ε as the fraction of exposed individuals
                                                                                  dR
(E, T) who were asymptomatic, then εσ E would be the num-                             = γsym Qsym + Isym + γasym Qasym + Iasym ,
ber of untraced exposed (E) entering the asymptomatic infec-                      dt
tious compartment (Iasym ), while εσ T referred to the number of                  dD
                                                                                      = μ Isym + Iasym and
traced exposed (T) who would move into the asymptomatic in-                       dt
fectious quarantine (Qasym ) compartment. This gives (1–ε) as the                 dV
                                                                                      = v pS − (1 − p) αV,
fraction of the exposed population (E, T) who were symptomatic,                   dt
which leads to (1–ε)σ E, the number of untraced exposed (E) mov-           with initial conditions S (0) = S0 > 0, T > 0, E (0) = E0 > 0,
ing into the symptomatic infectious compartment (Isym ), whereas           Qsym (0) = Qsym 0 > 0, Qasym (0) = Qasym 0 > 0, Isym (0) =
(1–ε)σ T is the number of traced exposed (T) entering the asymp-           Isym 0 > 0, Iasym (0) = Iasym 0 > 0, R (0) = R0 > 0, D (0) = D0 >
tomatic infectious quarantine (Qsym ) compartment. We assumed              0, and V (0) = V0 > 0.
that only symptomatic infected individuals could die from COVID-
19 at a rate of μ thus entering the D compartment. We also
assumed that the disease-induced death rate (μ) was constant               Parameter estimations
and unaffected by disease severity and hospital capacity. Symp-            The values of parameters in this paper were either estimated
tomatic infected individuals (Isym , Qsym ) would recover at a rate        using Malaysian COVID-19 data or adapted from the literature.
of γsym , which was the reciprocal of the duration of infectious-          From a COVID-19 modeling study in Malaysia conducted by Gill
ness of symptomatic patients. On the other hand, asymptomatic              et al.,19 we took the average contacts per day per case (n=25)
infected individuals (Iasym , Qasym ) would recover at a rate of γasym ,   and the probability of transmission given contact with symp-
which was the reciprocal of the duration of infectiousness of              tomatic individuals (=0.05), whereby the transmission probability
asymptomatic patients. Finally, we incorporated vaccination into           was based on the infectiousness of the original COVID-19 strain
the model. In this work, the vaccine functioned by reducing the            during early 2020. We calculated the transmission rate β as
number of susceptibles, thus preventing further infections at a            the product of the two, which gave us 25×0.05=1.25. However,
rate of v p, which referred to the product of vaccination coverage         because we assumed that the population was closed with a con-
and the probability of vaccination success. The parameters (1–p)           stant size (N=32 600 000; i.e., the total Malaysian population),
and α denoted the probability of vaccination failure in preventing         we divided the transmission rate β by N to get our final βsym
transmissions and the reciprocal duration for the waning of vac-           as 3.8 × 10⁻⁸ . To calculate βasym , we followed the same steps
cine immunity, respectively. Hence, (1–p)αV gave the number of             but replaced the probability of transmission given contact with
vaccinated individuals who would move back to being suscepti-              asymptomatic individuals (=0.02) from Churches and Jorm,20 to
bles (S). We assumed that the vaccinated individuals gain perfect          get the βasym as 1.5 × 10⁻⁸ .

                                                                                                                                           3
D. Baha Raja et al.

                                                                                                                                              Downloaded from https://academic.oup.com/inthealth/advance-article/doi/10.1093/inthealth/ihac005/6545987 by guest on 04 July 2022
Figure 1. Transmission diagram of the SEIRV model.

    Table 2. Parameter descriptions

    Parameter                                                  Description

    βsym                                                       Transmission rate of symptomatic individuals per day per case
    βasym                                                      Transmission rate of asymptomatic individuals per day per case
    ω                                                          Fraction of symptomatic individuals identified by health authorities per day
    τ                                                          Fraction of contacts traced per case either manually or via digital tools
    σ                                                          Reciprocal of the latent period
    γasym                                                      Reciprocal of the infectious period of asymptomatic individuals
    γsym                                                       Reciprocal of the infectious period of symptomatic individuals
    ε                                                          Fraction of asymptomatic infectious individuals per day
    μ                                                          Disease-induced death rate
    v                                                          Vaccination coverage per day
    p                                                          Probability of vaccination success
    α                                                          Reciprocal of the time taken for waning vaccine immunity

    We defined the effectiveness of contact tracing as the propor-   as well as for our simulation exercise. Other parameters obtained
tion of contacts of a positive case that was successfully traced.    from the literature review are summarized in Table 3.
In Malaysia, we estimated that the proportion of contacts of a
COVID-19 case traced per case varied from 30 to 40%.21,22 Hence,
we have taken the midpoint of the interval (35%) as the esti-        Sensitivity analysis
mated contact tracing effectiveness in Malaysia in one of our        In order to solve our SEIRV model, we implemented a numer-
simulation scenarios (i.e., scenario 4). The vaccination coverage    ical integration method, Runge–Kutta of order 5, by using the
per day (v) was estimated from Malaysian vaccination statis-         solve_ivp function from the scipy.integrate module in Python
tics, where around 1.0–1.5% of the total population were vacci-      (Python Software Foundation, version 2.7) along with the param-
nated daily. Also, we included the values for vaccination coverage   eter values in Table 3. Next, to study the dynamics of transmis-
(v=0.8%) and contact tracing effectiveness (τ =50, 70 and 90%),      sion of COVID-19 concerning contact tracing and vaccination, we

4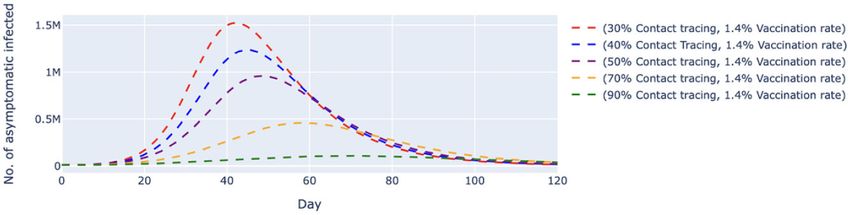
International Health
Downloaded from https://academic.oup.com/inthealth/advance-article/doi/10.1093/inthealth/ihac005/6545987 by guest on 04 July 2022
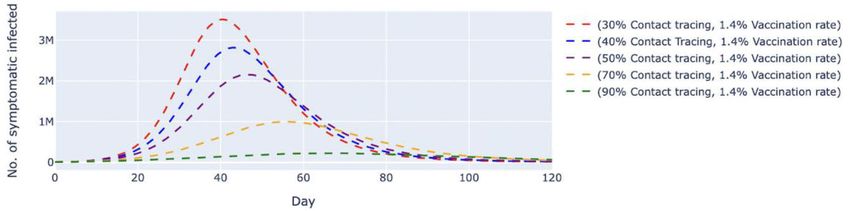
Figure 2. Simulated number of untraced, COVID-19 asymptomatic cases with fixed vaccination rate and varied contact tracing effectiveness. The
vaccination rate per day was fixed at 1.4%, which translates to approximately 450 000 doses of vaccine, and the contact tracing effectiveness varied
from 30 to 90%. The dashed lines represent the simulated number of untraced COVID-19 asymptomatic cases for five different contexts over 120 d.
M, million.
tracing effectiveness was at 30%, the number of untraced,
Table 3. Parameter values asymptomatic cases would peak at day 42 with approximately
1.52 million cases before gradually slowing down; the peak
Parameter Value Source decreases as the effectiveness of contact tracing increases (Fig-
ure 2). When contact tracing effectiveness was increased to 70%,
βsym 3.8 × 10⁻⁸ 19
the peak was delayed by about 17 d, with the highest number of
βasym 1.5 × 10⁻⁸ 20
daily cases at 459 000, which was about a 70% reduction from
ω 0.9 19
the number estimated when contact tracing effectiveness was
τ 0.9, 0.7, 0.5, 0.4, estimated,
at 30%. It can be observed that a contact tracing effectiveness
0.3 dynamic
of 90% would almost flatten the curve. Similar behavior could
σ 1/5 18
be observed for the untraced, symptomatic cases in Figure 3, in
γasym 1/10 18
which a combination of a high vaccination rate (1.4%) and low
γsym 1/12.5 18
contact tracing effectiveness (30%) would cause the peak of the
ε 0.25 18
cases to be at about 3.5 million on day 40. When we increased
μ 0.02 20
the contact tracing effectiveness to 70%, the peak was delayed
v 0.014, 0.012, estimated,
by about 15 d, with approximately 1 million cases, which was
0.01, 0.008 dynamic
29
about 29% of those estimated when contact tracing was at 30%
p 0.9
effectiveness. When contact tracing effectiveness increased, the
α 1/30 29
peaks for both cases were delayed and lowered.
In scenario 2, we conducted simulations by pairing higher
contact tracing effectiveness with a lower daily vaccination rate
and vice versa. Despite a higher vaccination rate, the simulated
conducted sensitivity analyses of the parameters on the un- trend of new daily untraced, asymptomatic cases contingent
traced, infectious individuals. We were interested in observing on 30% contact tracing effectiveness was estimated to peak at
the simulation on Iasym and Isym as these populations would con- day 42 with 1.46 million cases. The variant with 90% contact
tribute to forward transmission because they were not traced and tracing effectiveness but a lower vaccination rate delayed peak-
isolated. Hence, an uncontrolled number of Iasym and Isym would ing at day 74 with 182 000 cases (Figure 4). The same trends
in turn lead to a potential surge in future total COVID-19 cases. were observed among symptomatic cases (Figure 5). A low con-
We varied the values of vaccination coverage v and contact trac- tact tracing effectiveness of 30%, with a high daily vaccination
ing effectiveness τ and investigated the effects of the changes rate of 1.5%, would lead to a peak of 3.35 million untraced,
on Iasym and Isym . We prepared four scenarios, as summarized in symptomatic cases on day 41. The scenario with the combi-
Table 4. nation of 90% contact tracing effectiveness and a vaccination
rate of only 1% managed to delay the peak to day 72 with
381 000 cases.
We also simulated two other scenarios where the contact
Results tracing effectiveness was fixed at 90% (Figures 6 and 7) and 35%
Scenario 1 simulated five different contact tracing effectiveness (Figures 8 and 9), respectively. In both scenarios, the vaccination
values ranging from 30 to 90% against the backdrop of a fixed rates varied from 0.8 to 1.4% per day. At 90% contact tracing
vaccination rate of 1.4% per day (Figures 2 and 3). This scenario effectiveness (Figure 6), the peaks for all permutations occurred
assumed that the vaccine was administered at a rate of approx- at around the same time (day 68 to day 73) and ranged from
imately 450 000 doses per day. We found that when contact 107 000 to 207 000 cases. The estimated highest number of
5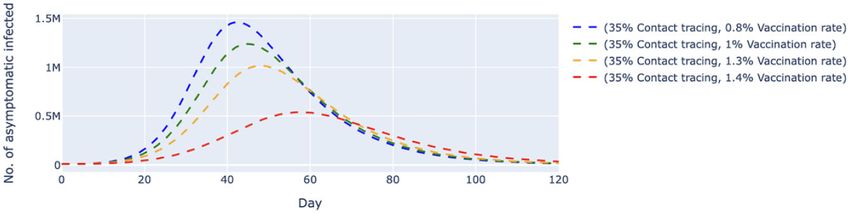
D. Baha Raja et al.

    Table 4. Scenarios for sensitivity analysis

    Scenario         Fixed parameter                     Value (/day)       Varying parameter(s)                  Value (/day)

    1                Vaccination coverage                   1.4%            Contact tracing effectiveness         30%, 40%, 50%, 70%, 90%
    2                              —                                        (Contact tracing effectiveness,       (30%, 1.5%), (40%, 1.4%),

                                                                                                                                                       Downloaded from https://academic.oup.com/inthealth/advance-article/doi/10.1093/inthealth/ihac005/6545987 by guest on 04 July 2022
                                                                              vaccination coverage)                 (50%, 1.3%), (70%, 1.2%),
                                                                                                                    (90%, 1%)
    3                Contact tracing effectiveness          90%             Vaccination coverage                  0.8%, 1%, 1.3%, 1.4%
    4                Contact tracing effectiveness          35%             Vaccination coverage                  0.8%, 1%, 1.3%, 1.4%

Figure 3. Simulated number of untraced, COVID-19 symptomatic cases with fixed vaccination rate and varied contact tracing effectiveness. The
vaccination rate per day was fixed at 1.4%, which translates to approximately 450 000 doses of vaccine, and the contact tracing effectiveness varied
from 30 to 90%. The dashed lines represent the simulated number of untraced COVID-19 symptomatic cases for five different contexts over 120 d. M,
million.

Figure 4. Simulated number of untraced, COVID-19 asymptomatic cases with varied vaccination rates and contact tracing effectiveness. The vaccina-
tion rates per day varied from 1 to 1.5%, which translates to approximately 320 000 and 480 000 doses of vaccine, respectively. The contact tracing
effectiveness varied from 30 to 90%. The dashed lines represent the simulated number of untraced COVID-19 asymptomatic cases for five different
contexts over 120 d. M, million.

daily untraced, asymptomatic cases differed by approximately               effectiveness (Figure 8), the estimated number of daily untraced
100 000 between high and low vaccination rates when contact                asymptomatic cases was 540 000 on day 57 when the vaccina-
tracing effectiveness was fixed. The increase in the vaccination           tion rate was 1.4%. A similar trend could be seen for the untraced,
rate could only delay the peak but failed to lower the peak                symptomatic cases in Figure 9, whereby a high vaccination rate
significantly. For the untraced symptomatic cases in Figure 7,             (1.4%) but low contact tracing effectiveness (35%) could still
a combination of a low vaccination rate (1%) and high contact              cause the peak of cases to be 1.2 million on day 54. Furthermore,
tracing effectiveness (90%) could successfully reduce the high-            results from an additional sensitivity analysis on the transmission
est number of daily cases to about 381 000 at day 70. Under                rate of symptomatic infected cases can be found in the sup-
the same circumstances, except for a lower contact tracing                 plementary material. The simulation showed that the number

6
International Health
Downloaded from https://academic.oup.com/inthealth/advance-article/doi/10.1093/inthealth/ihac005/6545987 by guest on 04 July 2022
Figure 5. Simulated number of untraced, COVID-19 symptomatic cases with varied vaccination rates and contact tracing effectiveness. The vaccination
rates per day varied from 1 to 1.5%, which translates to approximately 320 000 and 480 000 doses of vaccine, respectively. The contact tracing
effectiveness varied from 30 to 90%. The dashed lines represent the simulated number of untraced COVID-19 symptomatic cases for five different
contexts over 120 d. M, million.
Figure 6. Simulated number of untraced, COVID-19 asymptomatic cases with fixed contact tracing effectiveness at 90% and varied vaccination rates.
The contact tracing effectiveness was fixed at 90% and the vaccination rates per day varied from 0.8 to 1.4%, which translates to approximately
260 000 and 450 000 doses of vaccine, respectively. The dashed lines represent the simulated number of untraced COVID-19 asymptomatic cases for
five different contexts over 160 d. k, thousand.
of daily cases was highly affected by the transmission rates of cination rates. We observed that a combination strategy of a
symptomatic infected, even when the daily vaccination rate high daily vaccination rate and low contact tracing effectiveness
and contact tracing effectiveness were high. Lower transmission would significantly increase the untraced infectious population.
rates, which indicate effective social distancing measures, would While the vaccine has been presented as one of the most vital
reduce and delay the peak of daily cases. tools to take us towards the restoration of postpandemic nor-
mality, we found that contact tracing is key to COVID-19 con-
trol. However, the ability of countries to perform contact trac-
Discussion ing is challenged by a lack of human resources (contact tracers)
and compliance with self-isolation orders, as well as a paucity of
The pandemic saw major movement and travel restrictions, lock- timely and accurate contacts data. Successes observed in coun-
downs and personal protective measures, implemented globally tries like Singapore and South Korea leveraged technology to
in various forms and stringency. The PHSM are effective in limit- aid contact tracing,6 and the integration of digital technology
ing COVID-19 transmission and death.23 However, some of the with the conventional contact tracing approach could result in a
interventions, particularly lockdowns and a cessation of eco- swifter response to stem COVID-19 transmission.
nomic activities, have negatively impacted the economies and In Malaysia, personal details are collected for entry to all
psychosocial well-being of the affected populations.24,25 One ma- premises outside of one’s residence using a mobile application
jor component of PHSM is the enhancement of surveillance and (MySejahtera) or are documented in writing for contact tracing
response actions through contact tracing, testing and isolating purposes.26,27 However, the contact tracing of private social
close contacts, as well as providing the necessary support mech- gatherings in homes remains an issue and has to be carried
anisms.23 out manually, therefore hampering the effectiveness of contact
In this paper, we simulated the impact of contact tracing on tracing. With the rapid increase in COVID-19 infections and an
COVID-19 transmission and infection in the context of rising vac- overwhelmed public health system, the effectiveness of contact
7D. Baha Raja et al.
Downloaded from https://academic.oup.com/inthealth/advance-article/doi/10.1093/inthealth/ihac005/6545987 by guest on 04 July 2022
Figure 7. Simulated number of untraced, COVID-19 symptomatic cases with fixed contact tracing effectiveness at 90% and varied vaccination rates.
The contact tracing effectiveness was fixed at 90% and the vaccination rates per day varied from 0.8 to 1.4%, which translates to approximately
260 000 and 450 000 doses of vaccine, respectively. The dashed lines represent the simulated number of untraced COVID-19 symptomatic cases for
five different contexts over 160 d. k, thousand.
Figure 8. Simulated number of untraced, COVID-19 asymptomatic cases with fixed contact tracing effectiveness at 35% and varied vaccination rates.
The contact tracing effectiveness was fixed at 35%, and the vaccination rates per day varied from 0.8 to 1.4%, which translates to approximately
260 000 and 450 000 doses of vaccine, respectively. The dashed lines represent the simulated number of untraced COVID-19 asymptomatic cases for
five different contexts over 120 d. M, million.
tracing in Malaysia has been hindered and currently stands at ibrated to reflect the observed outbreaks in Malaysia and fore-
approximately 30 to 40%.21,22 Given the significance of contact cast future trends. Hence, further parameterization using local
tracing in controlling the spread of infectious diseases, it is pivotal data is warranted to generate outcome estimates more salient
to capitalize contacts data and automate the data processing to Malaysia.
and application process,4 as well as to develop more efficient Contact tracing has been at the forefront in controlling the
strategies to improve the effectiveness of contact tracing. spread of infectious diseases, and an effective and efficient
In this study, we modeled the number of untraced cases, system could prevent the spread of disease, save lives and
both symptomatic and asymptomatic. Because this population allow the economy to resume.28 While vaccination rates have
contributes to forward transmission, an uncontrolled number of progressively increased in Malaysia and some parts of the world,
these untraced and unisolated individuals could potentially cause efficient contact tracing must be rapidly implemented to reach,
a surge in COVID-19 cases. In addition to transmission and infec- find, test, isolate and support the affected populations to bring
tion, future work could be considered using an extended model COVID-19 under control.
that incorporates disease severities and health system capacity
to estimate the effect of contact tracing on COVID-19 mortal-
ity. Furthermore, we set the two main intervention parameters—
Conclusions
contact tracing and vaccine—to approximate the ground realities
in Malaysia. Notwithstanding testing only on these two PHSMs, we This study showed that effective contact tracing is a critical
observed that the scenario with low contact tracing and increas- component in COVID-19 control. Our findings indicate the need
ing vaccination rates successfully mimicked the current transmis- to inform immediate intervention, such as by using technology
sion trend in Malaysia. However, it should be noted that this is a and automation, in improving the effectiveness and efficiency of
theoretical strategy exploration study, as the model was not cal- the contact tracing strategy to reduce COVID-19 transmission,
8International Health
Downloaded from https://academic.oup.com/inthealth/advance-article/doi/10.1093/inthealth/ihac005/6545987 by guest on 04 July 2022
Figure 9. Simulated number of untraced, COVID-19 symptomatic cases with fixed contact tracing effectiveness at 35% and varied vaccination rates.
The contact tracing effectiveness was fixed at 35%, and the vaccination rates per day varied from 0.8% to 1.4%, which translates to approximately
260 000 and 450 000 doses of vaccine, respectively. The dashed lines represent the simulated number of untraced COVID-19 symptomatic cases for
five different contexts over 120 d. M, million.
infection and death in Malaysia and other countries affected by 6 Huang Z, Guo H, Lee Y-M, et al. Performance of digital contact tracing
COVID-19. tools for COVID-19 response in Singapore: cross-sectional study. JMIR
Mhealth Uhealth. 2020;8(10):e23148.
7 Mizumoto K, Kagaya K, Zarebski A, et al. Estimating the asymp-
Supplementary data tomatic proportion of coronavirus disease 2019 (COVID-19) cases on
board the Diamond Princess cruise ship, Yokohama, Japan, 2020. Euro
Supplementary data are available at International Health online. Surveill. 2020;25(10):2000180.
8 Abueg M, Hinch R, Wu N, et al. Modeling the effect of exposure no-
tification and non-pharmaceutical interventions on COVID-19 trans-
mission in Washington state. npj Digit Med. 2021;4(1):1–10.
Authors’ contributions: DBR, NAAT, AKJT and VJJ conceptualized and de- 9 Dyer O. Covid-19: Indonesia becomes Asia’s new pandemic epicentre
signed the study. NAAT and AKJT performed the modeling and analysis; as delta variant spreads. BMJ. 2021;374:n1815.
and wrote the manuscript. DBR and CYT coordinated the execution of the
study. VJJ and CYT proofread the manuscript and contributed to the inter- 10 Nowroozi A, Rezaei N. Severe acute respiratory coronavirus virus
pretation of the results. All the authors read and approved the manuscript 2 (SARS-CoV-2) delta variant of concern breakthrough infections:
and declare full responsibility for the findings presented. Are vaccines failing us? Infect Control Hosp Epidemiol. 2021;
doi:10.1017/ice.2021.363 [published online ahead of print].
11 Lopez Bernal J,Andrews N, Gower C et al. Effectiveness of Covid-
Funding: No funding source.
19 vaccines against the B.1.617.2 (delta) variant. New Engl J Med.
2021;385(7):585–94.
Competing interests: None declared.
12 del Rio C, Malani PN, Omer SB. Confronting the delta variant of SARS-
CoV-2, summer 2021. JAMA. 2021;11:1001–2.
Ethical approval: Not required. 13 Mahase E. Covid-19: How many variants are there, and what do we
know about them? BMJ. 2021;374:n1971.
Data availability: None. 14 Baraniuk C. Covid-19: How effective are vaccines against the delta
variant? BMJ. 2021;374:n1960.
15 Chia PY, Xiang Ong SW, Chiew CJ, et al. Virological and serological ki-
netics of SARS-CoV-2 delta variant vaccine-breakthrough infections:
References a multi-center cohort study. MedRXiV. 2021.
1 Our World in Data. Cumulative confirmed COVID-19 cases and 16 Sukumaran T. Why Malaysia’s contact-tracing efforts are falling dan-
deaths. Our World in Data. Available from: https://ourworldindata. gerously short. South China Morning Post. 2021.
org/covid-cases [accessed August 27, 2021]. 17 Lewis D. Why many countries failed at COVID contact-tracing—but
2 The New York Times. Covid World Vaccination Tracker. Avail- some got it right. Nature. 2020;588:384–7.
able from: https://www.nytimes.com/interactive/2021/world/covid- 18 Grimm V, Mengel F, Schmidt M. Extensions of the SEIR model for the
vaccinations-tracker.html [accessed August 27, 2021]. analysis of tailored social distancing and tracing approaches to cope
3 Kupferschmidt K, Wadman M. Delta variant triggers new phase in the with COVID-19. Sci Rep. 2021;11:4214.
pandemic. Science. 2021;372(6549):1375–6. 19 Gill BS, Jayaraj VJ, Singh S, et al. Modelling the effectiveness of epi-
4 Braithwaite I, Callender T, Bullock M, et al. Automated and partly au- demic control measures in preventing the transmission of COVID-19
tomated contact tracing: a systematic review to inform the control of in Malaysia. Int J Environ Res Public Health. 2020;17(15):5509.
COVID-19. Lancet Digital Health. 2020;2(11):e607–21. 20 Churches T, Flexible Jorm L., Freely available stochastic individ-
5 Jadidi M, Jamshidiha S, Masroori I, et al. A two-step vaccination tech- ual contact model for exploring COVID-19 intervention and control
nique to limit COVID-19 spread using mobile data. Sustain Cities Soc. strategies: development and simulation. JMIR Public Health Surveill.
2021;70:102886. 2020;6(3):e18965.
9D. Baha Raja et al.
21 Abdullah Noor H, Ministry of Health Malaysia D of. Kenyataan Akhbar 24 Ozili PK, Arun T. Spillover of COVID-19: Impact on the Global Econ-
KPK 26 Ogos 2021 – Situasi Semasa Jangkitan Penyakit Coronavirus omy. Report No.: ID 3562570. Rochester, NY: Social Science Research
2019 (COVID-19) di Malaysia [Internet]. From the Desk of the Director- Network; 2020.
General of Health Malaysia. 2021. Available from: https://kpkesihatan. 25 Atalan A. Is the lockdown important to prevent the COVID-19
com/2021/08/26/kenyataan-akhbar-kpk-26-ogos-2021-situasi- pandemic? Effects on psychology, environment and economy-
semasa-jangkitan-penyakit-coronavirus-2019-covid-19-di- perspective. Ann Med Surg. 2020;56:38–42.
malaysia/ [accessed August 27, 2021].
26 Zamri N, Mohideen FBS. The practicality of mobile applications
Downloaded from https://academic.oup.com/inthealth/advance-article/doi/10.1093/inthealth/ihac005/6545987 by guest on 04 July 2022
22 Zainuddin A. MOH estimates three undetected Covid-19 cases in healthcare administration and COVID-19 pandemic. Ulum Is-
for every reported infection. CodeBlue. 2021. Available from: lamiyyah. 2021;33:117–30.
https://codeblue.galencentre.org/2021/08/06/moh-estimates-
27 Government of Malaysia. MySejahtera. 2021. Available from:
three-undetected-covid-19-cases-for-every-reported-infection/
https://mysejahtera.malaysia.gov.my/intro/ [accessed August 27,
[accessed August 27, 2021].
2021].
23 World Health Organization. Considerations for implementing and
28 Woolliscroft T, Kelly S, Ramirez P, et al. Covid-19: better contact trac-
adjusting public health and social measures in the context of COVID-
ing could help save lives and the economy. The BMJ Opinion. 2020.
19. 2021. Available from: https://www.who.int/publications-detail-
redirect/considerations-in-adjusting-public-health-and-social- 29 Sanderson K. COVID vaccines protect against Delta, but their effec-
measures-in-the-context-of-covid-19-interim-guidance [accessed tiveness wanes. Nature. 2021. Available from: https://www.nature.
August 27, 2021]. com/articles/d41586-021-02261-8 [accessed August 27, 2021].
10You can also read