Corporate Vision FY2020-4Q - Management Plan 2. Business Results 3. Company Outline and Topics - Hitachi Construction Machinery
←
→
Page content transcription
If your browser does not render page correctly, please read the page content below
Corporate Vision
FY2020-4Q

1. Management Plan
2. Business Results
3. Company Outline and Topics

 Public Relations & Investor Relations Dept.
 Corporate Brand & Communications Div.

                                         © Hitachi Construction Machinery Co., Ltd. 2019. All rights reserved.   1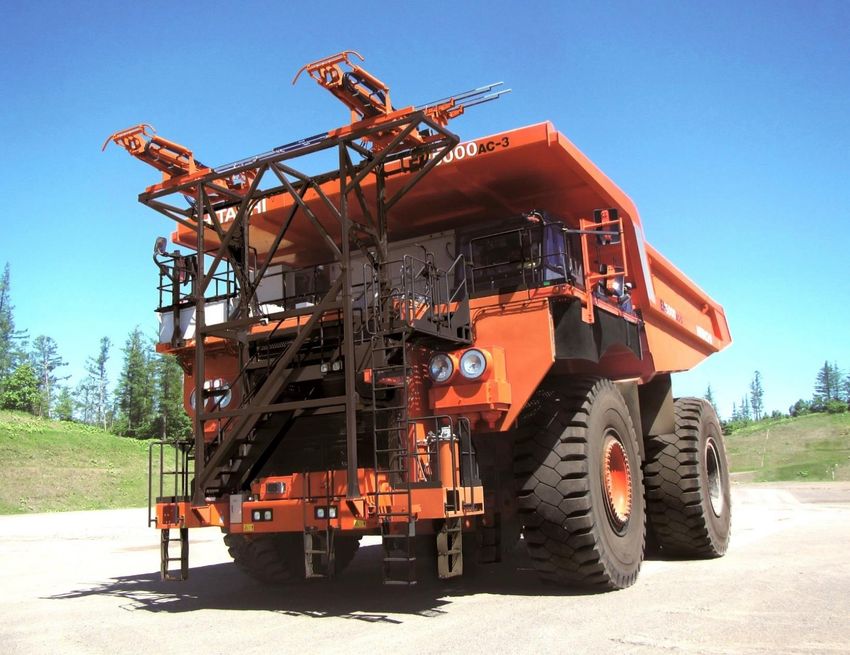
Management Plan

Medium-term Management Plan
“Realizing Tomorrow‘s Opportunities 2022”

(FY 2020-2022)

Kotaro Hirano
Executive Officer, President & CEO

                                     © Hitachi Construction Machinery Co., Ltd. 2021. All rights reserved.   2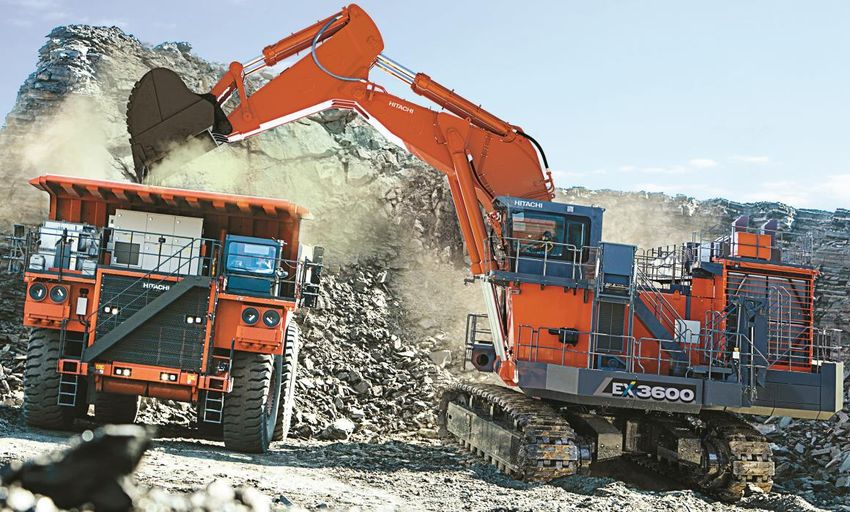
Our achievements over the past three years                     Management Plan
and our initiatives for these three years

                                             Realizing Tomorrow’s
  CONNECT TOGETHER 2019
                                              Opportunities 2022

   Deepen the value chain                Value chain + Enhance
                                            digital solutions
⚫ Parts and service (ConSite®)        ⚫Parts and service (ConSite® + parts
⚫ Acquisition of Bradken /H-E Parts    remanufacturing + Bradken/H-E Parts)
⚫ US & UK:start of rental business    ⚫Digital Mining
⚫ Certified used equipment            ⚫Rental +used equipment
                                               →Global

     Global Restructuring                    Efficiency in development,
                                             marketing and production
      Efficiency at overseas sites
                                                  Global cooperation

                                              © Hitachi Construction Machinery Co., Ltd. 2021. All rights reserved.   3
Management Plan
Impact of COVID-19 on the business

Performance deteriorated in FY2020 due to the impact of COVID-19
Full-fledged recovery in market conditions other than China is expected to occur from
the second half of FY2021 onward
Performance grows due to expansion of the value chain and deepening of solutions

        Demand Trend for Hydraulic Excavators                  Revenue and Adjusted Operating Income Ratio
(千台)
 [K units]                                                      [billions of yen]
250                                                             12,000                                                                        12.0%
              229                                                              Revenue difference
                             220                                               from the previous plan COVID-19
225
                                                                10,000                                                         0 10%          10.0%
200
               69             53                                                                                              10,000
175
                                                                 8,000
                                                                                                   8,800                                      8.0%
150                           25                                           8,133
               25                                                                                            7.0%
125                                                              6,000                                                                        6.0%
                              48
               45
100
                                                                                                                           50%
                              32                                 4,000                 4.0%                                                   4.0%
 75            31
                                                                               43%
 50
               33             36                                 2,000                                                                        2.0%
 25
               26             26
  0                                                                   0                                                                       0.0%
             20年度
              FY20        21年度見通
                          FY21 Forecast     22年度見通
                                            FY22 Forecast                        FY20            FY21 Forecast          FY22 Forecast
   FY                                                                           20年度              21年度見通                 22年度見通
         中国
          China           その他
                           Others            アジア・大洋州
                                              Asia & Oceania                                                               New
                                                                                      VC                                   新車 machine
         北米
          North America   西欧
                           Western Europe   日本
                                             Japan                                    Profit margin
                                                                                      利益率(コロナ前)                            Profit margin
                                                                                                                           利益率(コロナ後)
                                                                                       (Before COVID-19)                   (After COVID-19)
                                                                            © Hitachi Construction Machinery Co., Ltd. 2021. All rights reserved.     4
Management Plan
Strengthen development of digital and advanced technologies
Global restructuring of production sites is almost completed
Restructuring domestic production sites and development bases is on-going

                        Initial plan                     Reviewed plan
                                                         Invest 50 billion yen by 2027
                        Invest 42 billion yen by
Investment plan                                          Restructuring functions at Tsuchiura
                        2022
                                                         Works and Ryugasaki Works
Profit contribution
from production-        6 billion yen / year
related restructuring

Development of Collaborative Construction Equipment and accelerate the promotion of
technological development for reducing CO2 emissions R&D expense ratio raised to
4%; Development of bases in Japan, Europe and North America + Open innovation

                            Main research and development themes
                            •   Achieve “Collaborative safety" and advanced autonomous
Achieve collaborative
                                operation system platform "ZCORE"
control between people
                       •        Operation support system
and machinery          •        Site safety
Initiatives for reducing    •   New drive systems such as batteries, fuel cells, hydrogen, etc.
CO2 emissions               •   New technology development for "Net Zero Emissions"
                                                           © Hitachi Construction Machinery Co., Ltd. 2021. All rights reserved.   5
Management Plan
Corporate Strategy

                                                                                                                                                                               Core of Corporate
                                                                                                                                                                                   Strategy

                                                                                   Environmental                       Economic
                                            Social value
                                                                                        value                            value
                                                                                                                                                                              Strengthen value
                                                                                 Customers                                                                                     chain business
                                               Safety                                Productivity                     Reduction of
                                            improvement                             improvement                       lifecycle cost

                                                                                                                                                                             Provide enhanced
                                                       Means to resolve customer issues                                                                                      solutions at every
                  Focus on main products*

                                                                                 Digital/Value chain                                                                            contact with

                                                                                                                                                     Enhance solutions
                                                                                                                                                                                 customers
                                             New machinery

                                                             Parts and service

                                                                                     Rental

                                                                                              Used equipment

                                                                                                               remanufacturing
                                                                                                               Parts

                                                                                                                                 Finance
                                                                                                                                                                            Form highly flexible
                                                                                                                                                                            corporate structure

                                                                                   Expand value chain

 *Other product group: Backhoe loader, Crawler crane, Bulldozer, Skid-steer loader
                                                                                                                                           © Hitachi Construction Machinery Co., Ltd. 2021. All rights reserved.   6
Strengthen value chain business                             Social value         Management Plan
                                                            Reduction of
(Rental and Used equipment)                                 lifecycle cost

◼ Differentiation by high-quality rental machines and provide bushiness globally
◼ Expansion as guaranteed and refurbished used equipment

          Expand rental business in various places                     Used equipment with brands

                                             Proper
                                         maintenance by
                                         data utilization

      Distributing high-quality rental machines as used equipment around the world

                                       North
 Europe                      Japan                                 Expand the used equipment business
                                      America
                                                                              sales revenue
               Middle
                east                                              FY2022                                                    FY2030

                                                                  Used equipment                      Adoption of products
                        Southeast                Latin                                                and services that
            Africa                                                280%
                          Asia                  America
                                                                                                      meet regional needs
                                                                   Compared to FY2010

                                                                © Hitachi Construction Machinery Co., Ltd. 2021. All rights reserved.   7
Strengthen value chain business                           Social value         Management Plan
                                                          Reduction of
(Parts & Service)                                         lifecycle cost

◼ Expanding services with ConSite menu, increasing touch point with customers
◼ Increasing the choice of service parts for various parts brands
◼ Strengthening traceability and make parts distribution more efficient

      Expanding services with ConSite
                                                      Customers

                                             Increasing
                                                                                 Strengthening traceability
                                            touch point                        Efficiency in parts distribution

    Selectable from various parts brands

   Expand parts remanufacturing businesses
                 sales revenue                               Life cycle cost reductions
FY2022                                    FY2030   FY2022                                                                 FY2030
                           Adoption of products
Parts remanufacturing and services that meet
                                                   ConSite®                                        Aim for
420%                       regional needs          Adoption rate 90%                               “zero” downtime
        Compared to FY2010

                                                              © Hitachi Construction Machinery Co., Ltd. 2021. All rights reserved.   8
Advancement of construction machinery                           Social value        Management Plan
                                                                   Safety                Productivity
and improvement of safety                                       improvement             improvement

Aiming to realize “the optimal relationship between people and
machinery” by enhancing site safety as a whole through Collaborative
Construction Equipment, operation support systems, and various solutions

 Collaborative Construction Equipment
⚫ Developed "ZCORE", a system platform that realizes both
 Collaborative safety and advanced autonomous operation                                      Prototype
                                                                                              machine

        Operation support system
⚫ Surrounding recognition and automatic braking
⚫ Excavation status judgment and automatic loading
⚫ Operator status monitoring

                                                            Functionality to reduce accidents caused by
                  Site safety
                                                                           HCM products
⚫ Site safety management and risk analysis            FY2022                                                                 FY2030
⚫ Cooperation with disaster information, risk
                                                      Achieve collaborative                          Contribute to
  prediction
                                                      control between people                         "zero" overturn and
                                                      and machinery                                  fatal accidents

                                                                  © Hitachi Construction Machinery Co., Ltd. 2021. All rights reserved.   9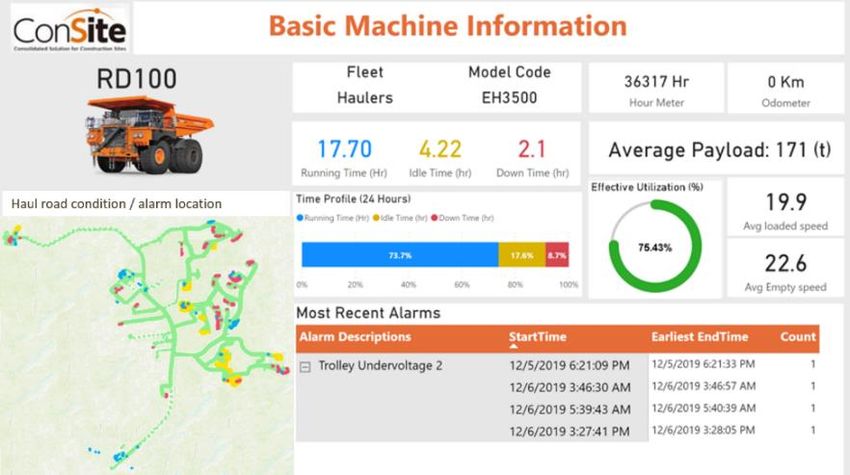
Environmental
Toward the realization                                      value
                                                                       Economic value      Management Plan
of a sustainable society                                                 Productivity
                                                                        improvement

Long-term initiatives for reducing CO2 emissions

                       Compact
   Battery powered
⚫ 8t class: Orders for 25 units in FY2020, the target for FY2021 is 50
  units
⚫ 5t class: Under evaluation test period, scheduled to be released in
                                                                             Launched in Europe               Under evaluation test
  Japan and Europe in FY2021                                                                                  in the market
                   Construction
   Fuel cell powered    Hydrogen engine             Collaboration with research institutes,
                                                    universities and partner companies

                        Mining
       ABB        All electrification   Improving the efficiency
  collaboration      in the mine          of the entire mine

                                                                         Reducing CO2 emissions from products

                                                                         FY2022                                                     FY2030

   Digital mine promoted by ABB
                                                                              ▲20%
                                                                               Compared to FY2010
                                                                                                                  ▲33%
⚫ Expanding sales of trolley type with ABB electric infrastructure
⚫ Applying ABB Digital Solution to Machines
                                                                         © Hitachi Construction Machinery Co., Ltd. 2021. All rights reserved.   10
Management Plan
Summary of KPI for these three years plan
Realizing Tomorrow’s Opportunities
Previous medium-term plan Current medium-term plan
KPI
FY2019 result FY2022 target
Growth ・Revenue ・931.3 billion yen ・1 trillion yen
・Value chain ratio ・40% ・50%
Profitability Adjusted operating 8.2% More than 10%
income ratio
Safety Net D/E Ratio 0.58 Less than 0.5
Efficiency ROE 8.6% More than 10%
ESG Social value ConSite adoption rate 73% ConSite adoption rate 90%
*Compared to Environmental value parts remanufacturing parts remanufacturing
FY2010
Economic value businesses sales revenue businesses sales revenue
296%* 420%*
Reducing CO2 emissions Reducing CO2 emissions
from products -15.9%* from products -20%*
Shareholder Dividend payout ratio 31% 30% or more
return
© Hitachi Construction Machinery Co., Ltd. 2021. All rights reserved. 11Management Plan © Hitachi Construction Machinery Co., Ltd. 2021. All rights reserved. 12
Business Results

Corporate Vision
FY2020-4Q

1. Management Plan
2. Business Results
3. Company Outline and Topics

                                © Hitachi Construction Machinery Co., Ltd. 2019. All rights reserved.   13
Business Results
Explanatory Meeting
for Business Results for the Year Ended March 31, 2021
1. Regional Market Environments and Projections
2. Business Results for FY2020 ended March 2021
Keiichiro Shiojima
Executive Officer, CFO
Hidehiko Matsui
Executive Officer, President, Marketing Div.
© Hitachi Construction Machinery Co., Ltd. 2019. All rights reserved. 14Business Results
1. Regional Market Environments and Projections
Hidehiko Matsui
Executive Officer, President, Marketing Div.
© Hitachi Construction Machinery Co., Ltd. 2021. All rights reserved. 15Business Results
Global Demand Trend for Hydraulic Excavators
Emerging Markets ratio :
Year-on-Year Change by Region
FY2020 : 61% ( y-y Change : +8% )
[K units] ※Emerging Markets: China, Asia/Oceania, and others ※Estimates by HCM, Excluding Chinese manufacturers
※Distributing, copying, or forwarding prohibited
250
236
229 '20 '21
220 220
225 216 Total +6% -4%
60 201 China +42% -23%
200
183 54 49 69 53 Russia,CIS,
173 中国
China -14% -4%
175
E Europe
30 68 Africa +2% -3%
155 24
30 24
24 25 その他
150
19 25
Others Middle East +11% -2%
32 19 Latin +14% -2%
125 24 53 18
43
49 48 アジア・大洋州
Asia & Oceania Others +1% -3%
45
100
32 41
34
*Incl. India Asia +6% +7%
32
33 35 北米
India +0% +8%
29 32 North America
75 27 31
26
25
27
Oceania +8% +6%
50
Asia & Oceania +4% +7%
31 38 42 40 36 西欧
Western Europe
30 35 30
33 N America -12% +4%
25 W Europe -17% +9%
31
24 23 25 24 25 24 26 26 日本
Japan
Japan +3% +0%
0
FY '14 '15 '16 '17 '18 '19 '20 '20 '21
Previous Current
Outlook Estimate © Hitachi Construction Machinery Co., Ltd. 2021. All rights reserved. 16Business Results
Japan: Fourth Quarter ( from January to March 2021 )
■Housing investment and capital investment continued decreasing y-y. Public investment stayed flat.
■Demand for Hydraulic excavators and Mini excavators slightly increased: Hydraulic excavators -5% (YTD
+3%), Mini excavators +3%, Wheel loaders +3% y-y, respectively.
Market Environment Housing/Public Spending and Capex (y-y) [K units] Demand Trend for Mini Excavators
40% 20 100%
Public spending *Source: MLIT, Cabinet Office, and *Estimates by HCM
(Public work orders) Construction Surety Company
20% 15 50%
0% 10 0%
-20% Capex 5 -50%
(Orders for machinery, New housing starts
excluding foreign demands) (number of houses)
-40% 0 -100%
3Q
2Q
2Q
3Q
4Q
2Q
4Q
2Q
3Q
4Q
2Q
3Q
4Q
3Q
4Q
2Q
3Q
4Q
2Q
3Q
4Q
FY14/1Q
FY15/1Q
FY16/1Q
FY17/1Q
FY18/1Q
FY19/1Q
FY20/1Q
2Q
2Q
3Q
4Q
2Q
3Q
4Q
2Q
3Q
4Q
3Q
4Q
2Q
3Q
4Q
FY14/1Q
FY15/1Q
FY16/1Q
FY17/1Q
FY18/1Q
FY19/1Q
FY20/1Q
2Q
3Q
4Q
2Q
3Q
4Q
[K units] Demand Trend for Hydraulic Excavators [K units] Demand Trend for Wheel Loaders
20 100% 20 100%
*Estimates by HCM *Estimates by HCM
15 50% 15 50%
10 0% 10 0%
5 -50% 5 -50%
0 -100% 0 -100%
4Q
2Q
3Q
4Q
2Q
3Q
2Q
3Q
4Q
2Q
3Q
4Q
2Q
3Q
4Q
2Q
3Q
4Q
2Q
3Q
4Q
FY14/1Q
FY15/1Q
FY16/1Q
FY17/1Q
FY18/1Q
FY19/1Q
FY20/1Q
3Q
4Q
2Q
4Q
2Q
3Q
4Q
2Q
3Q
4Q
2Q
3Q
2Q
3Q
4Q
2Q
3Q
4Q
2Q
3Q
4Q
FY14/1Q
FY15/1Q
FY16/1Q
FY17/1Q
FY18/1Q
FY19/1Q
FY20/1Q
© Hitachi Construction Machinery Co., Ltd. 2021. All rights reserved. 17Business Results
Europe: Fourth Quarter ( from January to March 2021 )
■Throughout the Eurozone, GDP growth rate stayed flat from the previous quarter, still negative growth y-y.
■Demand : Hydraulic excavators +23% (YTD -17%), Mini excavators -2%, Wheel loaders -9% y-y, respectively.
GDP Growth Rate in Major Countries (y-y) [K units] Demand Trend for Mini Excavators
10% 25 100%
*Estimates by HCM
UK Others
5%
20
50%
0% Germany
Germany 15
-5% Italy
0%
-10% 10
France France
-15% -50%
5 UK
-20% EUR zone
* Source: Eurostat
-25% 0 -100%
2Q
3Q
4Q
2Q
3Q
4Q
2Q
3Q
4Q
2Q
3Q
4Q
2Q
3Q
4Q
2Q
3Q
4Q
2Q
3Q
4Q
FY14/1Q
FY15/1Q
FY16/1Q
FY17/1Q
FY18/1Q
FY19/1Q
FY20/1Q
4Q
3Q
2Q
3Q
2Q
3Q
4Q
2Q
3Q
4Q
2Q
4Q
2Q
3Q
4Q
2Q
3Q
4Q
2Q
3Q
4Q
CY14/1Q
CY15/1Q
CY16/1Q
CY17/1Q
CY18/1Q
CY19/1Q
CY20/1Q
(E)
[K units] Demand Trend for Hydraulic Excavators [K units] Demand Trend for Wheel Loaders
20 100% 20 100%
*Estimates by HCM *Estimates by HCM
Others Others
15 50% 15 50%
Germany Germany
10 0% Italy 10 0% Italy
France France
5 -50% 5 -50%
UK UK
0 -100% 0 -100%
2Q
3Q
4Q
2Q
3Q
4Q
2Q
3Q
4Q
2Q
3Q
4Q
2Q
3Q
4Q
2Q
3Q
4Q
2Q
3Q
4Q
FY14/1Q
FY15/1Q
FY16/1Q
FY17/1Q
FY18/1Q
FY19/1Q
FY20/1Q
2Q
3Q
4Q
2Q
3Q
4Q
2Q
3Q
4Q
2Q
3Q
4Q
2Q
3Q
4Q
2Q
3Q
4Q
2Q
3Q
4Q
FY14/1Q
FY15/1Q
FY16/1Q
FY17/1Q
FY18/1Q
FY19/1Q
FY20/1Q
(E) (E)
© Hitachi Construction Machinery Co., Ltd. 2021. All rights reserved. 18Business Results
North America: Fourth Quarter ( from January to March 2021 )
◼ Housing starts increased. Construction investment increased in Residential, stayed flat in public work.
◼ Demand increased: Hydraulic excavators +14% (YTD -12%), Mini excavators +26% y-y, respectively.
[K units] GDP Growth Rate, Housing Starts in US [K units] Demand Trend for Hydraulic Excavators
2000 35% 20 100%
* Bureau of Economic Census, US Census Bureau *Estimates by HCM
25%
GDP (y-y/Right axis)
15% 15 50%
1500
5%
10 0%
-5%
1000
Housing starts (Left axis) -15% 5 -50%
(Seasonally adjusted) -25%
500 -35% 0 -100%
3Q
3Q
2Q
3Q
4Q
2Q
3Q
4Q
2Q
3Q
4Q
2Q
4Q
2Q
3Q
4Q
2Q
4Q
2Q
3Q
4Q
CY14/1Q
CY15/1Q
CY16/1Q
CY17/1Q
CY18/1Q
CY19/1Q
CY20/1Q
CY21/1Q
4Q
3Q
2Q
3Q
4Q
2Q
3Q
2Q
3Q
4Q
2Q
3Q
4Q
2Q
3Q
4Q
2Q
3Q
4Q
2Q
4Q
2Q
3Q
4Q
FY20/1Q
FY13/1Q
FY14/1Q
FY15/1Q
FY16/1Q
FY17/1Q
FY18/1Q
FY19/1Q
(E)
Construction Spending in US (y-y) [K units] Demand Trend for Mini Excavators
150% 20 100%
*Estimates by HCM
Residential Non-residential Public
15 50%
125%
10 0%
100%
5 -50%
* Bureau of Economic Census, US Census Bureau
75%
0 -100%
4Q
2Q
4Q
2Q
3Q
2Q
3Q
4Q
2Q
3Q
4Q
3Q
4Q
2Q
3Q
4Q
2Q
3Q
2Q
3Q
4Q
CY14/1Q
CY15/1Q
CY16/1Q
CY17/1Q
CY18/1Q
CY19/1Q
CY20/1Q
CY21/1Q
3Q
4Q
2Q
3Q
4Q
2Q
3Q
4Q
2Q
3Q
4Q
2Q
2Q
3Q
4Q
2Q
3Q
4Q
2Q
3Q
4Q
FY14/1Q
FY15/1Q
FY16/1Q
FY17/1Q
FY18/1Q
FY19/1Q
FY20/1Q
(E)
© Hitachi Construction Machinery Co., Ltd. 2021. All rights reserved. 19Business Results
China: Fourth Quarter ( from January to March 2021 )
■The GDP growth rate was +18.3%.
■Demand for hydraulic excavators in China kept increased. +53% y-y (YTD +42%), Foreign manufactures only.
GDP and Fixed Asset Investment [%] Quarterly Demand for Hydraulic Excavators by Region (y-y)
(y-y) *Estimates by HCM
30% 20
FY20 1Q 2Q 3Q 4Q *Foreign manufactures only
left axis right axis
Accumulated Fixed Asset GDP (+18.3%) 15 North East +150 +112 +27 +98 [%]
20%
Investment (y-y) (+25.6%) 10 North +37 +40 +23 +76
5 East +59 +57 +36 +42
10%
0 Central
+42 +22 +22 +70
South
0% -5
North West +29 +64 +27 +68
4Q
2Q
2Q
3Q
4Q
2Q
3Q
2Q
3Q
4Q
2Q
3Q
4Q
3Q
4Q
2Q
3Q
4Q
2Q
CY17/1Q
CY14/1Q
CY15/1Q
CY16/1Q
CY18/1Q
CY19/1Q
CY20/1Q
CY21/1Q
3Q
4Q
-10 South West +28 +21 +26 +25
-10%
-15 Total +45 +40 +28 +53
* National Bureau of Statistics of China
-20% -20
Demand Trend for Hydraulic Excavators Demand Composition by Class for Mini Excavators and Hydraulic Excavators
*Estimates by HCM *Estimates by HCM *Foreign manufactures only
[K units] y-y comparison data is limited to foreign manufactures only 40t-
100%
80 150% 30-39t
70 Domestic 80% 20t
100% and 21-29t
60 Foreign
over
60% 20t
50 50%
40 10-15t
40%
30 0%
20t 6-10t
20 20%
-50% below
10 -6t
0 -100% 0%
2Q
3Q
4Q
2Q
3Q
4Q
2Q
3Q
4Q
2Q
3Q
4Q
2Q
3Q
4Q
FY20/1Q
FY16/1Q
FY17/1Q
FY18/1Q
FY19/1Q
3Q
4Q
2Q
3Q
4Q
2Q
3Q
4Q
2Q
3Q
4Q
2Q
2Q
3Q
4Q
2Q
3Q
4Q
2Q
3Q
4Q
FY18/1Q
FY14/1Q
FY15/1Q
FY16/1Q
FY17/1Q
FY19/1Q
FY20/1Q
© Hitachi Construction Machinery Co., Ltd. 2021. All rights reserved. 20Business Results
Supplemental Information: China ( from January to March 2021 )
[K units] *Estimates by HCM
15 Monthly Demand Trend for Hydraulic Excavators (Foreign Manufactures only) 250%
200%
y-y
150%
10
100%
50%
5 0%
-50%
-100%
0 +102% +100% +45% +55% +11% -9% -2% -19% -10% -8% -31% +45% +40% +28% +53%
-150%
Apr. 5月
4月 May.6月
Jun. 7月
Jul. Aug.
8月 9月Sep. Oct.
10 Nov.
11 Dec.
12 1月Jan. 2月
Feb. 3月
Mar.Apr.
4月 May. Jun. 7月
5月 6月 Jul. Aug.
8月 9月Sep. Oct.
10 Nov.
11 Dec.
12 1月Jan. 2月
Feb. 3月
Mar. 4月
Apr. 5月
May.6月
Jun. 7月
Jul. Aug.
8月 9月Sep. Oct.
10 Nov.
11 Dec.
12 1月Jan. 2月
Feb. 3月 Apr. 5月
Mar.4月 May.6月
Jun.7月
Jul. 8月
Aug. 9月
Sep. Oct.
10 Nov. Dec.1月
11 12 Jan. 2月
Feb.3月
Mar.
月 月 月 月 月 月 月 月 月 月 月 月
FY2017 FY2018 FY2019 FY2020
[K units] Demand Trend for Hydraulic Excavators (y-y) (Foreign Manufactures only)
16 *Estimates by HCM
14 FY2018 Actual
2018年度 [Chinese New Year]
12 FY2019 Actual
2019年度 Feb. 5, 2019
Jan. 25, 2020
10 FY2020 Actual
2020年度 YoY+205%
Feb. 12, 2021
8
Feb. 1, 2022
6
4
2
0
Apr. May. Jun. Jul. Aug. Sep. Oct. Nov. Dec. Jan. Feb. Mar.
4月 5月 6月 7月 8月 9月 10月 11月 12月 1月
© Hitachi Construction 2月 Co.,
Machinery 3月
Ltd. 2021. All rights reserved. 21Business Results
Asia Oceania, and India: Fourth Quarter ( from January to March 2021 )
■Demand for hydraulic excavators increased overall in the Asia Pacific region, +24% y-y (YTD +3%)
■Demand for hydraulic excavators in India was +55% y-y (YTD +0%)
Demand Trend for Hydraulic Excavators in Asia & Oceania [%] GDP Growth Rate in Major Countries (y-y)
[K units] * Source: IMF, etc
15 Indonesia India
10 50%
*Estimates by HCM 10
5
0
-5 Thailand
8 0% Singapore
-10
-15
-20 Malaysia
-25
6 -50%
CY14/1Q
CY15/1Q
CY16/1Q
CY17/1Q
CY18/1Q
CY19/1Q
CY20/1Q
2Q
3Q
4Q
2Q
3Q
4Q
2Q
3Q
4Q
2Q
3Q
4Q
2Q
3Q
4Q
2Q
3Q
4Q
2Q
3Q
4Q
Others ※ Calculation criteria for GDP growth rate in India was revised in CY2013 2Q
NZ Demand Trend for Hydraulic Excavators in India
4 -100%
Australia [K units] *Estimates by HCM
8 100%
Thailand 7
Singapore 6 50%
2 -150% 5
Malaysia 4 0%
3
Indonesia
2 -50%
1
0 -200%
0 -100%
2Q
3Q
2Q
3Q
4Q
2Q
3Q
4Q
3Q
4Q
2Q
3Q
4Q
2Q
3Q
4Q
2Q
4Q
2Q
3Q
4Q
FY14/1Q
FY15/1Q
FY16/1Q
FY17/1Q
FY18/1Q
FY19/1Q
FY20/1Q
2Q
2Q
2Q
3Q
4Q
2Q
3Q
4Q
3Q
4Q
2Q
3Q
4Q
2Q
3Q
4Q
2Q
3Q
4Q
3Q
4Q
FY14/1Q
FY15/1Q
FY16/1Q
FY17/1Q
FY18/1Q
FY19/1Q
FY20/1Q
(E)
(E)
© Hitachi Construction Machinery Co., Ltd. 2021. All rights reserved. 22Business Results
Russia and Middle East: Fourth Quarter ( from January to March 2021 )
■Demand for hydraulic excavators in Russia was +17% y-y (YTD -11%)
■Demand for hydraulic excavators in the Middle East was +17% y-y (YTD +11%)
Foreign Exchange Rate of the Ruble [K units] Demand Trend for Hydraulic Excavators in Russia
5 200%
*Estimates by HCM
4 *Ex-Works base 150%
0.03
* Incl. Local manufacturing
100%
Against US$ 3
0.02 50%
2
0%
0.01 1 -50%
Against EUR€
0 -100%
3Q
4Q
2Q
3Q
4Q
2Q
4Q
2Q
3Q
4Q
2Q
3Q
4Q
2Q
3Q
2Q
3Q
4Q
2Q
3Q
4Q
FY14/1Q
FY15/1Q
FY16/1Q
FY17/1Q
FY18/1Q
FY19/1Q
FY20/1Q
0
FY13 FY14 FY15 FY16 FY17 FY18 FY19 FY20 (E)
* According to HCM’s research
[Crude oil [Natural Gas
Price Trend of Crude Oil and Natural Gas Index] [K units]
Demand Trend for Hydraulic Excavators in the Middle East
US$]
140 140 5 100%
Natural gas *Estimates by HCM
120 120
(right scale) 4
*Ex-Works base
(Turkey: retail-sales base) 50%
100 100 Others
80 80 3
0% UAE
60 60 2 Saudi
Arabia
40 40 -50%
1
20
Crude oil 20
Turkey
(left scale)
0 0 0 -100%
2Q
3Q
2Q
3Q
4Q
2Q
3Q
4Q
2Q
3Q
4Q
2Q
4Q
3Q
4Q
2Q
3Q
4Q
2Q
4Q
FY16/1Q
FY14/1Q
FY15/1Q
FY17/1Q
FY18/1Q
FY19/1Q
FY20/1Q
3Q
FY13 FY14 FY15 FY16 FY17 FY18 FY19 FY20
(E)
* Created by HCM, sourced from World Bank * Natural Gas Index (2010 = 100)
© Hitachi Construction Machinery Co., Ltd. 2021. All rights reserved. 23Business Results
Mining machinery: FY2020 ( from April 2020 to March 2021 )
◼ Demand forecast for mining machinery in FY2020 decreased at -25% y-y.
◼ Demand forecast for mining machinery in FY2021 is expected to increase+5% y-y.
Ultra-large Hydraulic Excavators (over 100t), Dump Trucks(over 150t)
[Units] Demand by product [Units] Demand by region
2,000 2,000
Dump Trucks(over 150t)
Central and South America
Ultra-large Hydraulic Excavators(over 100t)
North America
Europe Russia CIS
1,500 1,500
Oceania
Asia
1,000 Africa and Middle East
1,000
500 500
- 0
FY14 FY15 FY16 FY17 FY18 FY19 FY20 FY21 FY14 FY15 FY16 FY17 FY18 FY19 FY20 FY21
※ According to HCM’s research
© Hitachi Construction Machinery Co., Ltd. 2021. All rights reserved. 24Business Results
Supplementary Information: BB Ratio
BB Ratio (Ultra-large Hydraulic Excavators, over 100t)
BB Ratio (Dump trucks, over 150t)
* Book-to-Bill(BB) Ratio = Bookings (Orders received)/Billings (Value of shipment )
Non-consolidated basis (average of 6 months)
© Hitachi Construction Machinery Co., Ltd. 2021. All rights reserved. 25Business Results
2. Business Results for FY2020 ended March 2021
(April 1, 2020 - March 31, 2021)
Keiichiro Shiojima
Executive Officer, CFO
© Hitachi Construction Machinery Co., Ltd. 2021. All rights reserved. 26Business Results
Summary of consolidated results
Revenue decreased by 13% and adjusted operating income decreased by 57% y-y due to
the impact of COVID-19 and the appreciation of the yen, 9.2 billion yen.
[billions of yen]
FY2020 FY2019
change
Actual Actual
<770.0>
Revenue 813.3 931.3 -13%
<40.0>
Adjusted operating income *1 (4.0%) 32.7 (8.2%) 76.6 -57%
<36.0>
Operating income (3.5%) 28.2 (7.8%) 72.8 -61%
<34.0>
Income before income taxes (3.1%) 25.6 (7.2%) 67.1 -62%
Net income attributable to <20.0>
owners of the parent (1.3%) 10.3 (4.4%) 41.2 -75%
EBIT *2
<37.6> (3.5%) 28.7 (7.7%) 71.6 -60%
Rate (YEN/US$) <105.7> 106.0 108.7 -2.7
Rate (YEN/EURO) <121.8> 124.6 120.8 3.8
FX rate
Rate (YEN/RMB) <15.3> 15.7 15.7 0.0
Rate (YEN/AU$) <73.6> 76.0 74.1 1.9
Cash dividend per share (yen) *3 20 60 -40
*1 "Adjusted operating income" is calculated by excluding "Other income" and "Other expenses" from "Operating Income" listed in Consolidated Statements of Income.
*2 "EBIT" stands for Earnings Before Interests and Taxes, and is calculated by excluding "Interest income" and "Interest expenses" from “Income before income taxes”
*3 “Cash dividend per share”: The Company will pay dividends linked to its consolidated business results twice, interim and year end, in the fiscal year and aim to
achieve a consolidated dividend payout ratio of approx. 30% or more.
© Hitachi Construction Machinery Co., Ltd. 2021. All rights reserved. 27Business Results
Revenue by geographic region (consolidated)
Revenue decreased in each region except China and the Middle East y-y,
consolidated revenue decreased by 118.0 billion yen.
[billions of yen]
FY2020 FY2019 change
Actual Actual amount %
Japan 203.3 25% 205.6 22% -2.3 -1%
Asia 52.7 6% 85.9 9% -33.2 -39%
India 50.0 6% 50.7 5% -0.7 -1%
Oceania 139.9 17% 146.0 16% -6.0 -4%
Europe 87.8 11% 103.6 11% -15.7 -15%
N.America 107.2 13% 173.4 19% -66.2 -38%
L.America 10.9 1% 12.9 1% -2.0 -16%
Russia-CIS 22.7 3% 32.6 4% -9.9 -30%
M.East 16.1 2% 7.6 1% 8.5 113%
Africa 33.6 4% 38.0 4% -4.4 -12%
China 89.1 11% 75.0 8% 14.0 19%
Total 813.3 100% 931.3 100% -118.0 -13%
Overseas ratio 75% 78%
© Hitachi Construction Machinery Co., Ltd. 2021. All rights reserved. 28Business Results
Mining revenue
Revenue of mining in FY2020 decreased by 26% to 123.5 billion yen y-y, partly due to the
impact of the appreciation of the yen, 5.0 billion yen.
% shows sales ratio against total company sales
[ % ] shows changed ratio from the same period of
[billions of yen] previous year
18%
16%
14%
16% 15% 15%
15% 16%
[ △26%]
Machine
[ △5%]
Total
[ △38%]
[ △49%]
[ △17%]
© Hitachi Construction Machinery Co., Ltd. 2021. All rights reserved. 29Business Results
Value chain*1 revenue
Revenue of the value chain business in FY2020 decreased by 7% to 351.8 billion yen
y-y, partly due to the impact of the appreciation of the yen, 3.7 billion yen despite an increase
in revenue of rental by 12% y-y.
% shows sales ratio against total company sales
[billions of yen]
[ % ] shows changed ratio from the same period of
previous year
39%
40% 41%
43%
[ △7%]
35% [ △4%]
[ 12%]
[ △13%]
[ △4%]
[ △11%]
[ △17%]
(*1) Value chain: Total of Parts & services, Solution business, Rental etc. other than new machine sales.
(*2) Solution business: The business segment primarily intends to provide development, production, distribution of parts and service solutions for
mining facilities and equipment after the sales made that are not included in the construction machinery business segment.
© Hitachi Construction Machinery Co., Ltd. 2021. All rights reserved. 30Business Results
Comparison of consolidated income
Adjusted operating income decreased by 43.9 billion yen y-y due to the impact of the
decreased sales volume and model mix including the impact of COVID-19, despite the
decreased overheads and material costs and improved selling price.
[billions of yen]
Sales Volume -40.5
Model mix of value chain business -6.8
100 Other model mix -14.4
90
76.6 -62.7 Decrease of expense linked to
80 production and sales 14.8 72.8 -43.9
Decrease of general overheads 6.0 US$ -3.1 -1.4
Sales volume, model mix & others
Increase of expense for sustained EUR 1.0
variance of adjusted operating income
70
growth -4.2 RMB -0.3
Expenses related structural reform
AU$ 0.5 0.7
Adjusted operating income
60
expenses
Other operating income and
50 -3.1 32.7
Operating income
0.8 4.5 16.6 28.2
Foreign exchange rate
40
income
Adjusted operating
Operating income
Material cost
Overhead
Selling price
30
20
10
0
FY2019 FY2020 FY2019 FY2020
Actual Actual Actual Actual
Total variance excluding FX effect –40.8
© Hitachi Construction Machinery Co., Ltd. 2021. All rights reserved. 31Business Results
Consolidated statement of income
◼ SGA expenses decreased by -13.5 billion yen to 160.6 billion yen y-y.
◼ Financial income/expenses improved by 4.3 billion yen to -4.1 billion yen y-y.
[billions of yen]
FY2020 FY2019 change
Actual Actual amount %
Revenue 813.3 931.3 -118.0 -13%
Cost of Sales (76.2%) 620.0 (73.1%) 680.6 -60.6 -9%
SGA expenses (19.8%) 160.6 (18.7%) 174.1 -13.5 -8%
Adjusted operating income *1 (4.0%) 32.7 (8.2%) 76.6 -43.9 -57%
Other Income/expenses -4.5 -3.8 -0.7 19%
Operating income (3.5%) 28.2 (7.8%) 72.8 -44.6 -61%
Financial income/expenses -4.1 -8.4 4.3 -52%
Share of profits of investments
accounted for using the equity method 1.4 2.7 -1.3 -47%
Income before income taxes (3.1%) 25.6 (7.2%) 67.1 -41.5 -62%
Income taxes 11.0 22.3 -11.4 -51%
Net income (1.8%) 14.6 (4.8%) 44.8 -30.1 -67%
Net income attributable to
owners of the parent (1.3%) 10.3 (4.4%) 41.2 -30.8 -75%
*1 “Adjusted operating income” is calculated by excluding “Other income” and
“Other expenses” from “Operating Income” listed in Consolidated Statements of Income.
© Hitachi Construction Machinery Co., Ltd. 2021. All rights reserved. 32Summary of quarterly consolidated revenue and Business Results
operating income (ratio)
[billions of yen]
2017 2018 2019 2020
1Q 2Q 3Q 4Q 1Q 2Q 3Q 4Q 1Q 2Q 3Q 4Q 1Q 2Q 3Q 4Q
Revenue 211.5 228.8 243.6 275.3 240.2 250.2 252.8 290.5 234.7 245.9 206.6 244.2 170.2 190.7 197.8 254.6
Adjusted operating income 13.2 21.0 31.5 27.5 27.6 25.8 31.8 31.7 22.9 22.1 13.8 17.9 2.9 8.0 7.4 14.4
Operating income 13.4 22.5 32.4 27.1 25.7 24.8 30.8 21.0 23.7 19.6 14.1 15.5 2.5 6.0 6.7 13.0
[billions of yen] Revenue
450.0 13.3% 12.6% Adjusted operating income Ratio
15.0%
11.5% 10.9% Operating income Ratio
400.0 9.8% 10.0% 10.3%
10.1% 9.0%
12.9% 12.2% 10.0%
6.3% 10.7% 9.9% 6.8% 7.3%
350.0 9.2% 9.9% 9.8% 5.7%
7.2% 8.0% 4.2% 3.7%
300.0 6.2% 6.7% 6.3% 5.0%
1.7%
5.1%
250.0 3.2% 3.4%
1.5% 0.0%
200.0
150.0 -5.0%
100.0
-10.0%
50.0
211.5 228.8 243.6 275.3 240.2 250.2 252.8 290.5 234.7 245.9 206.6 244.2 170.2 190.7 197.8 254.6
0.0 -15.0%
1Q 2Q 3Q 4Q 1Q 2Q 3Q 4Q 1Q 2Q 3Q 4Q 1Q 2Q 3Q 4Q
2017 2018 2019 2020
2017 2018 2019 2020
FX rate
1Q 2Q 3Q 4Q 1Q 2Q 3Q 4Q 1Q 2Q 3Q 4Q 1Q 2Q 3Q 4Q
Rate (YEN/US$) 111.1 111.0 113.0 108.3 109.1 111.5 112.9 110.2 109.9 107.4 108.8 108.9 107.6 106.2 104.5 105.9
Rate (YEN/EURO) 122.2 130.4 133.0 133.2 130.1 129.6 128.8 125.2 123.5 119.3 120.3 120.1 118.5 124.1 124.5 127.7
Rate (YEN/RMB) 16.2 16.6 17.1 17.1 17.1 16.4 16.3 16.3 16.1 15.3 15.5 15.6 15.2 15.4 15.8 16.4
Rate (YEN/AU$) 83.4 87.6 86.8 85.3 82.6 81.5 81.1 78.5 76.9 73.6 74.3 71.8 70.7 75.9 76.3 81.8
© Hitachi Construction Machinery Co., Ltd. 2021. All rights reserved. 33Business Results
Consolidated statement of financial position
Trade receivables and inventories at the end of the year were reduced by 1.3 billion yen and
3.5 billion yen from the end of the previous fiscal year.
[billions of yen]
(A) (B) (A)-(B) (D) (E) (D)-(E)
Mar '2021 Mar '2020 change Mar '2021 Mar '2020 change
Cash and cash equivalents 80.3 62.2 18.2 Trade and other payables 199.2 188.7 10.5
Trade receivables 211.2 212.5 -1.3 Bonds and borrowings 329.5 338.9 -9.5
Inventories 297.8 301.2 -3.5 Total liabilities 651.3 642.5 8.9
(Equity attributable to owners of
Total current assets 617.2 612.8 4.4 the parent ratio) (42.1%) (40.6%) (1.6%)
Total non-current assets 603.4 554.8 48.6 Total equity 569.2 525.1 44.1
Total assets 1,220.6 1,167.6 53.0 Total liabilities and equity 1,220.6 1,167.6 53.0
Trade receivables incl.
non-current 252.7 252.1 0.5
Inventories by products
Unit 77.3 76.2 1.0 (27.0%) (29.0%) (-2.0%)
Parts 102.3 103.0 -0.7 Interest-bearing debt 329.5 338.9 -9.5
Raw materials, WIP and etc 118.2 122.0 -3.8 Cash and Cash equivalents 80.3 62.2 18.2
Total inventories 297.8 301.2 -3.5 (20.4%) (23.7%) (-3.3%)
On hand days(divided by net sales) (Days) Net interest-bearing debt 249.2 276.8 -27.6
Trade receivables 113 99 14
Inventories 134 118 16 Net D/E Ratio 0.48 0.58 -0.10
Trade payables 49 43 6
Net working capital 194 171 23
© Hitachi Construction Machinery Co., Ltd. 2021. All rights reserved. 34Business Results
Consolidated cash flow
■Net cash provided by (used in) operating activities improved by 68.7 billion yen to
91.3 billion yen y-y due to improved working capital.
■Free cash flows improved by 71.1 billion yen to positive 59.1 billion yen y-y.
[billions of yen]
FY2020 FY2019
change
Actual Actual
Net income 14.6 44.8 -30.1
Depreciation and amortization 64.8 50.2 90.9 46.1 -26.1 4.0
(Increase)decrease in trade/lease receivables 23.3 9.9 13.4
(Increase)decrease in inventories 29.6 25.5 -22.8 0.1 52.4 25.4
Increase(decrease) in trade payables -19.2 -32.8 13.5
Others, net -3.0 -45.4 42.4
Net cash provided by (used in) operating activities 91.3 22.7 68.7
Cash flow margin for operating activities 11.2% 2.4% 8.8%
Net cash provided by (used in) investing activities -32.3 -34.7 2.5
Free cash flows 59.1 -12.1 71.1
Net cash provided by (used in) financing activities -46.0 11.0 -57.0
© Hitachi Construction Machinery Co., Ltd. 2021. All rights reserved. 35Business Results
Summary of consolidated earnings forecast
Consolidated revenue for FY2021 is expected to increase by 66.7 billion yen y-y,
despite the impact of the yen's appreciation on the forecast exchange rate of -18.7 billion yen.
[billions of yen]
FY2021 FY2020 change
Forecast Actual amount %
Revenue 880.0 813.3 66.7 8%
Adjusted operating income (7.0%) 62.0 (4.0%) 32.7 29.3 90%
Operating income (6.6%) 58.0 (3.5%) 28.2 29.8 105%
Income before
income taxes (6.4%) 56.0 (3.1%) 25.6 30.4 119%
Net income attributable to
owners of the parent (3.7%) 32.3 (1.3%) 10.3 22.0 212%
EBIT 58.8 28.7 30.0
FY2021 FY2020
Currency change
Forecast Actual
Rate (YEN/US$) 105.0 106.0 -1.0 For FX
Rate (YEN/EURO) 125.0 124.6 0.4 sensitivity,
Rate (YEN/RMB) 15.5 15.7 -0.2 please refer
Rate (YEN/AU$) 73.0 76.0 -3.0 to appendix 1.
Cash dividend per share (yen) *1 to be determined 20 -
*1 “Cash dividend per share”: The Company will pay dividends linked to its consolidated business results twice, interim
and year end, in the fiscal year and aim to achieve a consolidated dividend payout ratio of approx. 30% or more.
© Hitachi Construction Machinery Co., Ltd. 2021. All rights reserved. 36Business Results
Consolidated revenue forecast by geographic region
Consolidated revenue for FY2021 is expected to increase by 66.7 billion yen y-y,
despite the impact of the yen's appreciation on the forecast exchange rate of -18.7 billion yen.
(billions of yen)
FY2021 FY2020 change
Forecast Actual
amount %
Japan 210.7 24% 203.3 25% 7.4 4%
Asia 64.0 7% 52.7 6% 11.3 21%
India 55.6 6% 50.0 6% 5.6 11%
Oceania 143.7 16% 139.9 17% 3.8 3%
Europe 97.8 11% 87.8 11% 9.9 11%
N.America 146.5 17% 107.2 13% 39.3 37%
L.America 11.3 1% 10.9 1% 0.4 4%
Russia-CIS 31.9 4% 22.7 3% 9.2 41%
M.East 17.2 2% 16.1 2% 1.2 7%
Africa 33.3 4% 33.6 4% -0.3 -1%
China 67.9 8% 89.1 11% -21.2 -24%
Total 880.0 100% 813.3 100% 66.7 8%
Overseas ratio 76% 75%
© Hitachi Construction Machinery Co., Ltd. 2021. All rights reserved. 37Business Results
Mining revenue forecast
Revenue of mining in FY2021 is expected to increase by 12% to 138.0 billion yen y-y,
despite the impact of the appreciation of the yen, 6.1 billion yen.
% shows sales ratio against total company sales
[ % ] shows changed ratio from the same period of
previous year
[billions of yen]
16% 18%
14% 16%
16% 15% 15%
15% 16% [ 12%]
Machine
[ 6%] Total
[ 23%]
[ 34%]
[ 6%]
© Hitachi Construction Machinery Co., Ltd. 2021. All rights reserved. 38Business Results
Value chain*1 revenue forecast
Revenue of value chain in FY2021 is expected to increase by 9% to 382.5 billion yen y-y,
despite the impact of the appreciation of the yen, 8.4 billion yen.
% shows sales ratio against total company sales
[billions of yen]
[ % ] shows changed ratio from the same period of
previous year
(*2) 39%
40% 41% 43%
43% [ 9%]
[ 19%]
35%
[ 13%]
[ 3%]
[ 9%]
[ 7%]
[ 6%]
(*1) Value chain: Total of Parts & services, Solution business, Rental etc. other than new machine sales.
(*2) Solution business: The business segment primarily intends to provide development, production, distribution of parts and service solutions for
mining facilities and equipment after the sales made that are not included in the construction machinery business segment.
© Hitachi Construction Machinery Co., Ltd. 2021. All rights reserved. 39Business Results
Comparison of consolidated income forecast
Adjusted operating income for FY2021 is expected to increase by 29.3 billion yen y-y due to
an increase in sales volume and model mix, although there are the fall in the selling price,
increase in overheads costs and material costs and the appreciation of the yen.
Sales Volume 30.4
[billions of yen] Model mix of value chain business 9.0
Other model mix 10.6 Increase of expense linked to
100 production and sales -8.8
Decrease of general overheads 2.6
90 52.6 -0.9 -0.2 -20.3 Increase of expense for sustained
growth -14.1
Overhead
Sales volume, model mix & others
80
Selling price
Material cost
70 -1.9 62.0 0.9
29.3 -0.4 58.0
32.7
Expenses related structural reform
Foreign exchange rate
60
Adjusted operating income
income
variance of adjusted operating
expenses
Other operating income and
Adjusted operating income
50
28.2
Operating income
40 US$ -0.9
EUR 0.8
Operating income
RMB -0.1
30
AU$ -0.9
20
10
0
FY2020 FY2021 FY2020 FY2021
Actual Forecast Actual Forecast
Total variance excluding FX effect 31.2
© Hitachi Construction Machinery Co., Ltd. 2021. All rights reserved. 40Business Results
Appendix 1: FX rate and FX sensitivity
The forecast exchange rate for FY2021 was set within the expected fluctuation range for each
currency.
FX rate and FX sensitivity [billions of yen]
FX rate FX sensitivity (1Q-4Q)
Adjusted
Currency FY21 FY20
Condition Revenue operating
Forecast Actual income
US$ 105.0 106.0 Impact by 1 yen depreciation 2.0 1.6
EURO 125.0 124.6 Impact by 1 yen depreciation 0.7 0.5
RMB 15.5 15.7 Impact by 0.1 yen depreciation 0.5 0.2
AU$ 73.0 76.0 Impact by 1 yen depreciation 2.1 0.3
© Hitachi Construction Machinery Co., Ltd. 2021. All rights reserved. 41Business Results
Appendix 2: Detail of mining revenue
[billions of yen]
FY19 FY20 Change FY21 Change
Actual(A) Actual(B) (B)-(A) Forecast(C) (C)-(B)
America Excavator 18.2 10.6 -7.7 6.8 -3.8
Dump Truck 3.9 2.1 -1.8 2.5 0.4
Total 22.1 12.7 -9.5 9.2 -3.4
Europe, Africa Excavator 23.0 15.3 -7.7 20.8 5.5
and Middle East Dump Truck 12.9 12.2 -0.7 13.9 1.7
Total 35.9 27.6 -8.3 34.7 7.2
Asia & Oceania Excavator 73.4 49.6 -23.8 64.6 15.0
Dump Truck 32.9 30.8 -2.1 26.5 -4.3
Total 106.3 80.5 -25.9 91.1 10.7
China Excavator 0.6 0.7 0.1 0.6 -0.1
Dump Truck 0.1 0.1 -0.1 0.1 0.1
Total 0.8 0.8 0.0 0.7 -0.1
Japan Excavator 1.7 1.6 -0.1 1.6 0.0
Dump Truck 0.0 0.4 0.4 0.6 0.2
Total 1.7 2.0 0.3 2.1 0.2
Total Excavator 116.9 77.9 -39.1 94.4 16.5
Dump Truck 49.8 45.6 -4.2 43.6 -2.0
Total 166.8 123.5 -43.3 138.0 14.5
© Hitachi Construction Machinery Co., Ltd. 2021. All rights reserved. 42Business Results
Appendix 3: Segment information
The amortizations of PPA are included in the adjusted operating income of the solution
business. The amounts of 1.0 billion yen each are included in the FY2020 and forecast for
FY2021.
[billions of yen]
Reportable segment
FY2020 Construction
Solution Adjustments*1 Total
Actual Machinery
Business
Business
Revenue 734.2 82.4 -3.3 813.3
Adjusted operating income 3.5% 25.8 8.4% 6.9 - 4.0% 32.7
[billions of yen]
Reportable segment
FY2021 Construction Adjustments
Solution Total
Forecast Machinery *1
Business
Business
Revenue 798.4 81.6 - 880.0
Adjusted operating income 6.9% 55.2 8.4% 6.9 - 7.0% 62.0
*1: Adjustments represent eliminations of intersegment transactions and amounts of companies that do not belong to any operation segment.
© Hitachi Construction Machinery Co., Ltd. 2021. All rights reserved. 43Appendix4 : Actual and forecast of consolidated Business Results
capital expenditures, depreciation, and R&D expenses
Capital investment in FY2021 is specialized in reorganizing domestic and overseas factories
and expanding the rental business.
1. Capital Expenditure (Based on completion) [billion of yen]
FY2017 FY2018 FY2019 FY2020 FY2021
Actual Actual Actual Actual Forecast
Capital Expenditure 18.7 30.4 47.2 34.7 59.8
Assets held for operating lease 23.1 27.2 36.9 38.6 51.3
Total 41.8 57.6 84.1 73.4 111.1
2. Depreciation (tangible and intangible fixed assets) [billion of yen]
FY2017 FY2018 FY2019 FY2020 FY2021
Actual Actual Actual Actual Forecast
Capital Expenditure 27.5 26.8 34.2 35.3 36.1
Assets held for operating lease 10.3 10.1 12.0 14.9 17.6
Total 37.8 37.0 46.1 50.2 53.8
3. R&D expenses [billion of yen]
FY2017 FY2018 FY2019 FY2020 FY2021
Actual Actual Actual Actual Forecast
Total of consolidation 24.6 24.8 23.7 24.8 29.0
© Hitachi Construction Machinery Co., Ltd. 2021. All rights reserved. 44Company Outline and Topics Corporate Vision 1. Management Plan 2. Business Results 3. Company Outline and Topics
Company Outline and Topics
Company Outline

・Company Name          Hitachi Construction Machinery Co., Ltd.
                       Stock Exchange Listings:Tokyo (#6305)
・Major Operations      Manufacturing , sales and service of construction equipment,
                       transportation equipment, and other machines and devices.

・Established           1 October, 1970

・Capital               81.6 billion Yen (Hitachi, Ltd:50.81%)

・President             Kotaro Hirano

・Subsidiaries          Japan: 7 companies, Overseas: 74 companies
 Affiliates            Japan: 3 companies, Overseas: 20 companies

・Number of Employees   Consolidated :24,872     Non-consolidated :5,455

                                                                                               (March 31, 2021)

                                                        © Hitachi Construction Machinery Co., Ltd. 2021. All rights reserved.   46
Company Outline and Topics
Our Products and Revenue
Construction
Road Construction
Hydraulic Excavator Mini excavator Wheel-drive Type Double-Front Work Wheel Loader equipment
(Hybrid / ICT hydraulic excavator) Hydraulic Excavator Machine
Value Chain Mining
43% Others
Rental 5%
7%
Solution
Business
10% Dump Truck Ultra-large Hydraulic Excavator
FY2020 Revenue
Construction Construction Value Chain
Parts & 813.3 New Machine business
Services 52%
(Billions of yen )
11%
Mining H-E Parts Bradken
Parts & Services
10%
Mining
New Machine Mine management system ConSite
5%
© Hitachi Construction Machinery Co., Ltd. 2021. All rights reserved. 47Company Outline and Topics
Sales Trend
( Billions of yen ) (%)
12,000
1,200 ‘08 the collapse ’19~ COVID-19 90
of Lehman Brothers
Overseas revenue
海外売上高 80
10,000
1,000
Domestic revenue
国内売上高 70
800
8,000 Overseas revenue ratio
海外事業比率 60
‘97 Asian
Financial Crisis
50
600 ‘91 the bursting of
6,000 the Japan’s bubble
economy 40
400
4,000 30
‘85 Plaza Accord 20
200
2,000
10
00 0
'70 '75 '80 '85 '90 '95 '00 '05 '10 '15 ‘20
© Hitachi Construction Machinery Co., Ltd. 2021. All rights reserved. 48Company Outline and Topics
Sales Trend-Decentralization in sales and profit
■Sales ratio in China decreased, regional decentralization in profit
(FY10) (FY16) (FY21)Estimate
China : 26% → 10% → 8%
Asia & Oceania(Oceania) : 26%(10%) → 28%(13%) → 30%(16%)
The Americas : 8% → 11% → 18%
(billions of yen) Go Together
2013
GROW TOGETHER
2016
CONNECT TOGETHER
2019
Realizing Tomorrow’s
Opportunities 2022
(billions of yen)
US$ 114 101 92 85 79 82 100 111 120 109 111 111 109 105 105
Euro 161 156 129 112 108 108 135 138 132 119 130 128 121 125 125
© Hitachi Construction Machinery Co., Ltd. 2021. All rights reserved. 49Company Outline and Topics
Global Network(Major sites)
Russia
Europe
Americas
China
Middle East Japan
India
Asia
Africa Oceania
Sales & Service Manufacturing
*Including parts remanufacturing
© Hitachi Construction Machinery Co., Ltd. 2021. All rights reserved. 50Company Outline and Topics
Growth Potential of HCM
Concentrating on the continuous structural reform
to secure sales and profit
⚫ +:Consolidation of joint venture business in India, Acquisition of Wenco®, Bradken,
and H-E Parts, etc.
⚫ -:Withdrawal from engine manufacturing, temporal withdrawal of small-sized
dump truck, non-consolidation of crane business, etc.
Increase in sales and profit of parts & service
utilizing ConSite®
⚫ Increase in timely proposals to customers based on high accuracy machinery
information
⚫ Effect of customer-based service via direct sales and service
Open innovation and Efficient R&D through synergy with
Hitachi group
⚫ Development of AC dump truck and AHS in short-time because of accumulated
technology from performance in other sectors
⚫ Expectation for further improvement via accumulated machinery information
with AI analysis on Global e-service®
⚫ Accelerate promotion of Collaborative Construction Equipment development
and technological development for reducing CO2 emissions
© Hitachi Construction Machinery Co., Ltd. 2021. All rights reserved. 51Company Outline and Topics
Growth Potential of HCM-1
Concentrating on the continuous structural reform
to secure sales/profit Signed a MoU with ABB
Investment in Australian Startup Baraja
Establishment of Synergy Hire (Rental in UK)
Investment in ACME(Rental in US)
Acquisition of WENCO®
Acquisition of Bradken
Consolidation of Hitachi Brand Wheel loaders
joint venture in N. America
business in India
Acquisition of H-E Parts
1974 2009 2010 2012 2016 2017 2018 2019 2020
Withdrawal from engine Temporal withdrawal of
manufacturing small-sized dump truck
Discontinuation of Non-consolidation of
forklift business crane business
© Hitachi Construction Machinery Co., Ltd. 2021. All rights reserved. 52Company Outline and Topics
Acquisition of Two Solution Business Companies
Aiming to deepen the value chain of the mining business
Bradken H-E Parts
✓ 1922: Company established ✓ 2006: Company established
✓ March 2017: Restructured as subsidiary of ✓ December 2016: Restructured as subsidiary of
HCM HCM
✓ Expanded to Australia, USA, Africa, Europe, ✓ Expanded to Australia, USA, Chile, Canada, and
Asia, China, and other areas other areas
✓ Main strength: Technical capabilities in ✓ Main strength: Comprehensive after-market
molding and casting solutions
GET* , etc. Liners for Castings for fixed Specialty Comprehensive Services & parts for Comprehensive, high- Comprehensive
crushers and plant mining castings, etc. solutions for crushing horsepower diesel undercarriage parts
mills, etc. equipment, etc. mobile mining equipment as well engine and GET for mobile
equipment as on-site and off- remanufacturing construction
site services & solutions equipment
repairs (including rebuilding)
*Ground Engaging Tools © Hitachi Construction Machinery Co., Ltd. 2021. All rights reserved. 53Company Outline and Topics
Accelerating our open innovation in the mining business
Signed a MoU with ABB
to collaborate to target net-zero
emissions from mining machinery
Signed: March 2021
• Applying ABB’s electrification, automation
and digital solutions to mining machinery
• Providing solutions that streamline and
optimize overall mining operations
Rigid dump truck on trolley line
Investment in Australian Startup
Baraja to accelerate development
for autonomous operation
Invested: March 2021
• Accelerating the development of LiDAR Images captured by LiDAR
products with mine site specifications and
strengthening local support.
• Applying the improvement of AHS and .* LiDAR is an abbreviation for Light Detection And
Ranging. This technology detects the shape of an object
autonomous operation of ultra-large and the distance to the object by irradiating the object
hydraulic excavators. with a laser beam and capturing the reflected light with a
sensor.
© Hitachi Construction Machinery Co., Ltd. 2021. All rights reserved. 54Company Outline and Topics
Growth Potential of HCM-2
Enhancement in proposals and increase in sales and profit of parts & service
utilizing Big Data Analysis
Global e-Service®
Information
® Sign
of machines and sensors
diagnostic ConSite®OIL※1
Periodical report Customer Number of units
in operation
Urgent report
Approx.330,000
Accumulated know-how
Big Data • Service know-how
Analysis • Failure diagnostics
• Technological knowledge
ConSite®
Pocket※2
Inspection/ Enhancement
Maintenance/
maintenance in proposals
Recommendation of Service Manual
parts that often need Information
to be replaced at the ConSite® ConSite®
same time
Shot※3 Health
Check※4
※1:OIL sensing service for hydraulic oil or engine oil Sales dealers
(when sensors attached) / service representatives
※2:App for customers and sales dealers to receive reports
※3:Tools for service reps to inspect & propose for sites
※4:App for automated health check of equipment due to engine
Order
operation sound and measurement of hydraulic pump pressure availability; HCM’s
※5:Order system for HCM’s genuine parts over the Internet at any time
ConSite®Parts anytime, Parts
and from any location. It enables to check stocks, price, delivery time and anywhere Warehouse
recommended parts that often need to be replaced at the same time. Web Shop
※:Areas for direct sales/service; Japan, Oceania/Asia, S.Africa,
Netherlands, UK and USA(WL)
© Hitachi Construction Machinery Co., Ltd. 2021. All rights reserved. 55Company Outline and Topics
Service Solution - ConSite
◼ Information infrastructure linking customers all over the
world 24 hours a day, 365 days a year
◼ Provide high quality maintenance & repair services earlier
than before
Fully automated system
for remote fault prediction
KPI: Remote prognostic detection rate* by sensing
113 countries & regions
and 33 languages are covered. Failure prognostic detection rate
ConSite adoption rate FY2023
18
Target 90%
万
16
Number of contracts: 75%
158,000 units 14 71%
※As of the end of March 2021 12 58%
37%
10
20%
8
FY15 FY17 FY18 FY19 FY20
FY2022 Target 6
adoption rate 4 *prognostic detection rate
90% 2 Percentage of all failure patterns occurring in major components of
hydraulic excavators (excluding accessory failures) that can be
0 notified and covered in ConSite ® Alarms Report
2014 2020 © Hitachi Construction Machinery Co., Ltd. 2021. All rights reserved. 56Company Outline and Topics
Topic: Digital Solutions to Resolve Problems at Mine Sites
Developed “ConSite® Mine”remotely monitoring mining
machinery on 24/7 basis, with Wenco. Releases in 2021.
• Visualize prediction the occurrence of cracks in the boom
or arm by utilizing IoT, AI and applied analysis technologies
• Analyzing operator’s operational patterns and fuel consumption
• Improving productivity and safety, reducing life-cycle costs
Arm Boom ®
Analyzing loads
to ultra-large excavator boom or arm Dashboard (example)
© Hitachi Construction Machinery Co., Ltd. 2021. All rights reserved. 57Company Outline and Topics
Growth Potential of HCM-3
Efficient R&D through synergy with Hitachi group
Hitachi Group Technology Development to HCM’s
Product and Service
Transportation
Automobile Energy
Big data AI
Solution Linkage®
ConSite®, AHS,
Wenco®, ICT equipment
Improvement in energy
productivity at factory※1
※1:Utilizing Hitachi’s technology Emilia®; Integrated management of
energy data and facility
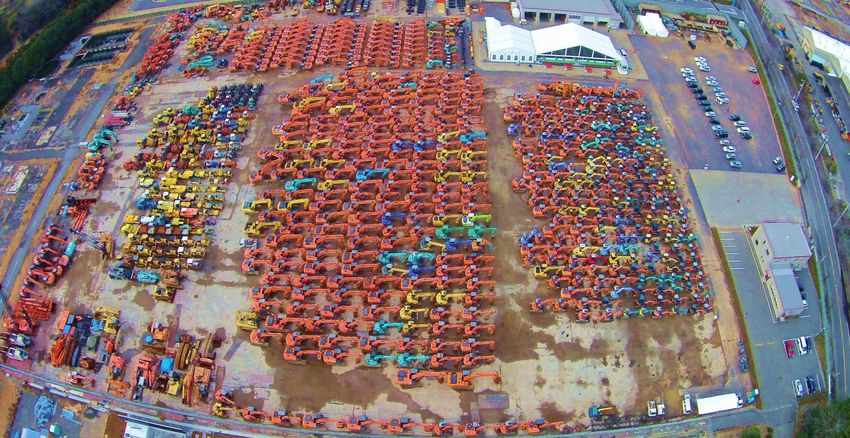
© Hitachi Construction Machinery Co., Ltd. 2021. All rights reserved. 58“One Hitachi” Approach in Development of 59
AC Rigid Dump Trucks
Development of next-generation machines and progress of rigid
dump truck autonomous haulage system (AHS)
Trolley compatibility Control cabinet
Hitachi Power Solutions Co., Ltd. Hitachi, Ltd. Research & Development Group
Electrical Systems Division
Alternator
Grid box Hitachi, Ltd.
Hitachi, Ltd. Electrical Systems Division
Electrical Systems Division
Features
- Excellent operational performance, high-efficiency cycle AC wheel motor
time, and lower maintenance costs
Hitachi, Ltd.
- Class-leading retarder (electric brake) performance
Electrical Systems Division.
© Hitachi Construction Machinery Co., Ltd. 2018. All rights reserved.Company Outline and Topics
【AHS】Autonomous Haulage System (AHS) for dump trucks
Scalability
Hitachi's railway traffic management system keeps data traffic per unit under control and can
handle about a hundred of fleets.
Flexibility
Dump trucks equipped with Hitachi's automobile electric control technology and AC motor
control technology can be converted into AHS model after delivery.
Agility
Realized fast system improvement to meet customers’ project needs
due to simulation technology etc..
Current status and further developments
FY2017: Implementation of commercialization test
FY2018: User test with Whitehaven Coal in Australia
Commercialization (planned)
© Hitachi Construction Machinery Co., Ltd. 2021. All rights reserved. 60Company Outline and Topics
System Platform for Autonomous Construction Machinery
Development of a System Platform “ZCORE® ”
for Autonomous Construction Equipment
• Enabled the machinery to recognize, judge and execute, which operators
conventionally do
• Easy addition and customization of functions, adapting various customer needs
more quickly
• Applied to all kinds of our construction machinery, regardless of product type or size
© Hitachi Construction Machinery Co., Ltd. 2021. All rights reserved. 61Company Outline and Topics
Topic: Strengthening the system to meet new market needs in China
Expanding the product line-up of excavator for civil construction use
• Mainly targeting self-employed operators, who are the volume zone of demand
• Realizing the best suited specifications and structure for urban civil construction
and the high cost-effectiveness
• Utilize the operating data of the models for new product development and sales
strategy in the future.
6-ton class 12-ton class 20-ton class
Strengthening our group’s sales and service systems
• Newly opened three regional offices, Chengdu, Beijing, Shanghai
to support dealers in their nearby regions
• Holding seminars on systematic sales methods and sales process
management.
Collaborate on rental and used equipment businesses,
deepen value chain business
• Selling our rental equipment as high-quality used equipment National Dealer
"PREMIUM USED“. Conference
© Hitachi Construction Machinery Co., Ltd. 2021. All rights reserved. 62Company Outline and Topics
Verification Tests to Start Directed
at the Development of Autonomous Ultra-Large Hydraulic Excavators
• Utilizing the knowledge from many years of research and development in the
remotely control technology to cater to the needs of customers
• Effective use of customer-owned equipment to retrofit onto the EX-7 series
Ultra-large hydraulic excavator, EX3600-7(right)
Current status and future schedule
Until 2023: Development of remote operation systems including working assistance systems
Until 2026: Combine remote control systems with partial operation automation
(autonomous drilling and loading functions)
Until 2030: Added autonomous operation function
© Hitachi Construction Machinery Co., Ltd. 2021. All rights reserved. 63Company Outline and Topics
Topic: Proactively promoting battery-powered mini excavators in
response to growing demand for electrification
Electric Mini Excavators now on sale since 2020 by collaboration
between Japan & Europe
• Demand for electric construction machinery is growing, as the shift
to electric vehicles becomes clear.
• 8-ton class has received orders for about 25 units in Europe for 2020, target 50 units for 2021.
• 5-ton class is scheduled to be released for Japan and Europe during FY2021.
• Equipped with lithium-ion batteries and powered by both battery and commercial power.
European
HCM*
Application
HCM Tierra
Center
Battery-powered mini excavator
Development based on existing models with a short rear end swing design
to rapidly respond to European market developed with an emphasis on work
needs in narrow spaces
* Hitachi Construction Machinery
2-ton class prototype and 8-ton class on sale 5-ton class prototype
© Hitachi Construction Machinery Co., Ltd. 2021. All rights reserved. 64You can also read