Valuing Wrexham's Urban Forest - Assessing the Ecosystem Services of Wrexham's Urban Trees: A Technical Report - Natural Resources Wales
←
→
Page content transcription
If your browser does not render page correctly, please read the page content below
Valuing Wrexham’s
      Urban Forest
    Assessing the Ecosystem
Services of Wrexham’s Urban
   Trees: A Technical Report

  Heather Rumble, Kenton Rogers,
  Kieron Doick and Tony Hutchings

                         June 2014

                   The Research Agency of the
                         Forestry Commission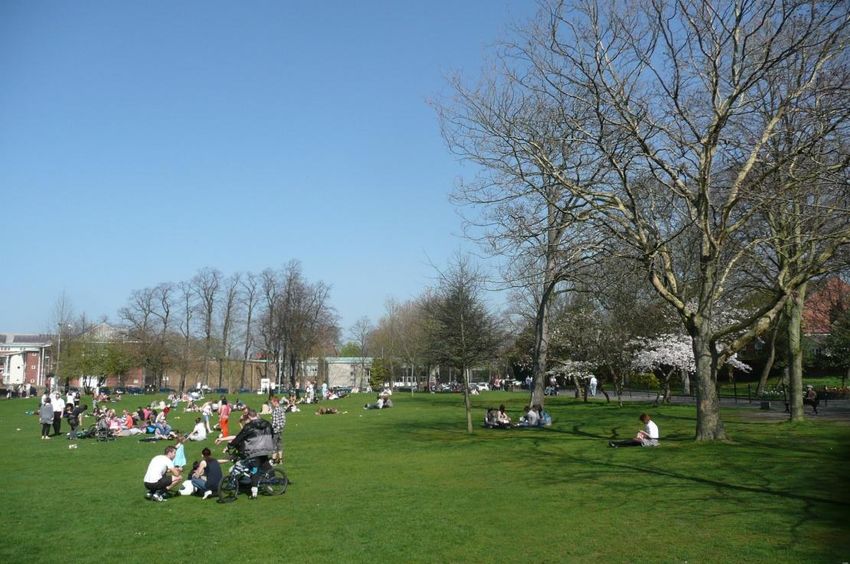
Valuing Wrexham’s Urban Forest

Forest Research is the Research Agency of the Forestry Commission and is the leading
UK organisation engaged in forestry and tree related research. The Agency aims to
support and enhance forestry and its role in sustainable development by providing
innovative, high quality scientific research, technical support and consultancy services.

Treeconomics is a social enterprise, whose mission is to highlight the benefits of trees.
Treeconomics works with businesses, communities, research organisations and public
bodies to achieve this.

i-Tree is a state-of-the-art, peer-reviewed software suite from the USDA Forest Service
that provides urban and community forestry analysis and benefits assessment tools. The
Forest Service, Davey Tree Expert Company, National Arbor Day Foundation, Society of
Municipal Arborists, International Society of Arboriculture, and Casey Trees have entered
into a cooperative partnership to further develop, disseminate and provide technical
support for the suite.

2   |   Technical Report   |   Rumble, Rogers, Doick, and Hutchings   |   June 2014
Valuing Wrexham’s Urban Forest

Contents
Valuing Wrexham’s Urban Forest ....................................................................... 4

    Summary .......................................................................................................... 4
    Key Results ....................................................................................................... 5

Introduction ....................................................................................................... 6

Methodology ....................................................................................................... 7

Results and Discussion ..................................................................................... 11

    Sample Area ................................................................................................... 11
    Urban Forest Structure ..................................................................................... 11
    Tree Cover and Leaf Area.................................................................................. 16
    Phenology ....................................................................................................... 18
    Structural value ............................................................................................... 18
       CAVAT valuation .......................................................................................... 18
       CTLA Valuation ............................................................................................ 20
    Avoided Surface Water Runoff ........................................................................... 20
    Air Pollution Removal ....................................................................................... 21
    Carbon Storage and Sequestration ..................................................................... 24
    Habitat Provision ............................................................................................. 29
    Risks of Pests and Disease ................................................................................ 31

Conclusions ...................................................................................................... 37

References ....................................................................................................... 40

Appendix I. Detailed Methodology .................................................................... 44

    i-Tree Eco Models and Field Measurements.......................................................... 44
    US Externality and UK Social Damage Costs ........................................................ 45
    CAVAT Analysis ............................................................................................... 46

Appendix II. Species Importance List............................................................... 48

Appendix III. Environmental services by species ............................................. 50

Glossary of Terms ............................................................................................. 52

    The Authors .................................................................................................... 54
    Acknowledgements .......................................................................................... 54

3    |   Technical Report         |   Rumble, Rogers, Doick, and Hutchings                   |   June 2014
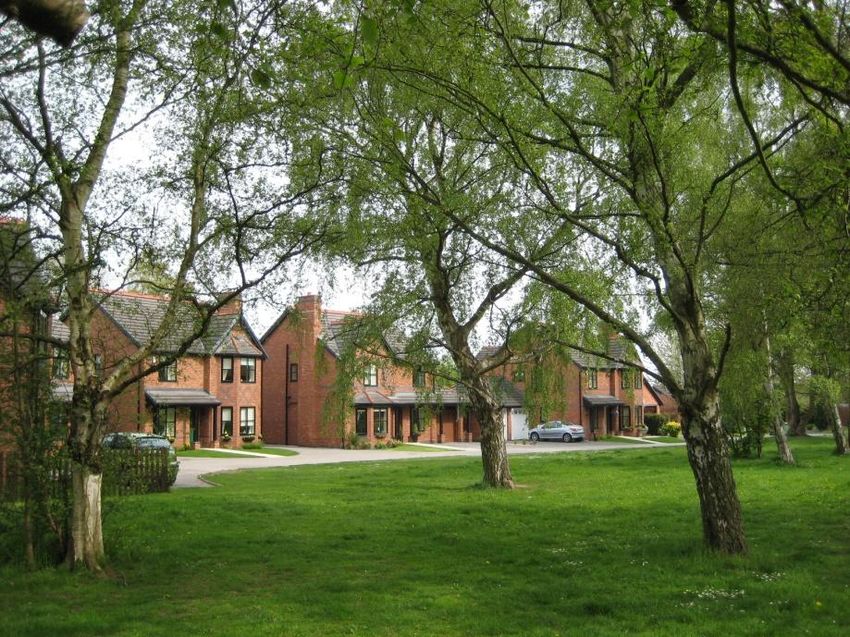
Valuing Wrexham’s Urban Forest

Valuing Wrexham’s Urban Forest
Summary
Urban forests are a valuable source of ecosystem services in towns and cities. They help
us alleviate problems associated with densely packed populations by improving local air
quality, capturing carbon and reducing flooding. They also provide food and habitat for
animals, such as birds and bees, and improve social cohesion in communities.

However, the value of urban trees, both quantifiable and otherwise, is often overlooked
within planning developments. By valuing the quantifiable services provided by trees in
Wrexham County Borough, Wrexham County Borough Council and Natural Resources
Wales can increase the profile of the County’s urban forests, ensuring their value is
maintained and improved upon. In addition, valuing these ecosystem services helps
town planners, landscape architects and tree officers to plan where trees will be planted
for the maximum benefit.

A survey of Wrexham County Boroughs trees’ to value a number of ecosystem services
was undertaken in summer 2013 with the aid of i-Tree Eco, used for the first time in
Wales. i-Tree Eco is a model developed by the US Forest Service that allows scientists to
measure a range of ecosystem services provided by urban trees, from carbon
sequestration to pollutant removal. The study was funded by Natural Resources Wales
and Wrexham County Borough Council and was carried out by Forest Research.

The quality of life for residents of Wrexham is significantly improved by its urban forest,
helping alleviate flash flooding and sewer blockages, providing cleaner air and supporting
wildlife such as pollinators. In addition, Wrexham’s urban forest contributes significantly
to the local economy, saving around £1.2 million in services per year. This would be
enough money to plant nearly 800 medium sized oak trees in Wrexham and is
comparable to the amount needed to refurbish Wrexham cemetery (Wrexham.com,
2014).

Wrexham has a high density of trees but low canopy cover compared to similar sized
towns. A further 28% of Wrexham’s urban space could be planted with trees, bringing
Wrexham in line with other urban areas. Wrexham’s urban forest could also be improved
by planting a higher diversity of tree species, improving its resilience to pests and
diseases.

The number of large trees in Wrexham is above average for the UK and, in particular,
there are many impressive old oaks. However, there are fewer large trees than
recommended for a future-proofed urban forest, suggesting some room for
improvement. Increasing planting of large stature trees may future proof Wrexham’s
impressive stock of large growing trees.

A summary of key results is presented on page 5.

4   |   Technical Report   |   Rumble, Rogers, Doick, and Hutchings   |   June 2014
Valuing Wrexham’s Urban Forest

Key Results

        The ecosystem services provided by Wrexham’s trees in 2013 were
                     valued at more £1.2 million per year

        Wrexham has an urban tree density at 95 trees per hectare, totalling 364 000
        trees. This is higher than the average in England

        Wrexham has 17% tree cover, the average for Welsh towns

        The three most common tree species in Wrexham are sycamore, hawthorn and
        silver birch

        Wrexham has a high proportion of large trees compared to the rest of the UK

         Wrexham’s urban forest would benefit from more medium and large sized trees
        to ensure large trees exist in the future

        The replacement cost (not including ecosystem services) of Wrexham’s trees is
        around £0.9 billion

        The highest value trees for amenity in Wrexham are located in cemeteries

        Wrexham’s urban forest intercepts 278 000 m3 or water every year, equivalent
        to an estimated £460 000 in sewerage charges

        60 tonnes of air pollution are removed by Wrexham’s trees per year, worth
        more than £700 000 in terms of the damage they cause

        66 000 tonnes of carbon are currently stored in Wrexham’s trees

           o   This is the equivalent of the annual emissions of 109 000 cars

           o   This amount of carbon is estimated to be worth £14 million

           o   By 2050 this value will be £25 million according to current forecasts

        Each year Wrexham’s trees remove 1 300 tonnes of carbon from the
        atmosphere

           o   This offsets 3% of the emissions from cars owned in Wrexham

           o   This amount of carbon is estimated to be worth £24 000

        Willows, oaks and silver birch support the highest diversity of herbivorous
        insects, including beetles, butterflies and moths

5   |   Technical Report   |   Rumble, Rogers, Doick, and Hutchings   |   June 2014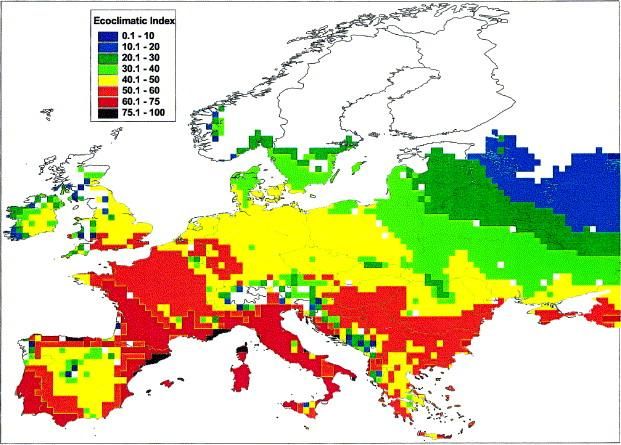
Valuing Wrexham’s Urban Forest

Introduction
Urban trees provide a range of ecosystem services, functions provided by nature on
which human life depends or is significantly improved. Assessing the value of these
services in Wrexham will enable Wrexham County Borough Council and other
stakeholders to value the urban forest as an asset to the community, providing a
baseline for future monitoring. In addition it will inform planting practises to maximise
space and budgets and raise the profile of urban trees.

Urban forests provide a number of health benefits
including improving local air and water quality by
absorbing and filtering pollutants (Bolund and
Hunhammar, 1999) and by reducing the urban heat
island effect (Akbari et al., 2001), decreasing illnesses
associated with poor air quality and heat. There is also
evidence that urban greenery can help reduce stress
levels and improve recovery time from illness (Ulrich,
1979).

Trees also provide a valuable habitat for much of the
UK’s urban wildlife, including bats (Entwistle et al.,
2001) and bees (RHS, 2012). They provide local
residents with a focal point to improve social cohesion
and aid education with regards to environmental issues
(Trees for Cities, 2011).
                                                            Simpson (2013)
Economic benefits are also provided by urban trees.
Trees store carbon within their tissues and continually absorb carbon, helping to offset
carbon emissions produced by other urban activities (Nowak et al., 2008). In addition,
urban trees help alleviate flash flooding, a problem that costs urban areas millions of
pounds each year (Bolund and Hunhammar, 1999). Trees also increase property value,
both commercially and privately (Forestry Commission, 2010).

A range of these benefits are quantifiable using models such as i-Tree Eco, developed by
the US Forest Service to aid the sustainable management of urban trees, including
planning tree planting. i-Tree Eco is currently the most complete method available to
value a whole suite of urban forest ecosystem services (Sarajevs, 2011) and has been
used successfully in over 60 cities globally, including studies in the UK. In this report we
present the findings of the first such assessment in Wales. Wrexham and the
surrounding towns and villages were surveyed, with data from trees and shrubs recorded
to estimate the replacement costs of trees, their amenity value and the value of
ecosystem services provided by Wrexham’s urban forest.

6   |   Technical Report   |   Rumble, Rogers, Doick, and Hutchings   |   June 2014
Valuing Wrexham’s Urban Forest
Methodology
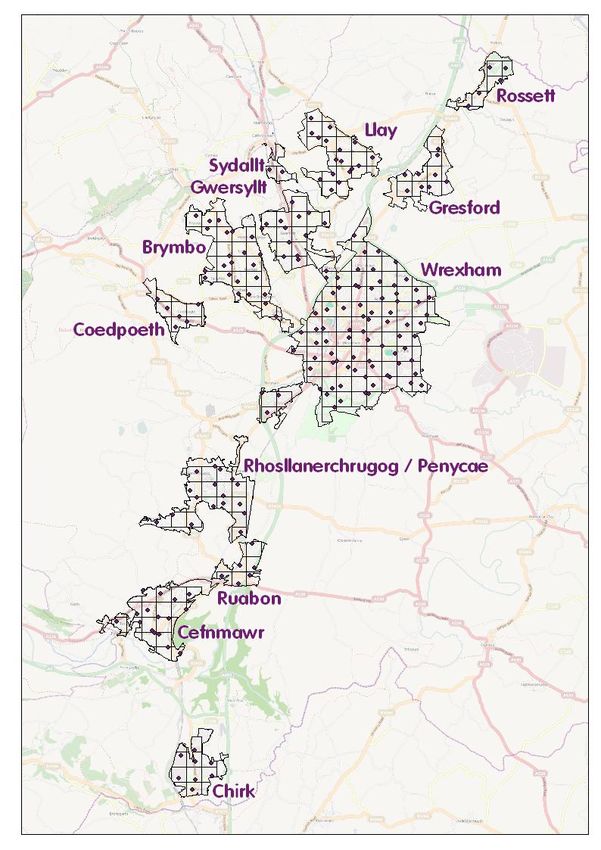
202 plots were selected from a randomised grid covering Wrexham and neighbouring
towns and villages (Fig 1). This method was chosen to overcome problems associated
with patchy land use, for example aggregations of industrial units in one area or
residential properties in another. Grid squares present on the edges of the sample area
were only included if they contained at least 50% of the grid square area. The total
sample area was 3 833 Ha, resulting in a sample plot every 19 Ha. This provided a high
density of plots, higher than previous studies in both Torbay (26 Ha) and Edinburgh
(57 Ha).
i-Tree Eco uses a standardised field collection method outlined in the i-Tree Eco Manual
(v 5.0 for this study) (USDA, 2013), and this was applied to each plot.
Each plot covered 0.04 Ha and from it was recorded:
The type of land use it was, e.g. park, residential
The percentage distribution of cover present in the plot e.g. grass, tarmac
The percentage of the plot that could have trees planted in it1
Information about trees (over 7 cm trunk girth)
o The number of trees and their species
o The size of the trees including height, canopy spread and girth of trunk
o The health of the trees including the
fullness of the canopy
o The amount of light exposure the
canopy receives
o The amount of impermeable surface
(e.g. tarmac) under the tree
Information about shrubs (less than 7 cm in
trunk girth, but over 1 m in height)
o The number of shrubs and their
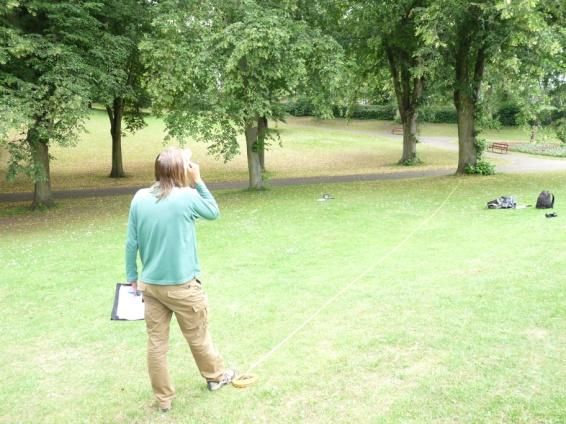
species Field operative Simon Morath
measuring tree height (Simpson,
o The size and dimensions of the shrubs
2013)
1
“Plantable space” was defined as an area that could be planted with little structural modification
(i.e. permeable surfaces such as grass and soil) and that was not in close proximity to trees or
buildings (i.e. would not be hampered in their growth).
7 | Technical Report | Rumble, Rogers, Doick, and Hutchings | June 2014Valuing Wrexham’s Urban Forest
Fig 1. The sample area for the study included plots in Chirk, Cefn Mawr, Ruabon,
Rhosllanerchrugog, Penycae, Wrexham, Coedpoeth, Brymbo, Gwersylt, Sydallt, Llay,
Gresford and Rossett. In total 202 plots were sampled (basemap: ©OpenStreetMap
contributors)
8 | Technical Report | Rumble, Rogers, Doick, and Hutchings | June 2014Valuing Wrexham’s Urban Forest
This information was submitted to the US Forest Service for use in the i-Tree Eco model
and a number of outputs calculated (Table 1). i-Tree Eco calculates the species and age
class structure, biomass and leaf area index (LAI) of the urban forest. This data is then
combined with local climate and air pollution data to produce estimates of a number of
ecosystem services (Table 1) and to assess their current and future value.
Weather data used was for the year 2012, recorded at Hawarden weather station,
approximately 10 km North of the sample area (Met Office 2012). NO2, SO2, PM10 and
PM2.5 were recorded at the Victoria Road station, Wrexham, in 2012. O3 (ozone) was
recorded at the Mold station in 2012. CO was recorded at the Llay station in 2006. All
pollution data was obtained from www.welshairquality.co.uk (2013).
Table 1. Outputs calculated based on field collected data
Urban forest Urban ground cover types
structure and Species diversity, canopy cover and age class
composition % leaf area by species
Phenology
Structural and Structural values in £
functional values Carbon storage and sequestration value in £
Pollution removal value in £
Ecosystem services Rainfall interception
Air pollution removal by urban trees for CO, NO2, SO2, O3, PM10 and PM2.5
% of total air pollution removed by trees
Current carbon storage by the urban forest
Carbon sequestered
Habitat provision Pollinating insects
Insect herbivores
Potential insect and Acute oak decline, asian longhorn beetle, chalara dieback of ash,
disease impacts emerald ash borer, gypsy moth, oak processionary moth, Phytophthora ramorum,
Phytophthora kernoviae, Phytophthora lateralis, red band needle blight,
sweet chestnut blight
Mean average leaf-on/leaf-off dates were calculated using datasets from the UK
phenology records (Natures Calendar, 2013). The data from 10 species were selected to
calculate a UK average (field maple, sycamore, horse chestnut, common alder, silver
birch, common beech, common ash, common oak, sessile oak and rowan) over a 5 year
period (2009-2013) to provide a leaf-on date. However, because leaf-off is not in itself
an event in the UK phenology database, a further average was taken from the first leaf
fall and bare tree events for the 10 species across the five years (2008-2012) to provide
an average date for the leaf off event.
Where outputs generated by i-Tree Eco were based on US values, UK government
guidance was used to tailor values for a UK scenario. These included carbon
(DECC, 2011) and pollution valuation (HM Treasury, 2011).
9 | Technical Report | Rumble, Rogers, Doick, and Hutchings | June 2014Valuing Wrexham’s Urban Forest
Additional structural values were also obtained. i-Tree Eco currently outputs tree values
based on The Council of Tree and Landscape Appraisers (CTLA, 1992) valuation method.
However, the Capital Asset for Amenity Trees (CAVAT) (Neilan, 2010) method was also
used as this takes extra variables into account, such as tree health, appropriateness of
the species to the site and the amenity value of the trees. Whereas CTLA values a tree in
terms of the value to its owner, the additional amenity assessment in CAVAT adds a
further social dimension, placing a public value on the tree. Both methods are widely
used in the UK.
In addition to the outputs provided by i-Tree Eco, pest susceptibility was also assessed
using information regarding the number of trees within pathogen/pest target groups.
The habitat provided by different species was also assessed. A detailed methods section
for both i-Tree Eco calculations and additional calculations is provided in Appendix I.
Simpson (2013)
10 | Technical Report | Rumble, Rogers, Doick, and Hutchings | June 2014Valuing Wrexham’s Urban Forest
Results and Discussion
Sample Area
Based on the plots sampled in Wrexham, approximately 28(±2)% of the ground cover
could be planted with trees. Cover of trees was 17(±2)% of the sample area and shrubs
covered 11(±1)% of the sample area. Tree cover in Wrexham is equal to the Welsh
average but lower than neighbouring Llangollen (28%) and towns of a similar size such
as Pontypool (24%) and Neath (23%).
52% of the ground cover in Wrexham consisted of permeable materials such as grass
and soil (Fig 2). The remainder of the ground cover consisted of non-permeable surfaces
such as tar and cement (Fig 2). Permeable surfaces alleviate problems associated with
flash flooding, reducing loads on sewer systems. This can potentially prevent traffic
incidents caused by flooding, as occurred in Wrexham in 2013 (wrexham.com, 2013)
and sewer failures, also reported in Wrexham (heart.co.uk, n.d.). Wrexham has a lower
percentage of permeable ground cover than Torbay (approx. 66%).
Building Maintained
19% grass
30%
Tar
18%
Herbs
8%
Cement Unmaintained
6% Rock grass
5% Water Mulch Bare soil 7%Valuing Wrexham’s Urban Forest
Torbay (105 trees2 p/Ha) (Rogers et al., 2011). Tree canopy cover is 17%, comparable
to the Welsh average for towns of 16.8% and higher than the English average (8.2%)
(Fryer, 2014).
The three most common species are sycamore (Acer pseudoplatanus), hawthorn
(Crataegus monogyna) and silver birch (Betula pendula) (Fig 3). The ten most common
tree species account for 70% of the population (Fig 3).
Other species Sycamore
30% 16%
Hawthorn,
common
12%
Goat willow
4% Silver birch
Unidentified 11%
hardwoods
4% Ash, common
Hazel, Leyland 5%
common Willow spp. Wild cherry cypress
4% 4% 5% 5%
Fig 3. Breakdown of tree species in Wrexham and the surrounding towns.
Vacant Agriculture Cemetery
Transport 3% 1% 1%
4% Multi-family
1%
Institutional
4%
Commercial
5%
Park
Residential 61%
20%
Fig 4. Proportion of trees on land use types where trees were found. Land use types
where no trees were found are omitted.
2
Torbay’s Urban Forest (Rogers et al., 2011) states a density of 128 trees p/Ha. However, trees
smaller than those in the Wrexham and Edinburgh were measured. These have been filtered out
and reanalysed for better comparison and it is these comparative values that are used throughout
this report.
12 | Technical Report | Rumble, Rogers, Doick, and Hutchings | June 2014Valuing Wrexham’s Urban Forest
In plots where trees were found parks and residential areas contained the most trees
(Fig 4).
The diversity of species can be calculated using the Shannon-Wiener index. This is a
measure of not only the number of different species, but how whether the population is
dominated by a certain species. The diversity of Wrexham’s urban forest is 3.06
according to this index. This is marginally lower than was found in Torbay (3.3) (Rogers
et al., 2011) and Edinburgh (3.2). The highest diversity of trees was found in residential
areas (Fig 5).
4
Shannon Wiener diversity
3
2
1
0
Golf course
TOTAL
Vacant
Other
Park
Transport
Agriculture
Residential
Commercial
Utility
Cemetery
Multi-family
Wetland
Institutional
Land use type
Fig 5. Shannon Wiener diversity for each study area on separate land use types.
Santamour (1990) recommends that for urban forests to be resilient to pests and
diseases, no species should exceed 10% of the population, no genus 20% and no family
30%. Three species exceeded the 10% guideline (sycamore, hawthorn and silver birch;
Fig 3). No genus exceeded 20% frequency and no family exceeded 30%.
In addition to diversity, where trees come from can be important. With new pests and
diseases emerging, such as Chalara ash dieback, and with the onset of climate change
some councils are considering the use of exotic species. Increasing the pool of trees
available for tree officers to plant by including non-natives is also being considered to
provide a wider range of options for successful tree survival. This is important in an
urban area where there are additional challenges to tree planting, such as exposure to
drought and insufficient rooting volumes. However, there is intense debate about
whether the costs outweigh the benefits (Johnston et al., 2011). Exotic species tend to
have fewer pests associated with them due to being removed from the home range of
their specialist herbivores and diseases (Connor et al., 1980). However, they can also
perturb native ecosystems by changing the available niches for wildlife to fill (Townsend
13 | Technical Report | Rumble, Rogers, Doick, and Hutchings | June 2014Valuing Wrexham’s Urban Forest
et al., 2008). They also support fewer native animals (Kennedy and Southwood, 1984)
and can become invasive due to their lower association with pests (Mitchell and Power,
2003). Thus, a balance of native and non-native species may provide the most resilient
solution.
In Wrexham, approximately 14% of the trees have origins in Europe. Most species
(55.5%) have origins in both Europe and Asia (Fig 6). 59% of the trees in Wrexham are
native to England and Wales, 22% are naturalised and 9% are non-native3.
60 56%
50
Frequency/%
40
30
20 15% 14%
10 6% 6%
1% 1% 1%
0
E&A E&A+ E NA + NA NA & A Unk
SA +
Continent of origin
Fig 6. Origins of tree species in Wrexham. A:Asia; E:Europe; NA: North
America; SA: South America; Unk: Unknown; + denotes origins from
additional continents.
The size distribution of trees is also important. Large, mature trees offer unique
ecological roles not offered by small, younger trees (Lindenmayer et al., 2012), but
young trees are needed to restock trees as they age and die. It is estimated that trees
that have diameters (diameter at breast height; DBH) less than 15cm constitute 47% of
the total tree population in Wrexham (Fig 7).
The number of trees in each DBH class declines successively, with only 28% of trees
reaching DBH’s of 20cm or above. This is at the higher end of the range of 20cm+ trees
found in the majority of England (Britt and Johnston, 2008) but studies in North America
suggest an ideal value of 60% for healthy urban tree stocks (Richards, 19834). Large
trees provide greater ecosystem services benefits (USDA, 2003) than small ones, so
Wrexham County Borough could improve on this element.
3
Some trees were identified to genus level only, encompassing both native and non-native
species. Some trees were dead so could not be assessed for nativity. These two groups (dead
trees and trees identified to genus level only) encompassed 10% of Wrexham’s trees.
4
Richards (1983) comments on the size classes of street trees necessary to maintain populations
found in urban areas. However, street trees only made up a small proportion of the trees
analysed in the current study and so there is a need for this work to be expanded further.
14 | Technical Report | Rumble, Rogers, Doick, and Hutchings | June 2014Valuing Wrexham’s Urban Forest
Using the DBH of trees to infer age, however, is a simplistic approach. In Wrexham
County Borough, the large number of small trees is heavily influenced by the prevalence
of hawthorn, a naturally small species even at maturity. Though there is evidence to
suggest that large trees provide more ecosystem services than small growing ones
(USDA, 2003), little work has been conducted to compare large growing trees with
dense stands of comparable size such as those that hawthorn produce, so a value
comparison in terms of the ecosystem services provided is difficult. Overall, a good
strategy may be to supplement small growing trees with young, naturally larger growing
trees in order to ensure large growing tree stocks are future proofed, without losing
potentially valuable mature small growing tree stands.
80 72%
60
Frequency/%
40 22%
4% 2%
20
0Valuing Wrexham’s Urban Forest
100
80
Frequency/%
60
40
20
0
Land use typeValuing Wrexham’s Urban Forest
relies on leaf surface area (Nowak, 2006) and other factors such as shading are
influenced by leaf area.
35
30
25
Leaf area/%
20
15
10
5
0
Tree species
Fig 10. Tree species in order of leaf area/%.
Taking leaf area and prevalence into account, it is possible to rank tree species by
calculating an “importance value” (IV).
In the case of the Wrexham study, all three of the most prevalent species are also leafy
species (unlike if a softwood, such as Leyland Cypress, was prevalent) (Fig 11). This
means that the three most prevalent species are also the three most important. Other
species in the top 10 most important species, however, do not appear in the same order
as prevalence (Fig 11).
17 | Technical Report | Rumble, Rogers, Doick, and Hutchings | June 2014Valuing Wrexham’s Urban Forest
50 18
16
40 14
Frequency/%
12
30
10
IV
8
20
6
10 4
2
0 0
Tree species
IV Frequency/%
Fig 11. Importance value (IV) for the top ten most important trees and their frequency/%.
Phenology
Ecosystem service provision relies not only on the leaf area of trees but also the length
of time each year that trees are in leaf. The date each year that trees come into leaf and
later lose their leaves (i.e. phenology) varies depending on weather. The average date
calculated for leaf on in the last five years was April the 14th. The average date
calculated for leaf off in the last five years was November the 2nd. It was estimated,
therefore, that trees in Wrexham were in leaf for approximately 202 days in 2013.
Structural value
Aside from the value associated with the ecosystem services provided by trees, trees
also have a real cost, principally the cost of replacing them should they be lost or
damaged. This can be helpful for tree owners should a tree be cut down unlawfully, for
example if a person cuts a tree down that does not belong to them, or if a tree is
damaged. A number of methods are used by arborists to value trees; here we present
two of the most common in the UK and USA, CAVAT (Capital Asset Valuation for Amenity
Trees) and CTLA (Council of Tree and Landscape Appraisers method).
CAVAT valuation
Wrexham’s urban forest is estimated to be worth £1.4 billion according to CAVAT
valuation, taking into account the health of trees and their amenity value. As an asset to
the county borough, this is equivalent to nearly 350 times the cost of constructing the
Mold Road football stand at Wrexham’s Racecourse Ground. Black poplars in Wrexham
County Borough hold the highest structural value (Fig 12), representing 26% of the
value of all Wrexham County Borough’s urban trees. The single most valuable tree
encountered in the study was a black poplar situated in Wrexham Cemetery, estimated
have an asset value of £793 000.
18 | Technical Report | Rumble, Rogers, Doick, and Hutchings | June 2014Valuing Wrexham’s Urban Forest
Wild cherry Other species
Willow spp.
1% 19% Black poplar
2%
26%
Holly,
common
3%
Small leaved
lime Sycamore
5% 15%
Silver birch
4% Oak, Beech,
common Plane spp. common
5% 6% 13%
Fig 12. Percentage value held by tree species in Wrexham according to CAVAT
analysis.
The land use type containing the highest structural value of trees is cemeteries, with the
total value of trees within this land use type estimated at approximately £1.1 million in
the plots sampled. This is 37% of the structural value held by Wrexham’s trees (Fig 13)
and is made even more notable by the fact that only one cemetery plot was sampled
(Table 2).
Agriculture Water/wetland Golf course
Institutional
1%Valuing Wrexham’s Urban Forest
Table 2. Structural value of trees encountered in different land use types in
plots and the number of plots containing each land use type
Land use type Structural value Value/% No. of
(in plots)/£ plots§
Cemetery 1 117 986 37.2 1
Park 829 857 27.6 58
Residential (single family) 508 608 16.9 93
Residential (multiple family) 228 359 7.6 10
Commercial/Industrial 110 070 3.7 28
Institutional 53 318 1.8 15
Agriculture 28 756 1.0 7
Water/wetland 24 111 0.8 1
Vacant 14 581 0.5 7
Other 2 321 0.1 1
Golf course 0 0.0 1
§
Number of plots containing this land use type
CTLA Valuation
According to CTLA valuation, which does not take into account the health or amenity
value of trees, Wrexham’s urban forest is worth approximately £0.9 billion. This is the
cost of replacing Wrexham’s urban forest should it be lost.
Avoided Surface Water Runoff
The infrastructure required to remove surface water from towns and cities is costly and
in some areas of the UK can be overwhelmed by large storm events, where surface
water may not be removed quickly enough. This can result in flooding and damage.
Trees can intercept rainwater, retaining it on their leaves and absorbing some into their
tissues for use in respiration. The trees in Wrexham intercept approximately 278 000 m3
of water per year, the equivalent of Wrexham Waterworld’s main pool being filled 556
times. Based on the standard local rate charged for sewerage5, this would save £460
000 in sewerage charges.
Sycamore intercepts the most water, removing 81 000 m3 of water per year, worth
£135 000 in sewerage charges (Fig 14).
5
This value is based on the 2013 household standard volumetric rate per cubic metre charged by
Dwr Cymru and does not include standing charges or special discounts. This rate is stated as
£1.6554 per m3 (Dŵr Cymru, 2013)
20 | Technical Report | Rumble, Rogers, Doick, and Hutchings | June 2014Valuing Wrexham’s Urban Forest
90 150
Value/thousands of £
80
thousands of m3
Avoided runoff/
70 120
60
90
50
40
60
30
20 30
10
0 0
Tree species
Fig 14. Avoided surface water runoff provided by urban trees in Wrexham
(columns) and their associated value in avoided sewer costs (diamonds)
Air Pollution Removal
Air pollution is harmful to human health and can lead to a decrease in the quality of
ecosystems (Table 3). The centre of Wrexham has some of the highest deaths caused by
respiratory problems in Wales, with 111 respiratory related deaths for every 100 0006
people (www.healthmapswales.wales.nhs.uk, 2010). This puts Wrexham in the top 20%
of Welsh areas for respiratory related deaths. However, respiratory diseases can be
caused by a number of factors in addition to air pollution, including smoking.
6
Standardised by age
21 | Technical Report | Rumble, Rogers, Doick, and Hutchings | June 2014Valuing Wrexham’s Urban Forest
Table 3. Urban pollutants, their health effects and causes (air-quality.org.uk)
Pollutant Health effects Source
NO2 Shortness of breath Fossil fuel combustion, predominantly power
Chest pains stations (21%) and cars (44%)
O3 Irritation to respiratory tract, particularly for From NO2 reacting with sunlight
asthma sufferers
SO2 Impairs lung function Fossil fuel combustion, predominantly
Forms acid rain that acidifies freshwater and burning coal (50%)
damages vegetation
CO Long term exposure is life threatening due to Carbon combustion under low oxygen
its affinity with haemoglobin conditions i.e. in petrol cars
PM10 and Carcinogenic Varied causes, cars (20%) and residential
PM2.5 Responsible for 10 000 premature deaths per properties (20%) major contributors
year
Trees and shrubs can mitigate the impacts of air pollution by directly reducing airborne
pollutants as well as reducing local temperatures. Trees may absorb pollutants through
their stomata, or simply intercept pollutants that are retained on the plant surface
(Nowak et al., 2006). This leads to year-long benefits, with bark continuing to intercept
pollutants throughout winter (Nowak et al., 2006). Plants also reduce local temperatures
by providing shade and by transpiring (Bolund and Hunhammar, 1999), reducing the
rate at which air pollutants are formed, particularly ozone (i.e. O3) (Jacob and Winner,
2009). However, trees can also contribute to ozone production by emitting volatile
organic compounds (VOC’s) that react with pollutants (Lee et al., 2006). Research
indicates that, of the trees present in Wrexham, common oak, goat willow, poplar and
sessile oak have the potential to worsen air quality through release of VOC’s (Stewart
et al., (2002). i-Tree takes the release of VOC’s by trees into account to calculate the net
difference in ozone production and removal.
It is estimated that 60 tonnes of airborne pollutants per year are removed by Wrexham’s
urban forest, including NO2, ozone, SO2, CO and PM10 and PM2.5. Ozone showed the
greatest reduction by urban trees, demonstrating that although trees can increase ozone
levels by producing VOC’s, they remove far more than they produce. In addition, as
ozone is produced by trees only in warm temperatures, the cooling benefits of trees
reduce ozone production overall (Nowak et al., 2000).
The pollution removed from the atmosphere can be valued to aid interpretation of this
data. In both the USA and the UK, pollutants are valued in terms of the damage they
cause to society. However, these are valued by slightly different methods in each
country, using United States Externality Costs in the US (USEC) and United Kingdom
Social Damage Costs (UKSDC) in the UK. The UK method does not cover all airborne
pollutants (Table 4).
22 | Technical Report | Rumble, Rogers, Doick, and Hutchings | June 2014Valuing Wrexham’s Urban Forest
Using the US valuation system, £637 500 worth of pollutants are removed by urban
trees in Wrexham (Fig 15). Using the UK system, which only accounts for four
pollutants, £669 500 worth of pollutants and removed from the atmosphere (Table 4).
Table 4. Amount of each pollutant removed by the urban forest and its associated value. Dashes
denote unavailable values. USEC denotes United States Externality Cost, UKSDC denotes United
Kingdom Social Damage Cost
Pollutant Mean amount US value per USEC value/£ UK value per UKSDC value/£
removed/tonnes tonne/£ tonne/£
per annum
CO 1.51 1714 2585 - -
NO2 8.45 12066 101 984 955 (NOx) 8072
O3 33.97 12066 410 072 - -
PM10 11.91 8056 95 877 55 310 (PM) 658 300
PM2.5 2.66 8056 21 443 55 310 (PM) -
SO2 1.87 2954 5 531 1633 (SOx) 3059
40 450
Value/thousands of £
35 400
Amount removed/t
30 350
300
25
250
20
200
15
150
10 100
5 50
0 0
CO NO2 O3 PM10 PM2.5 SO2
Pollutant
Fig 15. Mean pollutants removed by urban trees in Wrexham (columns) and
their associated value (diamonds) as valued using the USA externality
system. PM10 excludes particles smaller than 2.5 microns.
The volume of airborne pollutants varied over the year, with a seasonal pattern evident
in the removal of ozone, which was removed in higher volumes during the summer (Fig
16). This is because ozone, a product of the combination of NOx and VOC’s, is more
prevalent in warm temperatures (Sillman and Samson, 1995). This also creates a diurnal
pattern, with ozone levels higher during the day than at night (Nowak, 2000). PM2.5
removal peaked in January due to high concentrations of the pollutant and thus more
pollutant to accumulate on the trees and low wind speeds, reducing the amount of
pollutant suspended into the air.
23 | Technical Report | Rumble, Rogers, Doick, and Hutchings | June 2014Valuing Wrexham’s Urban Forest
(a) (b)
3 0.6
Amount removed/tons
Amount removed/tons
2 0.4
1 0.2
0 0
Jan Mar May Jul Sep Nov Jan Mar May Jul Sep Nov
Month Month
PM10 NO2 SO2 PM2.5 CO
(c)
8
Amount removed/tons
6
4
2
0
Jan Mar May Jul Sep Nov
Month
O3
Fig. 16. Monthly pollutants removed by Wrexham’s urban trees. (a) PM10’s and NO2, (b) SO2, PM2.5’s and
CO and (c) O3
Carbon Storage and Sequestration
Wrexham’s trees store a total of 65 773 tonnes of carbon in their wood, with sycamore
storing the greatest amount (Fig 17). This is equivalent to the annual carbon emissions
of 48 234 homes7 and equates to 85% of the carbon emissions produced by Wrexham
County Borough households8. Alternatively, this is the equivalent of the annual CO2
emissions of 109 015 cars9, more than (162%) the annual emissions of all cars
estimated to be owned in the county borough10.
Similarly to leaf area, carbon storage depends not only on the number of trees present,
but also their characteristics. In this case, the mass of a tree is extremely important, as
larger trees store more carbon in their tissues. Common oak (Quercus robur), for
7
Based on an average UK household emission of 5 tonnes of CO2 per year in 2009 (Palmer and
Cooper, 2011)
8
Conservative estimate based on the number of households recorded in the 2011 census for the
entire county borough (ONS, 2011)
9
Based on average emissions of 163g/CO2 per km (DVLA 2013), with the average UK car
travelling 13 572km per year (DVLA, 2010)
10
Based on the average UK car ownership figure of 0.5 cars per person (DVLA, 2013), multiplied
by the population of Wrexham County Borough (ONS, 2011)
24 | Technical Report | Rumble, Rogers, Doick, and Hutchings | June 2014Valuing Wrexham’s Urban Forest
example, only makes up 3.5% of Wrexham’s tree population, but it is responsible for
storing 7.3% of the total carbon stored in trees, the second largest contribution by a
single species.
28000 80000
24000
Carbon stored/t
20000 60000
Frequency
16000
40000
12000
8000Valuing Wrexham’s Urban Forest
800 80000
Carbon sequestration/t per year
600 60000
Frequency
400 40000
200 20000
0 0
Species
Carbon sequestered/tons Tree frequency
Fig 18. Carbon sequestered per year by the ten trees with highest rates, along with their
frequency. Error bars denote standard error of the mean (SEM).
Plane and common oak were the only identified trees to be losing carbon on an annual
basis, losing 1.2 and 1.3 tonnes per year respectively. This signifies that these
populations are dominated by ageing trees that emit more carbon than they sequester.
Aside from these species, dead trees produce around 590 tonnes of carbon per year in
Wrexham. However, it must be noted that deadwood provides valuable habitat for a
variety of species, some with economic importance, as do the large trees that are losing
carbon, such as oak and plane (Hagan and Grove, 1999; Kennedy and Southwood,
1984). It is, therefore, important to retain this component of the urban forest.
The carbon stored and sequestered by trees can be valued within the framework of the
UK government’s carbon valuation method (HM Treasury, 2011). This is based on the
cost of fines imposed if the UK does not meet carbon reduction targets and is split into
two sets of values, traded and non-traded. Traded values are for industries covered by
the European Union Emissions Trading Scheme. Tree stocks do not fall within this
category so non-traded values have been used. There are also three sets of carbon
value, low, central and high, that reflect the fact that carbon value could change due to
outer circumstances, such as fuel price.
Based on the central scenario for non-traded carbon, it is estimated that the current tree
stock would be storing £24.9 million worth of carbon by 2050, assuming that the
structure of the forest in terms of species assemblage, tree size and population size
remains unchanged (Fig 19). Table 5 outlines values from now until 2050 for all three
value scenarios, again assuming no changes to Wrexham’s urban forest occur in this
time.
26 | Technical Report | Rumble, Rogers, Doick, and Hutchings | June 2014Valuing Wrexham’s Urban Forest
£30M
£24,924,223
£25M
Carbon value/million £
£20M
£15M
£10M
£5M
£-
2013 2018 2023 2028 2033 2038 2043 2048
Year
Fig 19. Value of stored carbon within Wrexham’s urban forest during the period 2013-
2050. These values are based on the UK governments non-traded carbon valuation
method and assume the structure of the urban forest remains the same over time.
Table 5. Non-traded values for the carbon stored in Wrexham’s trees in all three valuation scenarios.
These values are based on the UK governments non-traded carbon valuation method and assume the
structure of the urban forest remains the same over time
Non-traded unit value (£/tCO2e) Value of discounted stored tCO2e
Net Stored Net
Stored Discount
Year sequestered C sequestered Low Central High Low Central High
C (t) rate
C (t) (tCO2e) C (tCO2e)
2013 65773 1329 241168 4874 29 57 86 3.5 £6,993,862 £13,746,557 £20,740,419
2014 67102 1329 246042 4874 29 58 87 3.5 £6,885,488 £13,770,976 £20,656,464
2015 68432 1329 250917 4874 30 59 89 3.5 £7,009,792 £13,785,925 £20,795,717
2016 69761 1329 255791 4874 30 60 90 3.5 £6,895,859 £13,791,718 £20,687,577
2017 71091 1329 260665 4874 30 61 91 3.5 £6,781,314 £13,788,672 £20,569,987
2018 72420 1329 265540 4874 31 62 93 3.5 £6,888,552 £13,777,103 £20,665,655
2019 73749 1329 270414 4874 31 63 94 3.5 £6,769,477 £13,757,325 £20,526,802
2020 75079 1329 275289 4874 32 64 95 3.5 £6,864,826 £13,729,652 £20,379,952
2021 76408 1329 280163 4874 32 65 97 3.5 £6,741,855 £13,694,394 £20,436,249
2022 77738 1329 285038 4874 33 66 99 3.5 £6,825,930 £13,651,860 £20,477,789
2023 79067 1329 289912 4874 33 67 100 3.5 £6,699,667 £13,602,354 £20,302,021
2024 80396 1329 294786 4874 34 68 102 3.5 £6,773,089 £13,546,179 £20,319,268
2025 81726 1329 299661 4874 34 69 103 3.5 £6,644,107 £13,483,630 £20,127,737
2026 83055 1329 304535 4874 35 70 105 3.5 £6,707,500 £13,415,000 £20,122,501
2027 84384 1329 309410 4874 36 71 107 3.5 £6,764,237 £13,340,578 £20,104,815
2028 85714 1329 314284 4874 36 72 108 3.5 £6,630,322 £13,260,644 £19,890,967
2029 87043 1329 319159 4874 37 73 110 3.5 £6,677,982 £13,175,477 £19,853,459
2030 88373 1329 324033 4874 37 74 111 3.5 £6,542,674 £13,085,347 £19,628,021
2031 89702 1329 328907 4874 41 81 122 3.5 £7,101,485 £14,029,762 £21,131,247
2032 91031 1329 333782 4874 44 88 132 3.5 £7,463,359 £14,926,718 £22,390,077
27 | Technical Report | Rumble, Rogers, Doick, and Hutchings | June 2014Valuing Wrexham’s Urban Forest
Non-traded unit value (£/tCO2e) Value of discounted stored tCO2e
Net Stored Net
Stored Discount
Year sequestered C sequestered Low Central High Low Central High
C (t) rate
C (t) (tCO2e) C (tCO2e)
2033 92361 1329 338656 4874 47 95 142 3.5 £7,805,545 £15,777,166 £23,582,711
2034 93690 1329 343531 4874 51 102 153 3.5 £8,291,046 £16,582,091 £24,873,137
2035 95020 1329 348405 4874 54 109 163 3.5 £8,591,702 £17,342,509 £25,934,211
2036 96349 1329 353280 4874 58 116 173 3.5 £9,029,729 £18,059,458 £26,933,501
2037 97678 1329 358154 4874 61 122 184 3.5 £9,290,844 £18,581,687 £28,024,839
2038 99008 1329 363028 4874 65 129 194 3.5 £9,683,599 £19,218,220 £28,901,820
2039 100337 1329 367903 4874 68 136 204 3.5 £9,907,229 £19,814,458 £29,721,687
2040 101667 1329 372777 4874 72 143 215 3.5 £10,256,977 £20,371,496 £30,628,473
2041 102996 1329 377652 4874 75 150 225 3.5 £10,445,218 £20,890,435 £31,335,653
2042 104325 1329 382526 4874 78 157 235 3.5 £10,618,124 £21,372,378 £31,990,503
2043 105655 1329 387401 4874 82 164 246 3 £10,965,740 £21,931,479 £32,897,219
2044 106984 1329 392275 4874 85 171 256 3 £11,164,650 £22,460,649 £33,625,298
2045 108313 1329 397149 4874 89 178 266 3 £11,480,247 £22,960,494 £34,311,750
2046 109643 1329 402024 4874 92 184 277 3 £11,652,488 £23,304,977 £35,084,122
2047 110972 1329 406898 4874 96 191 287 3 £11,937,348 £23,750,349 £35,687,696
2048 112302 1329 411773 4874 99 198 297 3 £12,084,126 £24,168,253 £36,252,379
2049 113631 1329 416647 4874 103 205 308 3 £12,339,565 £24,559,329 £36,898,895
2050 114960 1329 421522 4874 106 212 318 3 £12,462,112 £24,924,223 £37,386,335
28 | Technical Report | Rumble, Rogers, Doick, and Hutchings | June 2014Valuing Wrexham’s Urban Forest
Habitat Provision
Trees and shrubs provide valuable habitat and food for many animal and plant species,
from non-vascular plants, such as moss, to insects, birds and mammals. Two examples
are included in this section to highlight some of the organisms trees can support. For a
broader review see Alexander, Butler and Green (2006).
Pollinating insects provide ecosystem services by pollinating food crops, but they are
under threat from a number of pressures including land-use intensification and climate
change (Vanbergen and the Insect Pollinators Initiative, 2013). Providing food sources
could alleviate this. Twenty nine of the tree and shrub genus’s found in Wrexham
support pollinating insects (RHS, 2012) (Table 6).
Table 6. Species/genus encountered in Wrexham that are beneficial to pollinators (RHS, 2012)
Genus/ Genus/
Tree/shrub Species Season Tree/shrub Species Season
Acer Genus Spring Malus Genus Spring
Acer campestre Species Spring Malus domestica Species Spring
Acer platanoides Species Spring Pieris Genus Spring
Acer pseudoplatanus Species Spring Prunus Genus Spring
Berberis Genus Spring Prunus avium Species Spring
Berberis darwinii Species Spring Prunus domestica Species Spring
Berberis thunbergii Species Spring Prunus laurocerasus Species Spring
Buddleja davidii Species Summer Prunus spinosa Species Spring
Buxus Genus Spring Pyracantha Genus Summer
Buxus sempervirens Species Spring Pyrus Genus Spring
Calluna vulgaris Species Summer Ribes Genus Spring
Cornus Genus Spring, Summer Rosa Genus Summer
Cotoneaster Genus Spring, Summer Rosa canina Species Summer
Cotoneaster horizontalis Species Summer Rubus Genus Summer
Crataegus monogyna Species Spring, Summer Rubus fruticosus Species Summer
Fatsia japonica Species Autumn Salix Genus Spring
Hebe Genus Spring, Summer Salix caprea Species Spring
Hydrangea Genus Summer Sorbus Genus Summer
Ilex Genus Spring, Summer Sorbus aucuparia Species Summer
Ilex aquifolium Species Spring, Summer Tilia Genus Summer
Laurus Genus Summer Tilia cordata Species Summer
Ligustrum Genus Summer Tilia platyphyllos Species Summer
Ligustrum sinense Species Summer Viburnum Genus Winter
Lonicera Genus Winter Weigela Genus Summer
Mahonia spp. Genus Winter, Spring
29 | Technical Report | Rumble, Rogers, Doick, and Hutchings | June 2014Valuing Wrexham’s Urban Forest
Insect herbivores are another large group supported by trees. Some specialise on one or
two species of tree, whilst other are generalists that benefit from multiple tree and shrub
species. Of the species found in Wrexham, native oaks and willows support the highest
number of different species (Fig 20). Beetles, however, are best supported by a single
species, Scots pine (Table 7), highlighting that though some species have fewer insects
associated with them, they are extremely important for certain groups.
Non-natives associate with fewer species than native trees as they have had less time to
form associations with native organisms (Kennedy and Southwood, 1984). In addition,
some native species form few insect herbivore associations due to their high level of
defence mechanisms, yew being a good example (Daniewski et al., 1998). These species
support wildlife in other ways, for example by supplying structural habitat. Yew, for
example, is an important species for organisms that require dead wood (buglife.org.uk,
2013).
Other Willow
Beech, species, 463 (5 spp), 450
common, 98
Hazel,
common, 106 Oak (2 spp),
423
Elm (2 spp),
124
Alder, 141 Birch (2 spp),
334
Scots pine,
Poplar Hawthorn,
172
(4 spp), 189 common, 209
Fig 20. The number of insect species that associate with trees found in the Wrexham
survey12. Where multiple species are denoted in brackets, insect species associate with
more than one host (e.g. Common oak and sessile oak support the same insect species or
the literature does not separate these two species). Data from Kennedy and Southwood
(1984).
12
NB: Insect data is not available for all species encountered in Wrexham; only species studied in
Kennedy and Southwood (1984) are included. Some closely related species such as apples and
pears have not been included because data was not available for the domesticated species.
30 | Technical Report | Rumble, Rogers, Doick, and Hutchings | June 2014Valuing Wrexham’s Urban Forest
Table 7. Species of insect supported by trees encountered in Wrexham, sorted by total number. Bold
species names denote non-native species. Brightest green boxes denote the highest number of species
supported in that insect group, red the lowest and middle values are represented by a gradient between
the two (“Total” column shows gradient in order). Data from Southwood (1961) and Kennedy and
Southwood (1984)
Wasps/ Moths/
Species Total Beetles Flies True bugs Other
sawflys butterflies
Willow (5 spp) 450 64 34 56 104 162 9
Oak (2 spp) 423 67 7 43 70 189 9
Birch (2 spp) 334 57 5 30 42 179 9
Hawthorn 209 20 5 23 12 124 8
Poplar (4 spp) 189 32 14 34 29 69 3
Scots pine 172 87 2 10 11 41 6
Alder 141 16 3 18 21 60 9
Elm (2 spp) 124 15 4 22 6 55 11
Hazel 106 18 7 3 8 48 6
Beech 98 34 6 7 2 41 4
Norway spruce 70 11 3 14 10 22 1
Ash 68 1 9 7 7 25 9
Rowan 58 8 3 6 6 33 2
Lime (2 spp) 57 3 5 7 2 25 8
Hornbeam 51 5 3 10 2 28 2
Field maple 51 2 5 10 2 24 6
Sycamore 43 2 3 10 2 20 5
Larch 38 6 1 6 5 16 1
Sweet chestnut 11 1 0 1 0 9 0
Holly 10 4 1 2 0 3 0
Yew 6 0 1 1 0 3 1
Risks of Pests and Disease
Pests and diseases are a serious threat to urban forests. Severe outbreaks have
occurred within living memory, with Dutch Elm Disease killing approximately 30 million
trees in the UK (Webber, 2010). In addition, climate change may make some pest and
disease outbreaks more likely (Forestry Commission, 2014a). Assessing the risk pests
and diseases pose to urban forests is, therefore, of paramount importance.
Acute Oak Decline
Acute oak decline (AOD) affects mature trees (>50 years old) of both the native oak
species (Quercus robur, known as common oak and Quercus petraea - sessile oak). Over
the past three to four years there have been a growing number of reports of oak trees
with symptoms of stem bleeding, a potential sign of AOD. The incidence of AOD in
Britain is unquantified at this stage but estimates put the figure at a few thousand
affected trees. The condition appears to be most prevalent in the Midlands and the South
East. Acute Oak Decline poses a threat to 5.9% of Wrexham’s urban forest.
31 | Technical Report | Rumble, Rogers, Doick, and Hutchings | June 2014Valuing Wrexham’s Urban Forest
Asian Longhorn Beetle
Asian Longhorn Beetle (ALB) is a major pest in China, Japan and Korea where it kills
many species of broadleaved trees. In America, ALB has established populations in
Chicago and New York where the damage to street trees is high with felling, sanitation
and quarantine are the only viable management options. We can expect extensive
damage to urban trees if the ALB establishes in the UK.
Fig 21. MacLeod et al., (2002). Ecoclimatic Indices for countries across
Europe. An index of >32 is suggested to be suitable for ALB.
In March 2012 an ALB outbreak was found in Maidstone, Kent. The Forestry Commission
and Fera removed 2 166 trees from the area to contain this outbreak and no further
outbreaks have been reported in the UK. MacLeod et al., (2002) modelled climatic
suitability for outbreaks based on outbreak data from China and the USA and suggested
that CLIMEX (the model used) Ecoclimatic Indices of >32 could be suitable habitats for
ALB. This research suggests that Wrexham County may not be suitable for ALB (Fig 21).
Recent reports by the Forestry Commission (2014b) suggest that the climate in Wales
may be suitable for ALB, but that the major threat in the UK is to South-East England
and the South coast.
If an ALB outbreak occurred in Wrexham it would pose a significant threat to 41.1% of
Wrexham’s trees.
32 | Technical Report | Rumble, Rogers, Doick, and Hutchings | June 2014Valuing Wrexham’s Urban Forest
The known host tree and shrub species include:
Acer spp. (maples and sycamores) Populus spp. (poplar)
Aesculus spp. (horse chestnut) Prunus spp. (cherry, plum)
Albizia spp. (Mimosa, silk tree) Robinia pseudoacacia (false
Alnus spp. (alder) acacia/black locust)
Betula spp. (birch) Salix spp. (willow, sallow)
Carpinus spp. (hornbeam) Sophora spp. (Pagoda tree)
Cercidiphyllum japonicum (Katsura Sorbus spp. (mountain ash/rowan,
tree) whitebeam etc)
Corylus spp. (hazel) Quercus palustris (American pin
Fagus spp. (beech) oak)
Fraxinus spp. (ash) Quercus rubra (North American
Koelreuteria paniculata red oak)
Platanus spp. (plane) Ulmus spp. (elm)
Chalara Dieback of Ash
Ash dieback, caused by the fungus Chalara fraxinea, targets the ash trees Fraxinus
excelsior (common ash) and Fraxinus angustifolia (narrow leaved ash). Young trees are
particularly vulnerable and can be killed within one growing season of symptoms
becoming visible. Older trees take longer to succumb, but still die from the infection
after several seasons. C. fraxinea was first recorded in the UK in 2012 in
Buckinghamshire and has now been reported across the UK, including in urban areas.
Two confirmed cases have been reported in nurseries Wrexham, as of March 2014. Ash
dieback poses a threat to 4.8% of Wrexham’s urban forest.
Emerald Ash Borer
There is no evidence to date that the emerald ash borer (EAB) is present in the UK, but
the increase in global movement of imported wood, wood packaging and dunnage poses
a significant risk of its accidental introduction. EAB is present in Russia and is moving
West and South at a rate of 30-40km per year, perhaps aided by vehicles (Straw et al.,
(2013). EAB has had a devastating effect in the USA due to its accidental introduction
and could add to pressures already imposed on ash from diseases such as C. fraxinea,
Ash dieback. Emerald Ash borer poses a potential future threat to 4.8% of Wrexham’s
urban forest.
Gypsy Moth
Gypsy moth (GM), Lymantria dispar, is an important defoliator of a very wide range of
trees and shrubs in mainland Europe, where it periodically reaches outbreak numbers. It
can cause tree death if successive, serious defoliation occurs on a single tree. A small
colony has persisted in northeast London since 1995 and a second breeding colony was
found in Aylesbury, Buckinghamshire in the summer of 2005. Aside from these disparate
colonies, GMs range in Europe does not reach as far West as the UK. Some researchers
suggest that the climate in the UK is currently suitable for GM should it arrive here and
that it would become more so if global temperatures rise (Vanhanen et al., 2007).
However, the spread of gypsy moth in the USA has been slow, invading less than a third
of its potential range (Morin et al., 2005). If GM spread to Wrexham, it would pose a
threat to 33.9% of Wrexham’s urban trees.
33 | Technical Report | Rumble, Rogers, Doick, and Hutchings | June 2014You can also read