Appendix 5 Country Profile - The Vanuatu beef industry - Country profile The Vanuatu beef industry
←
→
Page content transcription
If your browser does not render page correctly, please read the page content below
Increasing the productivity and market options of smallholder beef cattle farmers in Vanuatu

                                      Appendix 5

         Country Profile - The Vanuatu beef industry

The following report was prepared within the ACIAR funded Small Research Activity, Research
opportunities for smallholder beef cattle systems in Pacific island countries (LS-2018-102). The
report was co-authored by two members of the LPS-2014-037 project research team (Waldron
and Quigley). The report draws on research findings from the current project and builds on
previously available information to provide the most comprehensive recent review of the Vanuatu
beef sector. It is included as an Appendix to the current report to provide a description of the
broader operating environment and context within which the LPS-2014-037 research activities
were undertaken.
The Vanuatu Beef Industry

                         Country report for ACIAR Project LS/2018/102

    Research opportunities for smallholder beef cattle systems in Pacific island
                                                         countries

                                       Simon Cole, Farm Consulting Services, Fiji

       Scott Waldron and Simon Quigley, School of Agriculture and Food Sciences, The University of
                                            Queensland 1

                                                         March 2019

1
  To be cited as Cole, S., Waldron, S. and Quigley, S. (2019). The Vanuatu Beef Industry. A country report for ACIAR Project
LS/2018/102 “Research opportunities for small-holder beef cattle systems in Pacific island countries”.

                                                                                                                         Page | i
Contents
Contents ........................................................................................................................................................ ii
Figures .......................................................................................................................................................... iv
Tables ........................................................................................................................................................... iv
Acronyms ...................................................................................................................................................... v
1 Introduction .......................................................................................................................................... 1
1.1 Background to report .................................................................................................................... 1
1.2 Summary ....................................................................................................................................... 1
2 Underlying structures ........................................................................................................................... 2
3 Beef industry statistics .......................................................................................................................... 4
3.1 Macro indicators ........................................................................................................................... 4
3.2 Provincial breakdown ................................................................................................................... 5
3.3 Distribution of slaughter by processing plant ............................................................................... 7
3.4 Other farm and herd characteristics ............................................................................................. 7
3.5 Split between commercial and subsistence sales ......................................................................... 9
3.6 Meat consumption...................................................................................................................... 10
3.7 Beef trade.................................................................................................................................... 10
4 Vanuatu beef cattle value chains ........................................................................................................ 11
4.1 Industry map ............................................................................................................................... 11
4.2 Chain margins.............................................................................................................................. 12
5 Abattoirs.............................................................................................................................................. 16
5.1 Market standards and pricing ..................................................................................................... 16
5.2 Carcass weight range .................................................................................................................. 17
5.3 Canning ....................................................................................................................................... 18
5.4 Price comparisons ....................................................................................................................... 18
5.5 Utilisation of by products............................................................................................................ 18
5.6 Operational issues....................................................................................................................... 19
6 End user markets ................................................................................................................................ 19
6.1 Breakdown of domestic consumption ........................................................................................ 19
6.2 Custom transfer .......................................................................................................................... 20
6.3 Domestic consumption ............................................................................................................... 20
Page | ii6.4 Rural butcheries and rural consumption .................................................................................... 21
6.5 The sale of weaner cattle ............................................................................................................ 23
6.6 Formal urban markets................................................................................................................. 23
6.7 International markets ................................................................................................................. 24
7 Industry inputs and support................................................................................................................ 24
7.1 Equipment supplies..................................................................................................................... 24
7.2 Breeding stock............................................................................................................................. 25
7.3 Pastures and fertilisers................................................................................................................ 25
7.4 Extension ..................................................................................................................................... 26
7.5 Commodity associations and industry bodies ............................................................................ 26
7.6 Trade agreements ....................................................................................................................... 26
7.7 Access to finance......................................................................................................................... 27
7.8 Training ....................................................................................................................................... 27
7.9 Biosecurity................................................................................................................................... 28
7.10 Research ...................................................................................................................................... 29
7.11 Transport..................................................................................................................................... 29
7.12 Health and disease surveillance .................................................................................................. 29
7.13 Pasture and weed control ........................................................................................................... 30
7.14 Data systems, market data, and sector organisations ................................................................ 30
8 Government policy.............................................................................................................................. 31
8.1 Agricultural policy ....................................................................................................................... 31
8.2 Livestock and beef plans ............................................................................................................. 32
8.3 Beef specific policies and plans ................................................................................................... 33
8.4 Acts that impact the livestock sector .......................................................................................... 34
9 Vanuatu development assistance ....................................................................................................... 35
9.1 European Development Fund 11 ................................................................................................ 35
9.2 ACIAR........................................................................................................................................... 36
9.3 NZ MFAT...................................................................................................................................... 36
9.4 The Pacific Community ............................................................................................................... 36
10 References .......................................................................................................................................... 38
Page | iiiFigures
Figure 1: Map of Vanuatu ..............................................................................................................................................3
Figure 2: Trend in cattle distribution by province in Vanuatu. ......................................................................................6
Figure 3: Number of cattle slaughtered by abattoir and combined in Vanuatu............................................................7
Figure 4: Value of cattle sales from large-holder (commercial) and small-holder (subsistence) sector in Vanuatu ...10
Figure 5: Vanuatu beef value chain .............................................................................................................................12
Figure 6: Value achieved per head by sector in different value chains .......................................................................14
Figure 7: Farmer value as percent of total price in different value chains ..................................................................14
Figure 8: Value received by farmers in different value chains ....................................................................................15
Figure 9: Total receipts for cattle in local markets excluding export receipts .............................................................15
Figure 10: Trends in carcass weights of cattle slaughtered in abattoirs in Port Vila and on Santo .............................17
Figure 11: Percentage of beef consumption by local markets ....................................................................................19
Tables
Table 1: Macro Economic indicators, Vanuatu 2011-18 ................................................................................................4
Table 2: Vanuatu GDP by sector ....................................................................................................................................4
Table 3: Livestock numbers, 2011-26 ............................................................................................................................5
Table 4: Meat output, 2011-16......................................................................................................................................5
Table 5: Cattle numbers and Holdings from different sources ......................................................................................5
Table 6: Cattle numbers and households by province ..................................................................................................6
Table 7: Scale of holdings by province in Vanuatu ........................................................................................................7
Table 8: Farm holdings and infrastructure ....................................................................................................................8
Table 9: Herd structure by class of cattle ......................................................................................................................8
Table 10: Number of cattle paddocks holdings by tenure.............................................................................................8
Table 11: National herd structure by breed ..................................................................................................................9
Table 12: Indication of cattle sold by value at sale across the provinces in Vanuatu....................................................9
Table 13: Meat consumption(kg per capita) ...............................................................................................................10
Table 14: Vanuatu exports (AU$ 1,000s) .....................................................................................................................11
Table 15: Vanuatu beef exports (Tonnes) ...................................................................................................................11
Table 16: Vanuatu meat imports (Tonnes) ..................................................................................................................11
Table 17: Value per head received along different value chains .................................................................................13
Table 18: Comparative hot carcass weight and carcass price V/kg .............................................................................17
Table 19: Comparative international meat prices (2015) ............................................................................................18
Table 20: Comparative live cattle prices on different islands (2015) ..........................................................................20
Table 21: Rural butcheries in Vanuatu ........................................................................................................................21
Page | ivTable 22: Comparative meat prices in different markets (Vt/kg) 2015 .......................................................................22
Table 23: Meat consumption patterns in rural areas of Vanuatu ...............................................................................22
Table 24: Registered urban butcheries (2016) ............................................................................................................24
Table 25: List of Acts affecting the Vanuatu beef industry ..........................................................................................35
Acronyms
ACIAR - Australian Centre for International Agricultural Research
AI - Artificial Insemination
AU$ - Australian Dollar
AUSAID - Australian Aid
BSE - Bovine Spongiform Encephalitis
BVD - Bovine Venereal Disease
EDF - European Development Fund
ET - Embryo Transfer
EU – European Union
EUR - Euros
FOA – Food and Agriculture Organisation, United Nations
FAO Stat - Food and Agricultural Organisation Statistics
FJD - Fiji Dollar
FMD - Foot and Mouth Disease
GDP - Gross Domestic Product
Ha - Hectare
J Export - Japanese Export
JICA - Japanese International Co-operation Agency
JTWC - Joint Technical Working Group
kg - Kilogram
LDC - Least Developed Country
LIWG - Livestock Industry Working Group
LSU – Livestock Unit
MAB - Meat Advisory Board
MALFFB - Ministry of Agriculture Livestock Fisheries Forests and Bio Security
MLC - Meat and Livestock Corporation
Page | vMTSP – Medium Term Strategic Plan
MTTCINVB - Ministry of Tourism, Trade, IndustryCommerce and ni-Vanuatu Business
NBV - National Bank on Vanuatu
NDS – National Development Strategy
NIP – National Indicative Programme
NLF – National Livestock Framework
NTDC - National Trade Development Committee
NZ - New Zealand
NZMFAT - New Zealand Ministry of Foreign Affairs and Trade
ODA - Overseas Development Aid
OIE - World Organisation for Animal Health
OPSP - Overarching Productive Sector Policy
PACER - Pacific Agreement for Closer Economic Relations
PHAMA - Pacific Horticultural & Agricultural Market Access
PIC – Pacific Island Country
PNG - Papua New Guinea
PPP – Public Private Partnerships
R Butcher - Rural Butcher
SATEC - Support for Agricultural Technology Project
SCPP - Small-holder Cattle Purchase Scheme
SMP - Santo Meat Packers
SPC - The Pacific Community / Secretariat of The Pacific Community
U Butcher - Urban Butcher
V Export - Vila Export
VAC - Vanuatu Agricultural Collage
VADB - Vanuatu Agricultural Development Bank
VAL - Vanuatu Abattoirs Limited
VARTC - Vanuatu Agricultural Research and Technical Centre
VLB – Vanuatu Livestock Board
VCCI - Vanuatu Chamber of Commerce and Industry
VT – Vatu (VT$1 = AU$0.012 on 01-Jul-2018)
Page | vi1 Introduction
1.1 Background to report
The beef cattle sector plays a significant role in livelihoods in many Pacific island countries (PICs).
Contributions of the industry vary by locality but includes contributions to localised consumption and
ceremonies, rural incomes, downstream industry and trade. Benign tropical systems in the region are well
suited to cattle production, and under-utilised resources are available to boost productivity in some
countries. There is robust demand for beef in a diverse range of markets.
Cattle production is however stagnant in nearly all countries and small-holder segments of the industries
are under-performing. All national governments are interested in building or revitalising beef industries
to various degrees. The sector is under-invested and under-researched, and policy is not necessarily
informed by detailed, household-level or up-to-date research.
Against this background, ACIAR commissioned a Small Research Agreement to investigate research
opportunities for small-holder beef cattle systems in the Pacific namely Fiji, Vanuatu, Samoa, Tonga, and
the Solomon Islands.
This report provides a brief descriptive analysis of the Vanuatu beef industry. The research was conducted
in 2018 using the following methods:
• A review of existing published or unpublished literature on the Vanuatu beef industry;
• Statistics collected from international databases, from government sources and from industry;
• A scoping trip, including interviews and field visits with government agencies, extension; and
education providers and the commercial sector (small-holder and large holder cattle producers,
abattoirs, butchers, input suppliers).
This country report on Vanuatu will be combined with country reports from Fiji, Samoa, Tonga and the
Solomon Islands to identify priority areas of research in beef cattle production and marketing in the Pacific
that falls within the remit of ACIAR.
1.2 Summary
Vanuatu has the reputation as the biggest and best beef producer in the Pacific. Although estimates vary,
Vanuatu has perhaps 115,000 cattle. This national cattle herd is slightly smaller than Fiji’s but, unlike Fiji,
is a beef rather than dual-purpose dairy and draught herd. Perhaps half of the cattle are held by small-
holders, predominantly under coconuts or in the bush and the largest provincial herd is located on the
island of Espiritu Santo in the north of the country.
Unlike other Pacific island countries, Vanuatu is a beef exporter with two large export-accredited abattoirs
and another new modern plant, which supply vibrant butcher and hotel markets. All abattoirs are
operating well under-capacity. This is partly because perhaps half of all cattle (mainly from small-holders)
are used for ceremony, but also because of excessive capacity in the processing sector, and limits to cattle
supply.
Page | 1The limits are not necessarily from resource endowments. Many areas and households have land that can
be used and improved for cattle production, and labour that can be diverted to cattle if small-holders can
see incentives and have technical and management support. Such support was available until the late
1980s / early 1990s and lies dormant amongst many government staff and farmers. While the
environment has changed, some farmers, including the younger generation, are moving into off-farm
work and lucrative crops like kava, other farmers are interested in improving livelihoods through cattle.
After years of neglect a suite of projects are supported by the Government of Vanuatu, including in small-
holder research (Quigley et al, 2014) that can scale up through the government extension and training
programs, assistance for semi-commercial producers (NZMFAT) and overall industry development (EDF-
11).
2 Underlying structures
The Republic of Vanuatu is an archipelago of around 83 islands and numerous islets with a population of
approximately 260,000 (Figure 1). The total land area is 12,000 km², which represents just 1.4% of the
total area, including sea (CIA, 2018).
Vanuatu is an agricultural society where most of the population (over 80%) is involved in farming and
fishing either for subsistence, livelihood, or cash income. This population resides in rural areas and
food/cash production activities continue to employ the greatest percentage of the labour force.
Whilst at least 70% of the population resides in rural areas and depends on agriculture for their livelihoods,
productivity in the traditional crop sectors is low. The productive sector has therefore yet to realise its full
potential to generate broad-based growth, increased employment income, and the overall well-being for
the nation . The increasing monetization of the economy and the lack of economic opportunities in the
rural areas have accelerated urban drift particularly of young people leading to rising urban
unemployment (Government of the Republic of Vanuatu, 2012).
The main resource for agriculture and livestock activities is land allocated through custom systems, which
also determine the role of men and women within the community and subsequently their participation in
the income generating activities.
The Ministry of Agriculture, Livestock, Forestry, Fisheries, and Biosecurity (MALFFB) and the Ministry of
Trade, Tourism, Industry, Commerce and n-Vanuatu Business (MTTICNVB) both have jurisdiction over
agricultural and rural development.
Vanuatu was admitted to the group of Least Developed Countries (LDCs) in 1985 mainly due to very high
vulnerability to natural disasters (UNEAPD, 2018). It was due to leave the LDC grouping in 2017, as it had
met indicators that would allow it to “graduate” to Developing Country status, but this was delayed by
the impact of Tropical Cyclone Pam in 2015.
The impact of Cyclone Pam can be seen in the decline in GDP growth in 2015 -0.8% (Table 1). This indicates
the extreme vulnerability of Vanuatu to natural disasters where it currently ranks amongst the most
vulnerable nations (BEH & RUB, 2018 & UNWRI, 2018). The response from the international community
and on overseas development aid actually created a cash surplus in 2015. Ongoing expenditure in 2016
and 2017 give a better indication of the true cost of recovery. Currently the eruption of volcanos on Ambae
Page | 2has blanketed many pastures and water sources in ash with the evacuation of the island resulting in
livestock and crops left untended.
After the devastation of Cyclone Pam in 2015, Vanuatu’s GDP growth rate has increased to nearly 4%.
However, whilst government’s income has remained relatively stable in its growth, government
expenditure in the aftermath of the cyclone has more than doubled.
Figure 1: Map of Vanuatu
Source: Nations Online (2018)
Page | 3Table 1: Macro Economic indicators, Vanuatu 2011-18
Indicator 2011 2012 2013 2014 2015 2016 2017 2018
GDP growth rate (%, constant price) 1.2 1.8 2.0 3.6 -0.8 3.3 3.6 3.9
Inflation Rate 0.7 1.4 1.4 0.8 2.5 2.1 2.8 3.2
Govt revenue billion Vt 15.8 15.8 16.3 18.6 25.8 24.8 25.5
Govt expend billion Vt 17.3 16.9 16.4 18.0 20.0 33.9 41.3
Govt balance billion -1.5 -1.2 -0.2 -0.6 5.6 -9.1 -15.8
Net ODA received USD million 91 102 91 100 187
Reserves month imports 4.5 4.6 4.8 5.0 6.3
Source: UNCDP (2017)
The GDP of Vanuatu is broken down in Table 2. Agriculture contributes 21% to total GDP. Cropping makes
up 85% of this total with livestock, fisheries, and forestry contributing the balance. The largest contributor
to GDP is the service industry. Tourism, although impacted by the cyclone and by damage caused to the
runway at the airport in Port Vila, offers considerable opportunities for growth.
Table 2: Vanuatu GDP by sector
2008 2009 2010 2011 2012 2013 2014 2015 2016 %
2016
GDP at current prices million Vatu
Crop 10,119 10,183 11,154 13,009 14,201 14,947 15,501 15,428 15,669 85%
Animal 1,309 1,532 1,724 1,928 2,632 2,636 2,952 1,007 1,081 6%
Forest 613 703 758 798 794 877 979 940 984 5%
Fishing 399 449 439 482 488 485 501 513 527 4%
Agriculture 12,440 12,868 14,075 16,216 18,115 18,945 19,932 17,887 18,260 21%
(sub-total)
Industry 5,435 7,082 8,364 6,887 5,455 5,962 6,429 8,899 9,141 10%
Services 37,971 39,886 41,686 43,803 44,291 46,045 47,889 50,741 54,724 63%
Tax 8,394 8,193 6,947 7,611 7,637 8,087 8,432 8,718 8,489 10%
Less bank service -2,651 -2,910 -3,160 -3,644 -3,082 -3,236 -3,574 -3,448 -3,364 -4%
Total 61.607 65.119 67.912 70.873 72.415 75.803 79.109 82.798 87.250
Percentage change in GDP current prices
All Agriculture 12.2 3.4 9.4 15.2 11.7 4.6 5.2 -10.3 2.1
Animal 25.9 17.1 12.5 11.8 36.5 0.1 12.0 -65.9 7.4
Source: VNSO (2016b)
3 Beef industry statistics
Statistical anomalies and differences in sources and methods, make it difficult to quantify structures and
trends in the industry, though some attempt to do so is made in this section.
3.1 Macro indicators
Statistics reported by the United Nations, Food and Agriculture Organisation (FAO) suggest that cattle
numbers in Vanuatu have plateaued in recent years, with modest increases in other livestock (Table 3;
see also Section 4.2). However, turnoff/slaughter numbers reported by FAO have declined in in the same
period, along with beef production, with little change in average carcass weights (Table 4) which look
realistic.
Page | 4Table 3: Livestock numbers, 2011-26
Head 2011 2012 2013 2014 2015 2016
Cattle 170,000 172,000 173,000 175,000 176,693 174,745
Chickens 700,000 700,000 750,000 800,000 835,000 840,000
Goats 24,000 25,000 25,000 26,000 26,916 28,222
Pigs 92,000 93,000 94,000 94,000 94,096 98,106
Source: FAOStat (2016)
Table 4: Meat output, 2011-16
2011 2012 2013 2014 2015 2016
Pig Tonnes 3,468 3,519 3,519 3,523 3,518 3,645
Carcass Kg 51 51 51 51 51 51
Turnoff 68,000 69,000 69,000 69,000 68,813 71,474
Cattle Tonnes 3214 3390 3289 2987 2904 2922
Carcass Kg 210 203 188 188 190 191
Turnoff 15,305 16,700 17,495 15,888 15,284 15,298
Hides Tonnes 508 508 508
Carcass Kg 35 34 33
Turnoff 14,500 15,000 15,200
Chickens Tonnes 900 914 1008 1067 1106 1106
Carcass Kg 1 1 1 1 1 1
Turnoff 900,000 914,000 1,008,000 1,067,000 1,106,000 1,106,000
Goat Tonnes 45 47 47 50 52 54
Carcass Kg 10 10 10 10 10 10
Turnoff 4,500 4,700 4,700 5,000 5,229 5,407
Source: FAOStat (2016b)
It is important to note, however, that FAO cattle production statistics are likely to be over-reported.
Various statistics on cattle numbers, some of which distinguish between small-holder and estate
producers, are shown in Table 5. The data conforms to widespread perceptions that cattle numbers in
Vanuatu have declined since a peak around 2000.
Table 5: Cattle numbers and Holdings from different sources
Small-holder Estate Total Source
1971 11,000 99,000 110,000 Cattle survey reported in Macfarlane (1983)
1983 32,000 68,000 100,000 Vanuatu 1st Agricultural Census 1983, reported in
Macfarlane (1983)
1993 40,000 80,000 120,000 Vanuatu 2nd Agricultural Census 1993
2002 40,500 94,500 135,000 Estimate partial cattle count from household surveys
2009 105,051 2009 National Population and Housing Census (VNSO, 2009)
2016 115,540 2016 Mini Census (VNSO, 2016)
2016 27,990 62,010 90,000 2016 Livestock Survey Data (NZMFAT 2017)
3.2 Provincial breakdown
Cattle statistics are disaggregated by province in the most recent 2016 Mini-Census (Table 6). The most
significant province is Sanma which includes the island of Santo. The main island in the Malampa province
Page | 5is Malekula. Torba province is the most remote group in the north of the country including the island of
Vanualava. The largest human population is on the island of Efate in the Shefa group.
The lowest number of cattle are recorded in the Tafea group which includes the volcanic island of Tana
where beef prices, held up by a strong tourist industry, are almost double the national average. The
government has sought to distribute breeding cattle to this province.
It might be assumed from statistics on the number of cattle per holding that the beef industry in Sanma
and Torba is relatively commercialized and, conversely, that Malampa and Shefa are uncommercialised.
However, there is not necessarily a close relationship between scale of production and levels of
commercialisation.
Table 6: Cattle numbers and households by province
Region Number of cattle Number of households Average number of cattle
with cattle per household
Vanuatu 115,540 14,017 8
Urban 24,692 712 35
Rural 90,848 13,305 7
Torba 2,076 543 4
Sanma 42,213 3,707 11
Penama 9,626 2,147 4
Malampa 15,315 3,500 4
Shefa 40,145 2,098 19
Tafea 6,165 2,022 3
Source: VNSO (2016)
The trend in all provinces except Shefa is downwards which is believed to be correct (Figure 2). The
number of cattle recorded in Sanma in the 2007 Census is recorded at 91,000 but 48,000 in Tomoyan
(2018). The growth in Shefa seems exaggerated and Tomoyan concludes that “there is an issue of
consistency in livestock data” (2018).
60000
2009 2016
50000
40000
30000
20000
10000
0
Torba Sanma Penama Malampa Shefa Tafea
Figure 2: Trend in cattle distribution by province in Vanuatu.
Source: VNSO (2007) and Tomoyan (2018)
Page | 6The scale of household production is shown in Table 7. As could be expected most cattle producers are
small scale, with 1-20 head.
Table 7: Scale of holdings by province in Vanuatu
Region Total 1-20 21-40 41-60 61-80 81-100 >100
Vanuatu 14,017 13,222 462 123 38 82 90
Urban 712 521 72 24 17 45 33
Rural 13,305 12,701 390 99 21 37 57
Torba 543 525 15 3 0 0 0
Sanma 3,707 3,354 211 59 15 31 37
Penama 2,147 2,103 31 6 2 1 4
Malampa 3,500 3,400 73 16 2 3 6
Shefa 2,098 1,839 117 36 18 46 42
Tafea 2,022 1,923 15 3 1 1 1
Source: VNSO (2016)
3.3 Distribution of slaughter by processing plant
Most of the cattle are slaughtered in Port Vila where slaughter numbers remain reasonably constant.
There seems to be a steady decline in the number of cattle slaughtered on Santo which results in an overall
national decline in the number of cattle slaughtered. Combined slaughter numbers are shown in Figure 3.
Vila Santo Total
20000
18000
16000
14000
12000
10000
8000
6000
4000
2000
0
2009 2010 2011 2012 2013 2014 2015 2016
Figure 3: Number of cattle slaughtered by abattoir and combined in Vanuatu
Source: Tomoyan (2018)
3.4 Other farm and herd characteristics
Other characteristics of cattle farms and herds are available based on the 2007 census (Tables 8, 9, 10, 11,
and 12). While these data are likely to have changed overtime, they never the less provide a snapshot of
the structures of the industry.
Page | 7Table 8: Farm holdings and infrastructure
Criteria Number or Percent
Total cattle 174,152
Paddocked cattle head 124,955
Open grazed head 49,197
Area of paddocks Ha 53,607
Holdings 17,176
Holdings with Paddocks 34%
Holdings with Stockyards 10%
Holdings with water 22%
Holdings improved grass 88%
Holdings with Fences 95%
Holdings that sold cattle 24%
Source: VNSO (2007)
Herd structures are shown in Table 9. Cows account for 40% of the herd, but calves account for just 16%,
suggesting a very low calving rate (of 40%). This is carried over into the number of heifers and steers which
account for 30% of the total herd, but when taken over a two-year growing period represents 15% in each
annual age-group. The proportion of bulls at 13% is high and probably reflects poor management in the
castration of male cattle.
Table 9: Herd structure by class of cattle
Class Age Percent
Calves 16%
Bulls 1 year and above 13%
Steer 1 year and above 15%
Heifers Less 2.5 years 16%
Cows 36%
Cows 2.5 years no calf 4%
Source: VNSO (2007)
Regarding land tenure, most cattle farmers have recognized tenure on their farms. It is however often
very difficult to transfer ownership to new entities, which may inhibit farm expansion or efficiencies (Table
10).
Table 10: Number of cattle paddocks holdings by tenure
Tenure Total Owned Rented Custom Free
Torba 312 278 19 15
Sanma 3,191 2,560 11 205 415
Penama 1,379 1,162 11 78 128
Malampa 1,115 972 19 86 38
Shefa 802 673 18 50 61
Tafea 1,909 684 68 474 683
Total 8,706 6,326 128 913 1339
Source: VNSO (2007)
Statistics class most cattle as “local” (Table 11), but with high rates of cross-breeding with improved
breeds, both Bos taurus and Bos indicus, across the country.
Page | 8Table 11: National herd structure by breed
Breeds Charolais Brahman Limousine Illawara Simental Angus Hereford Local
Torba 15% 1% 0% 0% 0% 0% 1% 83%
Sanma 23% 18% 3% 0% 0% 0% 1% 55%
Penama 11% 2% 0% 0% 0% 0% 1% 86%
Malampa 18% 2% 1% 1% 1% 1% 0% 76%
Shefa 17% 4% 3% 2% 1% 0% 2% 72%
Tafea 17% 5% 6% 1% 0% 7% 1% 63%
Total 18% 7% 3% 1% 0% 2% 1% 69%
Source: VNSO (2007)
Anecdotal evidence and observation (Cole et al., 2015) suggests that about 75% of cattle are sold fully
grown. About 25% of cattle are sold as young stock for fattening on other properties. There has also
considerable growth in the sale of weaner cattle recent years in to service demand for veal, especially in
Port Vila. It is possible that uncastrated bulls are being sold before they become sexually mature. The
price of weaner beef in the retail butchers is lower than the price of mature beef. The distribution of prices
recorded from the 2007 agricultural census is shown in Table 12.
Table 12: Indication of cattle sold by value at sale across the provinces in Vanuatu
VT20,000
Torba 0% 22% 78%
Sanma 5% 15% 80%
Penama 3% 23% 74%
Malampa 7% 35% 58%
Shefa 7% 16% 77%
Tafea 4% 13% 83%
Total 5% 19% 76%
Source: VNSO (2007)
3.5 Split between commercial and subsistence sales
Figure 4 indicates the scale of the large-holder sector against sales from the subsistence sector, confirming
the dislocation of small-holder farmers from commercial opportunities. There is a significant fall in the
value of cattle sold from the commercial sector in recent years which is in line with other indicators. This
figure probably underestimates the value of beef consumed in the subsistence markets particularly as
most cattle are in holdings of less than 20 head.
Page | 9Commercial Subsistence
3,000
2,500
Value, VT million
2,000
1,500
1,000
500
0
2009 2010 2011 2012 2013 2014 2015 2016
Figure 4: Value of cattle sales from large-holder (commercial) and small-holder (subsistence) sector in
Vanuatu
Source: Tomoyan (2018) based on VNSO (2016)
3.6 Meat consumption
Vanuatu consumes just below the world average for total meat consumption (Table 13) and note that
these figures represent “revealed consumption”, derived from (inconsistent) data on beef supply, net
trade, and population. Interestingly pork, not beef, is the main meat consumed, and the amount of poultry
consumed is well below world average.
Table 13: Meat consumption(kg per capita)
Meat consumption per capita Beef Pork Poultry Mutton Other Total
Vanuatu 11.0 16.1 6.5 0.2 0 33.8
World Average 9.5 14.9 12.5 1.9 0 38.7
Australia 43.5 23 39.3 14.3 1.1 121.2
Source: SCRIBD (2018)
3.7 Beef trade
Vanuatu is renowned as the only Pacific country with the volume, quality and infrastructure to be able to
export beef. This is partly because ownership of a large plant in Santo (Santo Meat Packers, SMP) which
facilitates integration to Japanese markets. Other export markets include the Solomon Islands and PNG
(World Trade Map, 2018).
Trade statistics reported in international databases (Tables 14 and 15) suggest that exports volume along
with cattle numbers and slaughter have declined. It is important to note however that export data is
incomplete and the total exports of 228 tonnes is likely to be under-stated. A tonnage of around 1,100
tonnes was reported in Cardno (2014). The Vanuatu Meat Inspection Service reports that production at
the two main abattoirs (Vanuatu Abattoirs Limited, VAL and SMP) of 2,300 tonnes.
Page | 10Table 14: Vanuatu exports (AU$ 1,000s)
HS code Product label Vanuatu exports to the world (AU$1,000)
2013 2014 2015 2016 2017
0201 Meat of bovine fresh 3 219 1,171 676
0202 Meat of bovine frozen 2,163 2,999 2,718 1,368 1,075
0206 Edible offal of bovine 25 32 20 3 3
Source: World Trade Map (2018)
Table 15: Vanuatu beef exports (Tonnes)
HS code Product label Vanuatu's exports to world Volume (tonnes)
2013 2014 2015 2016 2017
0201 Meat of bovine fresh 0 18 111 70
0202 Meat of bovine frozen 417 585 411 192 158
0206 Edible offal of bovine 5 7 3 0 0
Source: World Trade Map (2018)
The main meat import into Vanuatu is chicken meat, most likely from the United States and Australia.
Table 16: Vanuatu meat imports (Tonnes)
Product code Product label Vanuatu's imports from world (tonnes)
2013 2014 2015 2016 2017
0201 Meat of bovine fresh 1 1 0 0 0
0202 Meat of bovine frozen 52 34 1 2 13
0206 Edible offal of bovine 0 53 0 2
0203 Meat of swine, fresh, chilled or frozen 38 22 21 106 84
0204 Meat of sheep or goats, fresh, chilled or frozen 68 71 33 22 14
0207 Meat and edible offal of fowls 1,875 1,831 2,397 2,972 3,477
0210 Meat and edible offal, brined 4 15 7 27 32
Source: World Trade Map (2018)
4 Vanuatu beef cattle value chains
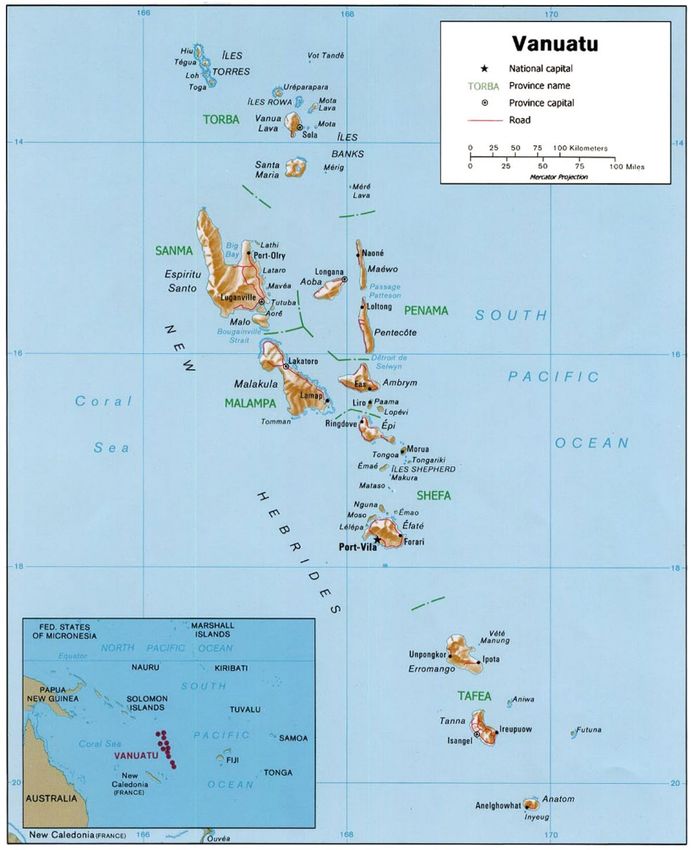
4.1 Industry map
The industry map (Figure 5) shows the volume and value of beef through the value chain to the various
markets and end uses. Note this map is based on much higher stock numbers 190,000 than is accepted in
more recent data. However, the distribution of cattle and value chains remains valid.
An estimated 197,000 total cattle yield, per annum, about 4,360 tonnes of beef, and an additional 275
tonnes is imported. Extrapolation of data suggests a turnoff rate of 11%. Most beef derives from the
commercial and semi-commercial sectors. The small-holder sector contributes just 460 tonnes to the
formal abattoir sector, and more indirectly through cattle sold for fattening to commercial farmers. Most
of the turnoff from the small-holder sector is informal and used especially in ceremonies. There is very
little reliable information about the real extent of this trade and volume. This extends to estimating the
Page | 11actual size of the national herd. Without a detailed census it is very difficult to accurately define the scale
of the informal sector.
All meat in the formal sector is processed through three abattoirs operating to international standards.
Two abattoirs in Santo are privately owned. The abattoir on Efate is owned under a partnership between
the Government and the private sector. These abattoirs are vertically integrated, with the abattoir owners
also owning a significant portion of the cattle farms. Cattle killed for the domestic markets are supplied in
quarters to butcheries. Beef for export is vacuum packed and exported as end use cuts.
Figure 5: Vanuatu beef value chain
Source: Cardno (2014) Note that in the light of recent surveys (including VNSO, 2016), volumes of product
are over-stated, but it is argued that the channels and the proportions remain valid.
4.2 Chain margins
The complete Vanuatu beef cattle value chain consists of several sub-chains with different end markets
(Cole et al, 2015). The first four chains identified below represent lower value markets. The last three
chains represent the higher value markets.
The different value chains identified, defined by end markets, include:
Page | 12• Custom: The sale or transfer of live cattle to the custom market 2.
• Cull: The slaughter sale of culled 3 cattle as bagged meat in rural areas.
• Bush Kill: The slaughter and sale of prime cattle into the domestic rural market.
• Rural Butchers: The slaughter and sale of meat by rural butchers in shop facilities.
• Urban Butchers: The sale of cattle through middle men into urban butcher shops.
• Port Vila Export: The sale of boxed meats for export through the Port Vila abattoir.
• Japan Export: The sale of boxed meats to through the Santo abattoir to Japan.
Costs in each step of the different chains are reported inTable 17 and Figures 6, 7, 8 and 9:
• Cattle cost
• Live animal transport
• Killing fee 4
• Abattoir margin
• Freight of meat
• Wholesale retail margins
The price data included below in Table 16 was collected in 2015 through interviews with chain actors on
field trips to Malekula, Epi, Malo and Santo, and visits to retailers in Port Vila, Santo and destination
countries. Values in Table 17 represent the value of a typical animal in each category.
Table 17: Value per head received along different value chains
Custom Cull Bush kill Rural Urban Export Japan
butcher butcher export
Retail 280 400 17,056 29,762 105,318 105,318
Freight 4,760 6,800 544 598 5,386 5,386
Abattoir 24,816 24,816
Kill fee 14,960 14,960 14,960
Live transport 10,000 10,000 10,000
Farmer 14,000 14,000 20,000 30,000 49,400 34,000 34,000
Total 14,000 18,760 27,200 47,600 104,720 194,480 238,680
Source: Cole et al (2015)
These data are presented graphically below (Figure 6). The custom and rural markets have very short value
chains with virtually no cash charges and the farmer retains virtually the entire value of each animal. Other
chains are more complex, with extra costs in the longer value chains. The revenues to farmers are
seemingly highest in these long chains, but it is important to note that costs for the farmer are also likely
to be higher. Either way, retail margins earned in the export markets dwarfs returns earned in country. A
killing fee has been calculated based on the declared charge at the abattoirs in Vanuatu. The abattoir
margin is the difference between the stated killing fee and the price earned from selling meat across the
border.
2 Custom, alternatively kastom, is a deep-rooted cultural concept which can be roughly translated as meaning
'customary' or 'traditional'
3
Unproductive typically breeding animals
4The charge from the abattoir for slaughtering a beast charged as V, per kg carcass weight.
Page | 13Figure 6: Value achieved per head by sector in different value chains
Source: Cole et al. (2015)
The actual percentage of the retail value retained by the farmers is described in Figure 7 below. As the
complexity of the value chain grows the percentage returned to the farmer lessens.
Farmer Percent in Retail Value
100%
100% 75% 74% 63% 47% 17% 17%
80%
83% 83%
60%
40% 53% Farmer
37% Other
20% 26%
25%
0%
0%
Figure 7: Farmer value as percent of total price in different value chains
Source: Cole et al. (2015)
As the percentage of value returned to the farmer declines in the longer value chains, the actual cash
value received by the farmers increases (Figure 8). By removing all downstream value chain costs (off-
farm costs) the markets that give the highest return to the farmers are identified. Unfortunately, small-
holder farmers do not access these higher value markets.
The urban butcher market gives the highest value per animal because they are prepared to pay a higher
price per kilogram (VT270/kg as opposed to VT200/kg for the same sized animal).
Page | 14Figure 8: Value received by farmers in different value chains
Source: Cole et al. (2015)
Figure 9 excludes the large export margins making it easier to observe the values received by different
actors along the value chain in the local markets.
Figure 9: Total receipts for cattle in local markets excluding export receipts
Source: Cole et al. (2015)
Small-holders are typically excluded from these higher value-markets because of poor quality, small
numbers of cattle, poor logistics and geographical distance. Whilst the percentage received by farmers
increases in the lower value shorter value-chain markets, the actual value for each animal received
declines. Small-holder and particularly remote island farmers operate in a parallel market system
unintegrated with the main commercial markets.
Page | 15The sale to urban butchers offers the biggest returns to farmers. Quality (carcass conformation and age /
tenderness) is required in this market. This market is under-supplied and therefore offers a premium price.
Rural butchers offer the best return for remote farmers on outer islands but are not geographically
accessible to many farmers who therefore resort to the lower value custom and bush kill markets. Local
price is defined by the abattoir class-weight schedules.
The Japanese export market seems to offer the farmer a higher return, but the additional costs of
achieving the required extra weight, together with transport costs, probably means the net returns to the
farmer are the same.
A high proportion of value and costs are accrued in downstream sectors of value chains. There are high
intermediary costs in Vanuatu including transport, processing and margins. Additionally, up to 83% of the
value of exported beef is accrued overseas and does not enter Vanuatu. This limits that margins that can
be paid to farmers.
5 Abattoirs
5.1 Market standards and pricing
Abattoirs have the key role in the industry and impact all sectors of the beef sector. They are the only
processors for export beef and provide an essential slaughter service for the local formal industry. As such
they set the price and standards for the entire beef sector, including the informal sector. There is currently
minimal demand for lower quality beef in the export or urban markets. As a result, prices for culled or
light animals are heavily discounted.
The two longer established abattoirs in Vanuatu, SMP on Santo and VAL in Port Vila, are vertically
integrated, with major cattle suppliers who are also majority owners of the plant. The main market for
the abattoirs is the sale of quality grass fed beef into high value markets. The product is sold butchered
and boxed clearly identifying the Grass Fed Vanuatu Brand. No attempt is made to market this as an
organic product.
Abattoir prices are set as per a published schedule. These values have not changed little in the last nine
to eleven years and have therefore declined in real terms. The last major shift came when Japan agreed
to relax the requirement for Vanuatu beef to pay 37% duty on entry into the country, at which time the
price to farmers increased by 10%, with only minor changes thereafter.
The high liveweight requirement for cattle entering the high value Japanese market is also a barrier for
small-holders who do not have access to the improved pastures to reach these weights before the cattle
are too old.
The oligopoly status of the abattoirs, as the only link to the export and higher value markets, allows them
set prices that are not responsive to normal market forces.
Page | 16Table 18: Comparative hot carcass weight and carcass price V/kg
Carcass weight kg Vila price Santo price Butcher price
Steer 270+ 190
Steer 240 190 170 250 to 270
Heifer 240 150
Steer 200 130
Heifer 200 130
Cow 240 140 130
Cow 150 80
Bulls 260 115
Weaners 100 300 to 350
Source: Published price schedule from Vanuatu Abattoirs Ltd (VAL) and Santo Meat Packers (SMP) in
May/June 2015.
It is also important to note that another abattoir has entered the market in Santo in 2015. Wong Sze Shing
(WSS) aimed to attract cull cows to supply his own canning factory. The owner also provides credit lines
to farmers and sees the abattoir as a way to secure his credit. The abattoir operates on a simple price
schedule based on class of animal and liveweight. The abattoir pays transport costs. Prices are higher than
SMP for lighter animals which do not meet the Japanese export standards, but lower for heavier animals,
particularly steers. The abattoir also provides a service kill function for other local butcheries.
5.2 Carcass weight range
There is a distinct difference in the weight range at each abattoir. The Santo abattoir is owned by and
specifically targets the Japanese market which requires heavier cattle. This is reflected in the price
schedule. Small-holder farmers are not able to reach these weights giving an opening for the WSS abattoir
on Santo.
The weight of cattle entering the abattoir in Port Vila is declining steadily indicating either a shortage of
cattle or an increase in the sale of weaners (this might amount to the same problem) (Figure 10).
Trends in Carcass Weights
Vila Santo
300
250
200
150
100
50
0
2009 2010 2011 2012 2013 2014 2015 2016
Figure 10: Trends in carcass weights of cattle slaughtered in abattoirs in Port Vila and on Santo
Page | 17Source: Tomoyan (2018)
5.3 Canning
Previous attempts at canning have failed because even the value of low-quality beef is still higher in
Vanuatu than the massed and low value off cuts, waste products, trimmings and offal of much larger
industries offshore that are typically used in low value canned beef. These products are sold into highly
price conscious markets such as the Pacific islands. It is noted that most of the tinned meat is labelled as
tinned “meat” rather than “beef” because it likely contains proteins from other cheaper animal sources
than beef.
It is understood that import duty was previously applied to the canning material which undermined the
competitiveness of the business.
Local canned meat production was previously impacted by an unfavourable duty regime, though it is
understood this is now resolved. The regional canned beef market is very competitive 5 with many
products labelled as corned meat 6 as opposed to beef.
5.4 Price comparisons
Beef prices have increased in most countries over the last 10 years and accelerated in 2015. (The
Australian price collapsed with the 2018 drought) Buoyant prices were not reflected in the Vanuatu
industry, which reduces the profitability and investment in upstream sectors. A comparison with
competitor markets and of key industry costs is tabulated below (Table 19).
Table 19: Comparative international meat prices (2015)
Vanuatu Fiji Australia
Steer Cull Steer Cull Young steer Heavy steer Cull
Hook price Vt/kg 190 90 307 265 403 225 152*
Service killing fee Vt/kg 50/64 50/64 19 19
Industry levy 8 8 1 1
Rump steak Vt/kg 1,000 300 1590 901 1427
Export value Vt/kg 560 Japan 599**
520 PNG
1 FJD = Vt53 1 AU$ = Vt84
Source: Fiji Meat Industry Board, South Pacific Butchery Fiji, Woolworths Australia. New World Fiji, (Cole et
al, 2015), * NSW price is up to VT302; ** Boneless export to Japan; Note: Australia does not have duty free
entry to Japan worth 37% to Vanuatu.
5.5 Utilisation of by products
The VAL abattoir in Port Vila produces meat meal which is used by the local chicken and pig farmers. The
(SMP) plant on Santo dumps its waste, which is becoming an environmental issue. Hides are salted and
exported from Port Vila but not Santo. Meat meal is processed and sold to small livestock farmers in Port
Vila. In Santo, this is dumped. Pluck (heart, kidneys, tripe and liver) is not included in the weighed carcass
5 Foods Pacific Fiji.
6 Corned Meat can include meat sources other than beef.
Page | 18weight of the animal (no value returned to the farmer) and is sold by the abattoirs to the butchers at an
extra cost.
5.6 Operational issues
The capital requirements of building an abattoir make it difficult for new players to enter this sector of
the industry. Supply is short and declining. None of the three established abattoirs are operating at full
capacity, which increases the overhead cost of the operation. The SMP abattoir on Santo used to kill 800
cattle per month but is now operating at a fraction of this and only slaughtering about once per week.
Both abattoirs are completely transparent in the recording and payment of killing sheets and invoices,
which is under the oversight of the meat inspectors. Scales are regularly tested.
The operational costs of abattoirs in Vanuatu are relatively expensive with low throughput, cheaper but
less efficient labour systems, high electricity costs (though it is understood that the Santo abattoir gets a
concessional rate) and high freight costs. It is beyond the scope of this study to analyse if the operational
costs are efficient.
6 End user markets
Cattle are marketed through a number of channels broadly divided into informal markets (custom transfer,
household consumption and rural butchers) and formal markets (urban centres butcheries and export).
For simplicity the dividing line between these two chains would be the use of a slaughter house. That
aside, some of the rural butchers that sell cattle slaughtered outside formal slaughter facilities have a very
sophisticated and professional presentation of meat.
6.1 Breakdown of domestic consumption
Domestic consumption is broken down as per Figure 11.
Consumption by Market %
50
0
Figure 11: Percentage of beef consumption by local markets
Source: Cole et al (2015)
Page | 196.2 Custom transfer
Custom (or lafet) markets operate throughout Vanuatu and typically trade or supply smaller cattle and
cull cows indicating a disconnect with the formal markets. Custom markets consist of individuals buying
or contributing cattle for custom functions such as funerals and weddings. If cattle are purchased for such
purposes, the trade is conducted live at the farm, which minimises transport costs for the farmer or
purchaser. Cattle are often slaughtered and taken either as quarters or cut up meat to the function.
Pricing in the custom market varies considerably from island to island (Table 20) and reflect:
• Abattoir prices.
• The lack of demand for cull cows or poor-quality cattle in the formal sector.
• The lack of formal marketing logistics and infrastructure.
• The price of transport between custom production areas, population centres and the abattoirs.
• Supply and demand in each location.
• A need for quick cash by the farmer.
Table 20: Comparative live cattle prices on different islands (2015)
Island Steer Cull Weaner Freight to Vila Freight on Island
Efate 40,000 18,000 2,000 2,000
Malo 20,000 8,000 16,000
Epi 35,000 28,000 15,000 6,500 5,000
Santo 35,000 18,000 18,000 Own 6,000
Hired 10,000
Tanna 100,000
Malekula 30,000 15,000 18,000 10,000
Source: Cole et al (2015)
6.3 Domestic consumption
Because of the large and perishable nature of beef as a consumption item, ceremonies provide an
important distribution channels for beef. However, households sometimes demand beef outside of
ceremonies, for which other informal localised channels have evolved. In some cases, a farmer might
slaughter an animal at home, save sufficient for household consumption, and sell the surplus meat to the
local community. In other cases, a household might slaughter an animal and then sell to others in the
community as a business venture. This market channel is largely intermittent and ad hoc. The further a
farmer has to travel to sell the surplus meat, the more it costs. With very little access to electricity there
is minimal opportunity to store the meat. The price of meat doubles where electricity is available to store
the product.
There is little differentiation in the quality of the meat sold in this market, with fillet and brisket mixed
and sold at the same price. Consumers in this market have low purchasing power. The low prices reflect
the same combination of factors in the custom market. Even in the informal sector, there is often a
separation of production areas from population centres (East Malo production and West Malo population).
This results in high transport costs into the domestic consumption market, which reduces return to
farmers.
Page | 20You can also read