Verication of Anatolian Earthquake on February 6, 2023 Prediction using seismic coecient analysis
←
→
Page content transcription
If your browser does not render page correctly, please read the page content below
Veri cation of Anatolian Earthquake on February 6, 2023 Prediction using seismic coe cient analysis Amir Shamgani M.Sc, Shahid Beheshti University Hamid Saffari ( h_saffari@sbu.ac.ir ) Shahid Beheshti University Research Article Keywords: Eastern Anatolian fault, spatial b-value anomalies, temporal b-value anomalies, seismicity parameters, earthquake prediction Posted Date: March 17th, 2023 DOI: https://doi.org/10.21203/rs.3.rs-2678885/v1 License: This work is licensed under a Creative Commons Attribution 4.0 International License. Read Full License Additional Declarations: No competing interests reported.
1      Verification of Anatolian Earthquake on February 6, 2023 Prediction
 2                        using seismic coefficient analysis

 3                                                    Amir Shamgani1, Hamid Saffari2*

 4
                                              1
 5                                                M.Sc., Shahid Beheshti University, Tehran, Iran

 6                                                         a.shamgani@mail.sbu.ac.ir
      2,*
 7          Associate Professor, Department of Structure & Earthquake, Faculty of Civil, Water & Environmental Engineering, Shahid

 8                                                      Beheshti University, Tehran, Iran

 9                                                             h_saffari@sbu.ac.ir

10                                                           *corresponding author

11

12   Abstract
13       A number of large and deadly earthquake occurred on February 6, 2023, in the vicinity of the
14   Eastern Anatolian Fault, which caused a lot of financial and human losses. This fault runs from
15   the south to the northeast of Turkey, which forms a tectonic boundary between the Arabian plate
16   and the Anatolian plate. Due to the fact that the Arabian plate is moving towards the north and
17   the Anatolian plate is moving towards the west, the mechanism of this fault is strike-slip. In this
18   article, the spatial and temporal changes of seismic parameters in an area with coordinates of 35
19   to 40 degrees longitude and 35.5 to 39 degrees latitude, which includes the Eastern Anatolian
20   fault, have been investigated. To this purpose, seismic data from 01/01/1990 to 02/21/2023 with
21   a moment magnitude greater than or equal to 3.5 (Mw≥3.5) was considered. This research
22   showed that before large earthquakes occurred on February 6, 2023, the seismicity parameter b
23   clearly decreased. This was happened in the about 6 months before the earthquakes so the b-
24   value had significantly decreased from 3.98 to 0.69. Using spatial and temporal analysis of
25   seismic coefficients besides other pre-detectors such as changes in the amount of stress, wave
26   velocity, gravity characteristics, electric resistance and magnetic field can lead to better
27   prediction of hazardous earthquakes.
28   Keywords: Eastern Anatolian fault, spatial b-value anomalies, temporal b-value anomalies,
29   seismicity parameters, earthquake prediction
30

31   1. Introduction
32       Earthquakes are one of the natural phenomena that have threatened human life since the
33   distant past. The occurrence of large earthquakes in the south of Turkey has caused many human
34   and financial losses. The Eastern Anatolian fault is an active fault in Turkey, which is the border
35   between the Arabian and the Anatolian plates. The Arabian plate is moving towards the north,
36 and the mechanism of the Eastern Anatolian fault is strike-slip. The strike of this fault is running
37 from eastern to south-central Turkey. The investigation of the seismicity of the region shows that
38 destructive earthquakes have occurred in this region for centuries. Development of cities and
39 population centers in the 20th and 21st centuries in the vicinity of this fault caused many
40 buildings and lifelines to be destroyed due to February 6, 2023 earthquake. Since they were
41 located in the fault zone, accelerations were applied several times higher than the seismic codes
42 to them and were destroyed.
43 The East Anatolian Plateau, is a part of the Alpine-Himalayan orogen which has a 200 km
44 wide, E-W trending. This area has been surrounded by two peripheral mountains of the
45 Anatolian Peninsula (Yılmaz and Yi 2022). The plateau is covered by thick, interbedded
46 Neogene volcanic and sedimentary rocks (Yilmaz et al. 1997). New geological and geophysical
47 data indicate the existence of an ophiolite mélange accretion complex under the topsoil of eastern
48 Anatolia. Deposition of cover units began during the closure of the Neo-Tethys Ocean, located
49 between the Pontidian Arcs to the north, and continental debris drifted southward from the
50 Arabian Plate (Yılmaz and Yi 2022).
51
52 The surrounding orogenic belt experienced different orogenic evolution. The East Anatolian
53 Orogenic Belt was formed during the late stages of development of the surrounding orogenic
54 belts. The Neothesia oceanic lithosphere disappeared from all of eastern Turkey in the late
55 Eocene. After the oceanic lithosphere was completely submerged, the eastern Anatolia began to
56 rise as the Arabian Plate continued its northward advance. The current stage of elevation of the
57 East Anatolian Plateau as a coherent block began in the late Miocene (Yılmaz and Yi 2022). It
58 should be mentioned that many researchers have also studied seismotectonic of Anatolian
59 Plateau (Şengör and Kidd 1979; Sengör and Yilmaz 1981; Yılmaz 2017, 2019; Yilmaz et al.
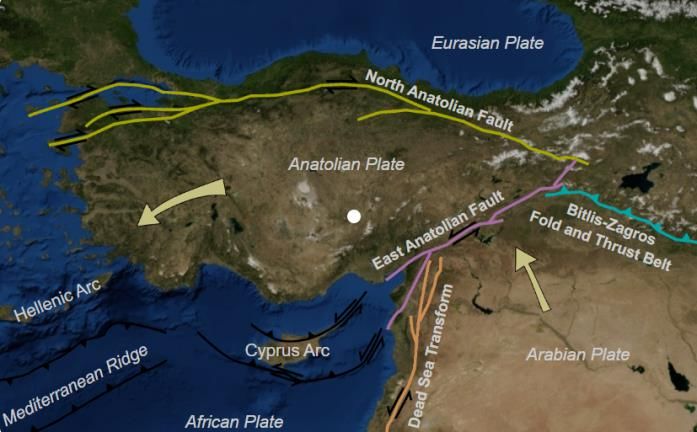
60 1997; Yılmaz and Yi 2022). In figure (1), the location and direction of movement of the
61 Anatolian plate and Arabian plate relative to each other and faults northern and eastern of
62 Anatolian plate are shown.
63
a) Slip rates of Arabian & Anatolian plates (Hubert-Ferrari b) Major active faults in the Anatolian Plate
et al. 2009; McClusky et al. 2000) (East Anatolian Fault - Wikipedia, n.d.)
64 Figure 1: Map of the main tectonic plates and faults in the area of study
65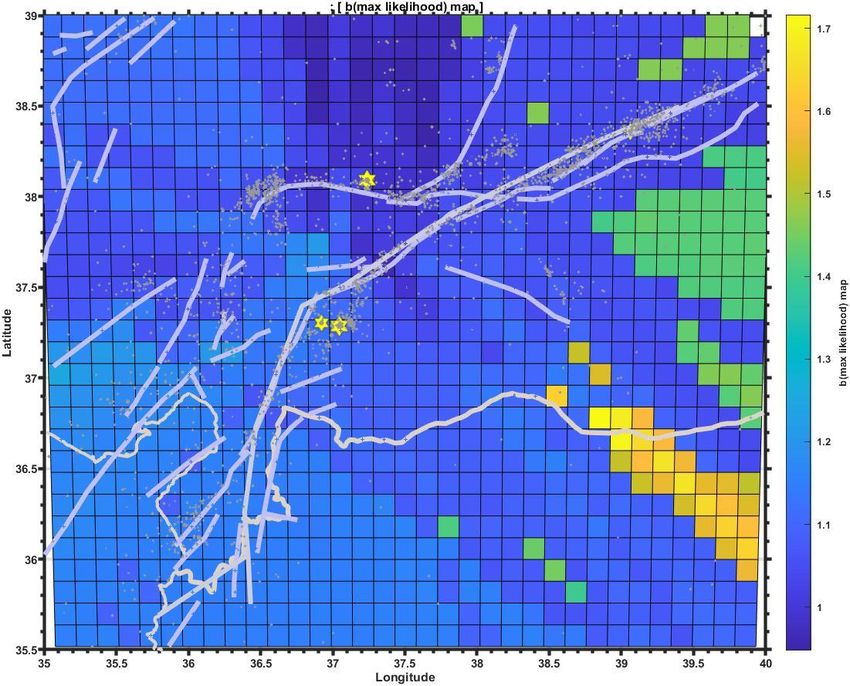
66   2- Investigation of seismicity parameters
 67       During an earthquake some physical properties of soil and rock will change (Wyss and
 68   Habermann 1979). Some of these specifications, such as wave velocity, gravity properties,
 69   electric resistance and magnetic field are totally independent from mechanism of faulting. Some
 70   studies even indicate changes may happen in the general physical conditions in the region during
 71   an earthquake (Arabelos et al. 2001). The seismic parameters of the region also change under the
 72   effect of energy release and earthquake occurrence. Regarding the relationship between
 73   cumulative Frequency-Magnitude Distribution (FMD) of earthquakes in a region, relation (1) is
 74   presented as follows by Gutenberg and Richter (1944):
 75                                                                                               (1)

 76       In relation (1), parameter b represents the distribution of earthquakes based on magnitude,
 77   parameter a represents the seismicity level of the region, and λ indicates the annual exceedance
 78   rate of the magnitude M, which is the cumulative frequency of earthquakes versus their
 79   magnitude. By drawing the λ diagram versus Mw and calculating parameters a and b in a desired
 80   area for a time period, it is possible to judge the level of seismicity of the area and the energy
 81   level, which is related to the large or small earthquakes. In other words, the parameter ―a‖
 82   indicates the y-intercept of the curve, so it expresses the number of earthquakes that occurred in
 83   the region and a certain time period, which describes the seismicity level of the region. The b
 84   parameter indicates the slope of the curve (FMD), which is the relative probability of small and
 85   large earthquakes in such a way that as the value of b increases, the number of small earthquakes
 86   increases compared to the number of larger earthquakes. Many studies proved the change of the
 87   value of b before the occurrence of a large earthquake and it can be used in the prediction of
 88   earthquakes. In this case, the value of b decreases in a period of several months before the
 89   occurrence of large earthquakes (Sammonds et al. 1992). Molchan and Dmitrieva (1990) have
 90   investigated the time variations of b for foreshocks. Molchan et al. (1999) stated that by
 91   examining local and global earthquakes the value of b resulting from foreshocks has decreased
 92   by 50% before the occurrence of the main earthquake.

 93       The most famous methods for calculating the b parameter are the least squares method and
 94   the maximum likelihood method (Wiemer and Wyss 1997). Equation (2) is used to calculate b-
 95   value using the maximum likelihood method (Hirata 1989; Aki 1965):

 96                          ̅
                                                                                      (2)

 97       where ̅ indicates the average magnitude of the earthquakes in the catalog and Mmin
 98   represents the smallest magnitude. Determining the Mmin parameter is related to the distribution
 99   of earthquake magnitudes in the study area. In most cases, this parameter is obtained by drawing
100   a diagram of the cumulative frequency of earthquakes versus the magnitude. So, the drawn graph
101   is approximated with a line and the value for which the data is placed under the line is chosen as
102   the smallest value. Many researchers have investigated the changes of the b-value parameter
103   (Ogata et al. 1991; Wiemer & Benoit 1996; Wiemer & Wyss 1997). They showed that b-value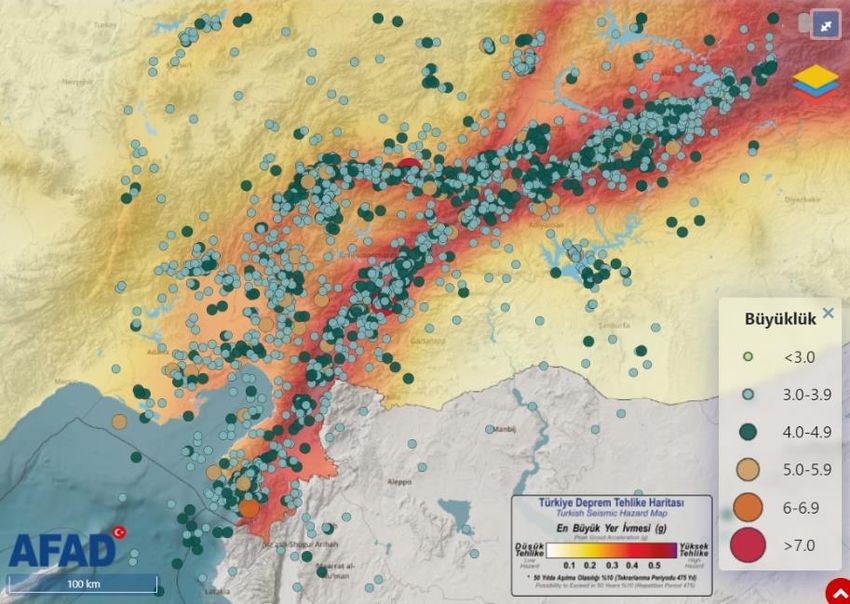
104   changes over time and space. Main et al. (1989) stated that during the period of time before an
105   earthquake, ̅ increases greatly. The researches result shows that before a big earthquake, the
106   average increases greatly and as a result the b-value decreases (Smith 1986; Wyss and Lee
107   1973). A low b-value indicates high stress in the area, and different b-values in different areas
108   show different stress accumulation in the area (Kanamori 1981).

109      Woessner and Wiemer (2005) proposed to modify the parameter Mmin with relation (3) where
110   MC represents the magnitude for which the catalog is complete:

111                                                                                           (3)

112       MC can be calculated by the maximum curvature method in the frequency-magnitude plot for
113   data that follow the Gutenberg-Richter law (Wiemer and Wyss 2000). The MC parameter over
114   time is obtained from the sliding window method (Wiemer et al. 1998). The occurrence of large
115   to medium earthquakes causes an increase in the value of MC for a short period of time (Wiemer
116   and Katsumata 1999).

117       The amount of error caused by calculations in statistical analyzes needs to be calculated.
118   Analyzing the parameter b is a statistical work, so it requires calculation of error and reliability
119   percentage of calculations. The amount of calculation error b can be obtained from equation (4)
120   (Shi and Bolt 1982):

                                   ∑       ̅
121                              √                                                           (4)

122       where n is the total number of earthquakes in the study area. Using equation (2), the value of
123   b can be calculated with the availability of sufficient seismic data for the desired area. Time-
124   dependent parameter for this task, by using a time window that includes events belonging to a
125   specific time interval, the value of b is calculated in different time intervals. Of course, there may
126   be an overlap between two time windows. In this way, the calculation of the value of the b-value
127   is done in different time intervals and its graph is drawn, which is called the time-dependent
128   change graph of the b-value (Firouzfar and Ansari 2019).

129       Mandelbrot (1982) proposed natural phenomena with fractal geometry, which with the help
130   of it, complex phenomena from the aspect of temporally and spatially, such as seismic activities,
131   have been interpreted. Seismic activities have a fractal structure with respect to time, place and
132   magnitude (Kagan and Knopoff 1978). One of the powerful tools in calculating self-similarity in
133   a geometric phenomenon is the analysis and calculation of the correlation dimension (Öztürk and
134   Bayrak 2012). Relation (5) expresses the correlation dimension of the spatial distribution of
135   seismicity of a region (Grassberger and Procaccia 1983):

136                                                                                          (5)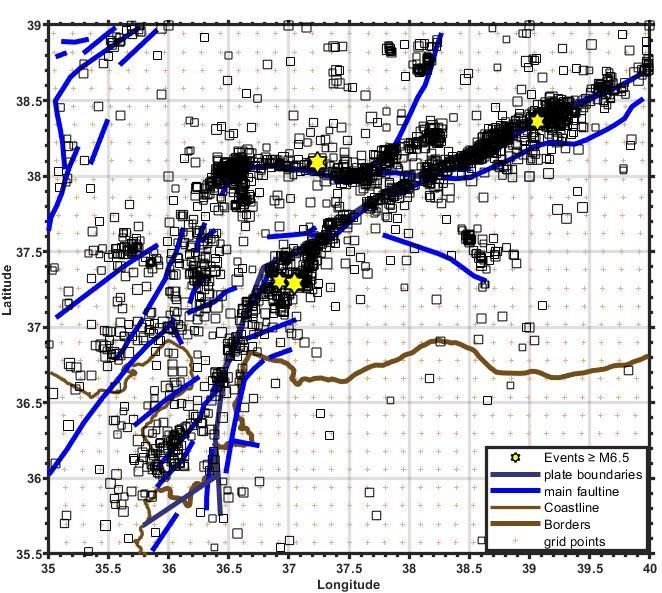
137       where C(r) is the correlation function obtained from relation (6) and calculates the spatial
138   classification and the distance between a set of points:

139                                                                                         (6)

140      where N (R
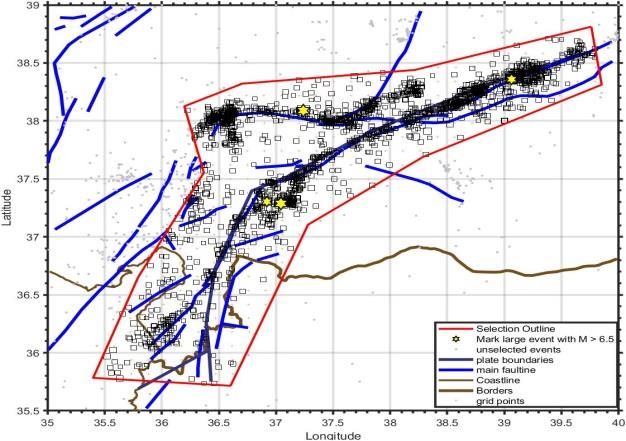
171   different cases of the borders of the study area for analyzing the b-value. In other words, it shows
172   the sensitivity of the b-value to the boundaries of the investigated area.

                        (a)-Case 1: Wide rectangular boundary and respective b-value over the time

                      (b)-Case 2: Faulting zone system boundary and respective b-value over the time

         (c)-Case 3: Earthquake affected zone boundary and respective b-value over the time (Using events just after
                                               Earthquake February 6, 2023)

173                   Figure 2: The sensitivity of the b-value parameter to the boundaries of the study area

174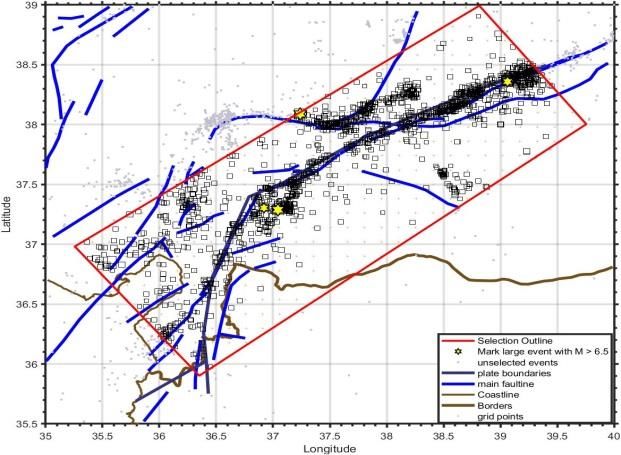
175       In Figure 2-a, a rectangular area from longitude 35 to 40 and latitude 35.5 to 39 is selected,
176   and the value of parameter b is drawn on its right side. Figure 2-b presents a large rectangular
177   area showing fault zone system which is parallel to the boundary between the Arabian and
178   Anatolian plates, and the variation of its b parameter over time is shown in right side. Figure 2-c
179   shows the location of earthquakes and aftershocks of February 6, 2023 until February 21, 2023.
180   If the range of these earthquakes be selected as the investigation area, the changes of its b
181   parameter will be according to the graph on the right side. Obviously, with any choice of
182   boundaries of the study range of the parameter b, the changes will be somewhat different. The
183   authors suggest that the proper boundary of study area can be selected using slip vectors and the
184   migration pattern of the seismic centers. In such a way that far earthquakes independent of this
185   seismic zone do not affect the changes of b-value in the study area.

186

187   Seismic catalog and analysis results

188       In this research, the seismic catalog extracted from AFAD (Turkey Disaster and Emergency
189   Management Authority) was used to calculate and check the spatial and temporal b-value. The
190   specifications of the spatial window of the catalog are according to the figures 3, 4 and 5 with
191   longitude coordinates of 35 to 40 degrees and latitude of 35.5 to 39 degrees. The time span of the
192   catalog is from January 01, 1990 to February 21, 2023. The minimum magnitude of the seismic
193   moment in the catalog is equal to 3.5. To convert the values, the relations proposed by
194   Kadirioğlu and Kartal (2016) were used. The number of data extracted for this research is 2438
195   earthquakes in a period of 33 years.

196

197
198         Figure 3: Seismicity map of Turkey and epicentral distribution of seismic events from January 01, 1990 to
199                                  February 21, 2023 (AFAD | Deprem.Gov.Tr, n.d.)
200       In figures 4 and 5 all the events with MW greater than or equal to 3.5 are shown in the study
201   area. Events with a magnitude greater than 6.5 are also marked with a yellow star.
202

       Figure 4: Epicentric distribution map of the investigated      Figure 5: Three-dimensional map of the
         seismic catalog in the desired study area (Mw≥3.5)        investigated seismic catalog in the target study
                                                                                   area (Mw≥3.5)
203

204       The diagram of the number of earthquakes versus magnitude, time and depth includes
205   general information about the seismicity of the study area. The study of the seismicity of this
206   area according to the diagram in Figure (6) shows that the number of data has decreased from
207   magnitude 3.55 to 4.05, but the number of events at magnitude 4.15 has increased significantly.
208   The survey between the years 1990 to 2023 in the region shows that the region's characteristic
209   earthquakes in view point of frequency were as large as 4.1 ~ 4.2 and after that 4.2 ~ 4.3. At
210   higher magnitudes, the number of events has a downward trend, which of course is expected.
211       Figure (7) shows the histogram of the number of events in the hours of the day and night, in
212   the study area, which shows that at least 80 events occurred in each hour of the day and night.
213   The highest number of earthquakes (Mw≥3.5) occurred at 2:30 AM and 21:30 AM.
214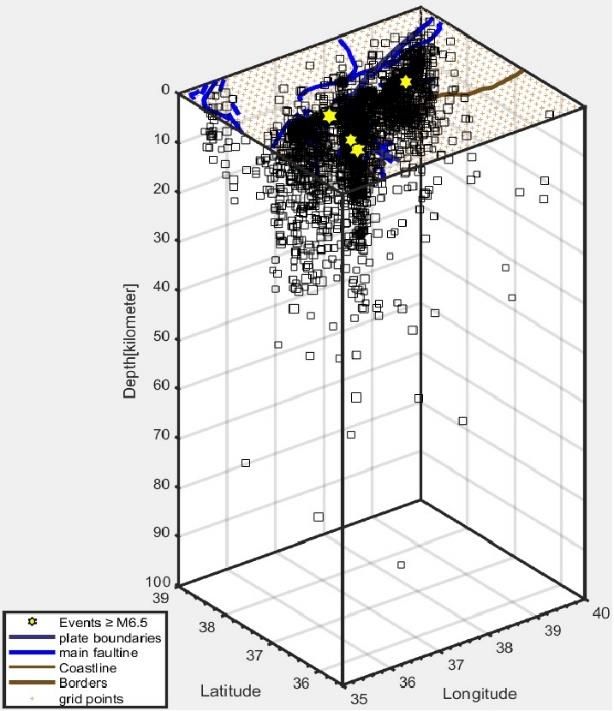
Figure 6: The histogram of the number of events per    Figure 7: The histogram of the number of events per
                  moment magnitude (Mw≥3.5)                           hour of the day and night (Mw≥3.5)
215

216       In figure (8), the diagram of the depth of events versus time shows that in the study area,
217   most of the earthquakes occurred at a depth of less than 20 km. According to this diagram, it can
218   be seen that earthquakes greater than or equal to 6.5 occurred at a depth of less than 10 km. The
219   diagram in Figure (9) shows the distribution of event sizes versus time in the study area.
220   According to this chart, earthquakes with Mw≥6.5 between 1990 and 2023 occurred in 2020 and
221   later.
222

        Figure 8: Depth diagram of earthquakes over time     Figure 9: Magnitude diagram of earthquakes over time
                           (Mw≥3.5)                                               (Mw≥3.5)
223

224       Figure (10) shows the cumulative frequency diagram of events. In Figure (11) the cumulative
225   frequency diagram of moment magnitude versus time in the study area between 1990 and 2023
226   has been shown.
227
Figure 10: Cumulative abundance chart by time Figure 11: Frequency diagram of torque in terms of
(Mw≥3.5) time (Mw≥3.5)
228
229 MC can be calculated according to Figure (12) by the maximum curvature method in the
230 frequency-magnitude diagram for data that follow the Gutenberg-Richter law. In figure (12), the
231 value of MC, b-value and a-value in the study area has been obtained by the maximum curvature
232 method. In calculation of MC over time, the sliding window method has been used. Figure (13)
233 shows the changes of MC versus time. According to this figure, the value of MC has decreased
234 versus time. This means the quality and performance of the seismic network has increased
235 around the area. It can be seen that there are a series of disturbances in the value of MC which
236 can be resulted from the stop of sending data of some stations for various reasons. One of these
237 reasons can be originated from low attention of the network operator to register small events. Of
238 course, the occurrence of moderate to large earthquakes causes an increase in MC value for a
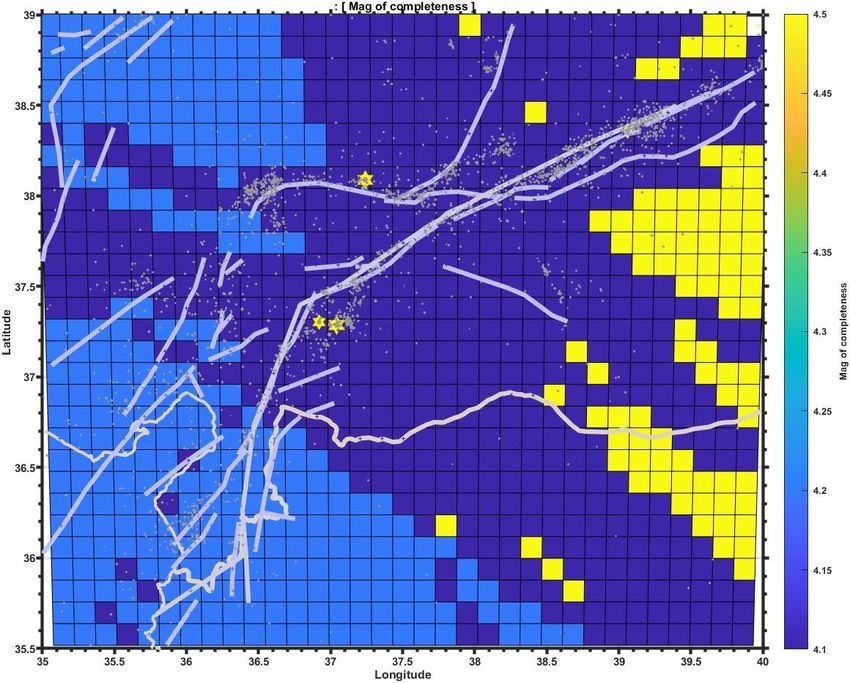
239 short period of time which they are happened. Figure (14) shows the spatial change of MC in the
240 study area. In this figure, the value of MC varies between 4.1 ~ 4.5 and in most of the cases it has
241 a value close to 4.1.
Figure 12: Frequency-magnitude distribution (FMD) Figure 13: Diagram of MC changes versus time and
and estimated values of seismicity parameters a, b and its decreasing trend (Mw≥3.5)
MC (Mw≥3.5)
242243 244 Figure 14: Spatial MC distribution 245 246 The b parameter varies over time and space. In the time period before the earthquake, the ̅ 247 increases. The researches results show that before a big earthquake, the ̅ increases and the b- 248 value decreases, consequently. Figure (15) shows the changes of b-value versus time. According 249 to this figure, b parameter has a value of 3.98 on August 30, 2022, and reached a value of 0.69 250 on February 6, 2023. In other words, before the occurrence of the biggest recent earthquakes of 251 the Eastern Anatolian fault, the b-value has decreased a lot and reached its lowest value in 33 252 years. 253 In figure (16) the changes of b-value are given versus magnitude. It can be seen that the b- 254 value has increased with the occurrence of small earthquakes. On the other hand, with the 255 occurrence of larger earthquakes, b-value has been decreased. 256
Figure 15: Diagram of b-value changes over time, one      Figure 16: Diagram of b-value versus magnitude
      year before the main earthquake of February 6, 2023.

257

258       Figure (17) also shows the changes of b-value versus time in an overview. According to this
259   Figure, the value of b in 2023 is lower than all years in study time span, and it can be seen that
260   the probability of large earthquakes in this year is higher.
261

262
263                                     Figure 17: Diagram b-value changes versus time
264
265      In figure (18), the spatial changes of b-value in the study area are shown. The b-value
266   changes in this map show the range between 1~1.7, which indicates high stress in the areas with
267   low b-value. As expected, recent large earthquakes have occurred in areas with low b-value,
268 which have high stress. The reason for the different b-value in other areas is the accumulation of 269 different stress in the area during the time period. Figure (19) shows the standard deviation map 270 of the b-value in the study area. The standard deviation ranges from 0.08 to 0.2, which is less 271 than 0.12 in most of the area. 272 273 274 Figure 18: Spatial b-value distribution 275 276 Figure 19: Spatial b-value standard deviation distribution
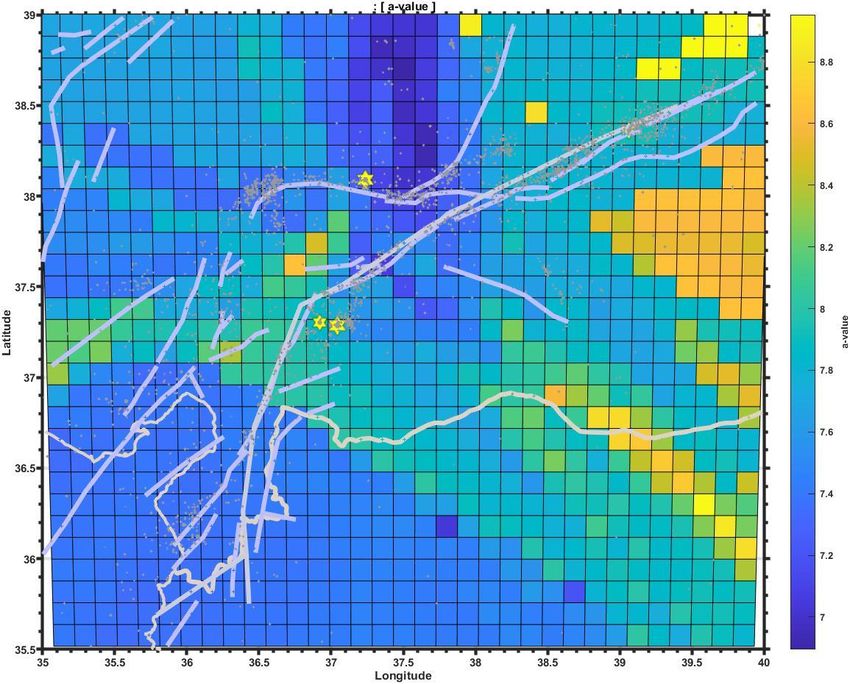
277       Figure (20) shows the map of the spatial changes of the a-value in the study area. This
278   parameter expresses the level of regional seismicity so the higher the regional seismicity, the
279   larger the a-value parameter. In this area, the a-value varies between 7.0 to 8.8.

280
281                                     Figure 20: Spatial a-value distribution
282
283   Conclusion
284        Eastern Anatolian fault is formed at the meeting of Arabian and Anatolian tectonic plates.
285   This fault is running from the south to the northeast of Turkey. In this research, a detailed
286   investigation was done on the temporal and spatial changes of seismicity parameters. The
287   selected catalog was focused on the Eastern Anatolia region from longitude 35 to 40 degrees and
288   latitude 35.5 to 39 degrees. Catalogue involves events from January 1, 1990 to February 21,
289   2023 with a moment magnitude greater than or equal to 3.5. Next, sensitivity analysis of b
290   parameter was performed according to different selection of boundaries in the study area. In the
291   investigation of temporal b-value, it can be seen before the earthquake on February 6, 2023, the
292   b-value has been decreasing since about 6 months before. It confirms the theory of b-value
293   decreasing before the big earthquakes. Although changes of parameter b and especially its
294   decrease in the months leading to a moderate or large earthquake are effective in predicting the
295   time and location of earthquakes, it is suggested to promote the prediction using other advanced
296   analysis. Some of these are containing of changes in the amount of stress, wave velocity, gravity
297   characteristics, electric resistance and magnetic field. Using all mentioned measuring and
298   analysis of them will help better estimation of time and location prediction of moderate and large
299   earthquakes and it will be lead to better management of earthquake crisis and minimizing the
300   human and financial losses.
301   Declarations
302   Competing interests: The authors declare no competing interests.
303   Ethics approval and consent to participate: Not applicable.
304   Consent for publication: All authors give their consent so this paper can be published.
305   Conflict of interest: There is no conflict of interest.
306   Funding The authors declare that no funds, grants, or other support were received during the
307   preparation of this manuscript.
308
309
310   References
311
312   AFAD | deprem.gov.tr. (n.d.). Retrieved March 6, 2023, from https://deprem.afad.gov.tr/event-catalog

313   Aki K (1965). Maximum likelihood estimate of b in the formula log N=a-bM and its confidence limits. Bull. Earthquake Res.
314         Inst., Tokyo Univ., 43, 237–239. https://cir.nii.ac.jp/crid/1573387450038851840

315   Arabelos D, Asteriadis G, Contadakis M, Zioutas G, Xu D, Zhang C, Zheng B (2001) The use of an outlier detecting method in
316         time series of continuous daily measurements of underground water level and temperature in earthquake prediction
317         investigation. Tectonophysics, 338(3–4). https://doi.org/10.1016/S0040-1951(01)00086-5

318   Cooper G R J, Cowan D R (2008) Comparing time series using wavelet-based semblance analysis. Computers and Geosciences,
319        34(2), 95–102. https://doi.org/10.1016/j.cageo.2007.03.009

320   East Anatolian Fault - Wikipedia. (n.d.). Retrieved March 6, 2023, from https://en.wikipedia.org/wiki/East_Anatolian_Fault

321   Enescu B, Ito K, Struzik Z R (2006) Wavelet-based multiscale resolution analysis of real and simulated time-series of
322         earthquakes. Geophysical Journal International, 164(1). https://doi.org/10.1111/j.1365-246X.2005.02810.x

323   Firouzfar A, Ansari B (2018) Parameter b , a common point in the occurrence of recent earthquakes in Iran. The 1th National
324         Conference on the Role of Civil Engineering in Hazard Mitigations. (In Persian)

325   GhaedAminiHaroni Kh (2017) Spatial Analysis of b-value and fractal dimension of Earthquakes in Central Iran. M.Sc. thesis,
326        Ferdowsi University of Mashhad, department of physics. (In Persian)

327   Grassberger P, Procaccia I (1983) Characterization of strange attractors. Physical Review Letters, 50(5), 346–349.
328         https://doi.org/10.1103/PHYSREVLETT.50.346

329   Gutenberg B, Richter C F (1944) Frequency of earthquakes in California. Bulletin of the Seismological Society of America, 34(4),
330        185–188. https://doi.org/10.1785/BSSA0340040185

331   Hasanzadeh B (2013) Investigation and analysis of seismicity parameters a and b, fractal dimension in the central Kope Dagh.
332        Ferdowsi University of Mashhad. (In Persian)

333   Hirata T (1989) A correlation between the b value and the fractal dimension of earthquakes. Journal of Geophysical Research,
334          94(B6). https://doi.org/10.1029/JB094iB06p07507

335   Hubert-Ferrari A, King G, van der Woerd J, Villa I, Altunel E, Armijo R (2009) Long-term evolution of the North Anatolian
336         Fault: New constraints from its eastern termination. Geological Society Special Publication, 311.
337         https://doi.org/10.1144/SP311.5

338   Ji Y-S, Oh S-H, Kim K-Y (2012) Wavelet Based Semblance and Eigenvalue Analysis for Geomagnetic Variation Related to
339          Micro-Earthquakes in the Korean Peninsula. Journal of the Korean Earth Science Society, 33(5), 408–421.
340          https://doi.org/10.5467/jkess.2012.33.5.408

341   Kadirioğlu F T, Kartal R F (2016) The new empirical magnitude conversion relations using an improved earthquake catalogue
342         for Turkey and its near vicinity (1900–2012). Turkish Journal of Earth Sciences, 25(4), 300–310.
343         https://doi.org/10.3906/yer-1511-7
344   Kagan Y, Knopoff L (1978) Statistical study of the occurrence of shallow earthquakes. Geophysical Journal of the Royal
345        Astronomical Society, 55(1). https://doi.org/10.1111/j.1365-246X.1978.tb04748.x

346   Kanamori H (1981) The Nature of Seismicity Patterns Before Large Earthquakes. Earthquake Prediction: An International
347        Review, 1–19. https://doi.org/10.1029/ME004P0001

348   Khoshnavaz M J, Siahkoohi H R, Roshandel Kahoo A (2021) Seismic velocity analysis in the presence of amplitude variations
349        using local semblance. Geophysical Prospecting, 69(6), 1208–1217. https://doi.org/10.1111/1365-2478.13118

350   Main I G, Meredith P G, Jones C (1989) A reinterpretation of the precursory seismic b‐value anomaly from fracture mechanics.
351         Geophysical Journal International, 96(1). https://doi.org/10.1111/j.1365-246X.1989.tb05255.x

352   Mandelbrot B (1982) The fractal geometry of nature freeman New York Google Scholar.
353        http://users.math.yale.edu/~bbm3/web_pdfs/encyclopediaBritannica.pdf

354   McClusky S, Balassanian S, Barka A, Demir C, Ergintav S, Georgiev I, Gurkan O, Hamburger M, Hurst K, Kahle H, Kastens ø
355        K, Kekelidze G, King R, Kotzev V, Lenk O, Mahmoud S, Mishin A, Nadariya T M, Ouzounis A, Veis G (2000) Global
356        Positioning System constraints on plate kinematics and dynamics in the eastern Mediterranean and Caucasus. Wiley Online
357        Library, 105(B3), 5695–5719. https://doi.org/10.1029/1999JB900351

358   Molchan G M, Dmitrieva O E (1990) Dynamics of the magnitude—frequency relation for foreshocks. Physics of the Earth and
359        Planetary Interiors, 61(1–2), 99–112. https://doi.org/10.1016/0031-9201(90)90098-I

360   Molchan G M, Kronrod T L, Nekrasova A K (1999) Immediate foreshocks: Time variation of the b-value. Physics of the Earth
361        and Planetary Interiors, 111(3–4). https://doi.org/10.1016/S0031-9201(98)00163-0

362   Muzy J F, Bacry E, Arneodo A (1991) Wavelets and multifractal formalism for singular signals: Application to turbulence data.
363        Physical Review Letters, 67(25). https://doi.org/10.1103/PhysRevLett.67.3515

364   Ogata Y, Imoto M, Katsura K (1991) 3‐D Spatial Variation of b‐Values of Magnitude‐Frequency Distribution Beneath the Kanto
365         District, Japan. Geophysical Journal International, 104(1). https://doi.org/10.1111/j.1365-246X.1991.tb02499.x

366   Öztürk S, Bayrak Y (2012) Spatial variations of precursory seismic quiescence observed in recent years in the eastern part of
367         Turkey. Acta Geophysica, 60(1). https://doi.org/10.2478/s11600-011-0035-z

368   Sammonds P R, Meredith P G, Main I G (1992) Role of pore fluids in the generation of seismic precursors to shear fracture.
369       Nature, 359(6392). https://doi.org/10.1038/359228a0

370   Şengör A M C, Kidd W S F (1979) Post-collisional tectonics of the Turkish-Iranian plateau and a comparison with Tibet.
371        Tectonophysics, 55(3–4). https://doi.org/10.1016/0040-1951(79)90184-7

372   Sengör A M C, Yilmaz Y (1981) Tethyan evolution of Turkey: A plate tectonic approach. Tectonophysics, 75(3–4).
373        https://doi.org/10.1016/0040-1951(81)90275-4

374   Shi Y, Bolt B A (1982) The standard error of the magnitude-frequency b value . Bulletin of the Seismological Society of America,
375         72(5). https://doi.org/10.1785/bssa0720051677

376   Smith W D (1986) Evidence For Precursory Changes In the Frequency‐Magnitude B‐Value. Geophysical Journal of the Royal
377         Astronomical Society, 86(3). https://doi.org/10.1111/j.1365-246X.1986.tb00662.x

378   Toledo B A, Chian A C L, Rempel E L, Miranda R A, Muñoz P R, Valdivia J A (2013) Wavelet-based multifractal analysis of
379         nonlinear time series: The earthquake-driven tsunami of 27 February 2010 in Chile. Physical Review E - Statistical,
380         Nonlinear, and Soft Matter Physics, 87(2). https://doi.org/10.1103/PhysRevE.87.022821

381   Wiemer S (2001) A software package to analyze seismicity: ZMAP. Seismological Research Letters, 72(3), 373–382.
382        https://doi.org/10.1785/GSSRL.72.3.373

383   Wiemer S, Benoit J P (1996) Mapping the b-value anomaly at 100 km depth in the Alaska and New Zealand subduction zones.
384        Geophysical Research Letters, 23(13). https://doi.org/10.1029/96GL01233

385   Wiemer S, Katsumata K (1999) Spatial variability of seismicity parameters in aftershock zones. Journal of Geophysical
386        Research: Solid Earth, 104(B6). https://doi.org/10.1029/1999jb900032
387   Wiemer S, McNutt S R, Wyss M (1998) Temporal and three-dimensional spatial analyses of the frequency-magnitude
388        distribution near Long Valley Caldera, California. Geophysical Journal International, 134(2).
389        https://doi.org/10.1046/j.1365-246X.1998.00561.x

390   Wiemer S, Wyss M (1997) Mapping the frequency-magnitude distribution in asperities: An improved technique to calculate
391        recurrence times? Journal of Geophysical Research: Solid Earth, 102(B7). https://doi.org/10.1029/97jb00726

392   Wiemer S, Wyss M (2000) Minimum magnitude of completeness in earthquake catalogs: Examples from Alaska, the Western
393        United States, and Japan. Bulletin of the Seismological Society of America, 90(4). https://doi.org/10.1785/0119990114

394   Woessner J, Wiemer S (2005) Assessing the Quality of Earthquake Catalogues: Estimating the Magnitude of Completeness and
395        Its Uncertainty. Bulletin of the Seismological Society of America, 95(2), 684–698. https://doi.org/10.1785/0120040007

396   Wyss M, Habermann R E (1979) Seismic quiescence precursory to a past and a future Kurile island earthquake. Pure and
397        Applied Geophysics PAGEOPH, 117(6). https://doi.org/10.1007/BF00876215

398   Wyss M, Lee W H K (1973) Time variations of the average earthquake magnitude in central California, in Proceedings of the
399        Conference on Tectonic Problems of the San Andreas Fault System, edited by Kovach R L, Nur A. Stanford University
400        Geol. Sci, 24-42.

401   Yılmaz Y (2017) Morphotectonic development of anatolia and the surrounding regions. Geophysical Monograph Series, 225.
402        https://doi.org/10.1002/9781118944998.ch2

403   Yılmaz Y (2019) Southeast anatolian orogenic belt revisited (Geology and evolution). Canadian Journal of Earth Sciences,
404        56(11). https://doi.org/10.1139/cjes-2018-0170

405   Yilmaz Y, Tüysüz O, Yigitbaç E, Engor C G A M C (1997) Geology and tectonic evolution of the pontides. AAPG Memoir, 68.
406        https://doi.org/10.1306/m68612c11

407   Yılmaz Y, Yi E (2022) Tectonics of Eastern Anatolian Plateau; Final Stages of Collisional Orogeny in Anatolia.
408        https://doi.org/10.1002/essoar.10510307.1

409   Zamani A, Kolahi Azar A P, Safavi A A (2014) Wavelet-based multifractal analysis of earthquakes temporal distribution in
410        Mammoth Mountain volcano, Mono County, Eastern California. Acta Geophysica, 62(3). https://doi.org/10.2478/s11600-
411        013-0184-3

412   Zamani A, Samiee J, Kirby J F (2013) Estimating the mechanical anisotropy of the Iranian lithosphere using the wavelet
413       coherence method. Tectonophysics, 601. https://doi.org/10.1016/j.tecto.2013.05.005
You can also read