Voting for the Underdog or Jumping on the Bandwagon? Evidence from India's Exit Poll Ban
←
→
Page content transcription
If your browser does not render page correctly, please read the page content below
Voting for the Underdog or Jumping on the
Bandwagon? Evidence from India’s Exit Poll
                   Ban∗
                         Somdeep Chatterjee†                 Jai Kamal‡
                                       December 2019

    Keywords: Exit polls; turnout; vote shares; underdog voting
    JEL: D72, O38, O12

                                            Abstract
          Exit poll surveys during elections are conducted to predict the outcome of the
      actual elections. However, such polls have historically been controversial, particularly
      for multi-phase elections, as they could potentially influence the behavior of voters in
      the latter rounds of voting. If subsequent voters are likelier to vote for the predicted
      frontrunner, it is known as the bandwagon voting phenomenon whereas if they vote
      for the predicted trailing candidate, the phenomenon is known as underdog voting. To
      avoid such issues, in 2009 the election administration in the world’s largest democracy
      (India) had introduced a blanket ban on exit polls being published in the media until
      all rounds of an election are completed. Exploiting the potentially exogenous timing
      of this reform and using administrative data to compare states which went to elections
      before and after this ban, we find that in response to the policy, vote share increases
      for the front-runner and decreases for others. This implies that in the counterfactual,
      without the ban, less people would have voted for the front-runner. This is suggestive
      evidence of underdog voting. We also find evidence that elections are usually closer in
      the presence of exit polls.

∗
  We thank seminar participants at FLAME University for comments and feedback.
†
  Indian Institute of Management Lucknow; somdeep@iiml.ac.in; Corresponding Author
‡
  Indian Institute of Management Lucknow; jaikamal@iiml.ac.in

                                                 1
1 Introduction
With a population of over 1.3 billion people, India is the world’s largest
democracy and therefore provides a a great case for research in political
economy, voting behavior and electoral participation. While all elections
around the world get a lot of media attention, India due to its sheer size,
potentially provides the largest audience for news related to the elections.
One of the most intriguing features of media coverage of elections in general,
and Indian elections (since 1980s) in particular, is reporting of survey results
from pre- and post-poll surveys, attempting to predict the outcome of the
elections.1 A major controversy surrounding some of these survey reports
stems from the potential influence that the predictions may have on actual
voting behavior of the electorate. Given majority of elections in India are
conducted in phases, spanning many days, sometimes weeks and even months,
the possibility of such influence is immense. To address this issue, in the year
2009, the Election Commission of India (ECI), which is the independent
autonomous administrative body responsible for conducting major elections
in the country, decided to issue a blanket ban on publishing results of a
particular type of post-poll surveys, ie, exit polls, until the conclusion of all
phases of an ongoing election.
Exit polls are usually considered the most reliable predictor of eventual
1
Media personality Prannoy Roy is credited with the feat of having conducted the first ever large scale sur-
vey in 1984 having accurately predicted the upsurge of the Indian National Congress Party which eventually
led to Rajiv Gandhi becoming the prime minister of India.
1election outcomes because these involve interviewing actual voters who come
out of the polling stations after casting their votes, whereas pre-poll surveys
(popularly known as opinion polls in India) might overestimate election-day
voter turnout and hence are more susceptible to biases (Best and Krueger
2012). Theoretically, if exit poll results in a multi-phase election are an-
nounced at the end of each phase, this may influence voters in the subsequent
phases in two possible ways. First, the voters may be inclined to vote for the
predicted winner or frontrunner. Such behavior is known as the bandwagon
effect. Second, the converse may be true, ie, voters may be more likely to
take sides with the trailing candidates which is known as underdog effect in
politics.
In this paper, we are interested to find if the Indian electorate on average
demonstrates bandwagon voting or underdog voting. Empirically identifying
either of these motivations in the presence of exit polls is difficult and re-
quires making assumptions about behavior of the average individual based
on aggregate data or predicting the unobserved counterfactual. However, the
ban on exit polls by the ECI provides an excellent natural experiment setting
to overcome such challenges. Using administrative data on election outcomes
and candidates’ choices in national(parliamentary) and state(legislative as-
sembly) elections2 , we are able to exploit the potentially exogenous timing of
the ban given predetermined electoral calendar in India. Additionally, some
2
In India, national elections are popularly known as general elections.
2states in India have multi-phase elections whereas others have single-phase
elections 3 . Therefore, our identification strategy also relies on the cross-
sectional variation provided by the fixed electoral calendar and allows us to
compare states having single and multi phase elections before and after the
ban.
Our estimates suggest that vote share of front runners increased and vote
shares of others decreased, in response to the ban on exit polls. Consequently,
we predict that in the counterfactual (with exit polls) vote share of the even-
tual winner would have been lower and vote shares of other candidates would
have been higher, under the identifying assumption in a standard difference-
in-differences estimation paradigm. This is suggestive evidence of underdog
voting by Indian voters if exit poll information is disseminated and is con-
sistent with the possibility of influence resulting from publishing post-poll
survey results in a multi-phase election.
We also empirically estimate the impacts of the exit poll ban on candi-
dates’ decision to contest the election. Unlike the results on vote share, we do
not find any conclusive evidence on candidates’ decision to contest elections.
While for state elections, the exit poll ban seems to have led to more candi-
dates contesting, lesser people contest in national elections in response to the
ban. Given that Indian electoral system requires every contesting candidate
to acquire a minimum threshold of votes (roughly 6% of total vote cast) to
3
If all constituencies in a given state go to polls on the same day, it is regarded as a single-phase election.
3avoid forfeiture of their monetary deposit. The decision to contest may de-
pend on potential candidates’ perception about the electorates’ preferences.
If candidates believe that voters follow underdog voting, they may be more
likely to contest in the presence of exit polls.
The rest of the paper is organized as follows. Section 2 presents some back-
ground in terms of the exit poll reform and also discusses relevant literature
to which our paper contributes. Additionally, we also present a brief concep-
tual framework in this section. Section 3 describes the data and empirical
strategy. Section 4 presents results and section 5 concludes.
2 Background
Exit polls are surveys in which people are interviewed or given a questionnaire
with the idea of predicting election results. In terms of precision, exit polls
have advantage of the timings over other kinds of polls such as pre poll surveys
as exit polls are conducted on the same day of election. Though the precision
largely depends on the sampling method used and the sample coverage of the
poll, it is safe to assume that exit poll results are better than other polls if
similar sampling methods are used with similar coverage . It has been argued
that exit polls have potential to influence the voting and candidate behavior
(Moy and Rinke 2012; Sudman, 1986; McAllister and Studlar,1991; Andersen
et al. ,2014). Exit polls can influence the election in three ways - Bandwagon
effect, Underdog effect, and Projection effect. The bandwagon effect predicts
4voters favoring a party that is doing well in the polls, while the underdog
effect predicts that support will go to a party trailing in the polls. There is
also a possibility of a projection effect, with voters’ expectations conforming
to their partisanship (McAllister and Studlar, 1991). The projection effect is
equivalent of no effect of exit poll on voting behavior and thus exit polls can
can affect the election through only two possible ways - Bandwagon effect or
Underdog effect.
Countries have different types of restrictions on conducting exit polls. Ac-
cording to Freedom to conduct opinion polls 2017 report 4 , out of 111 coun-
tries surveyed twelve countries had complete ban on exit poll. Those countries
are people’s republic of China, Mongolia, Qatar, Saudi Arabia, Singapore,
Vietnam, Cameroon, Columbia, Dominican Republic, Malta, Morocco and
Trinidad and Tobago. Also, in 57 % of the countries in the study, exit polls
are conducted, though often with restrictions on their conduct.
The responses to the question asked in WAPOR report was as below :
Table 1: “In your country, are there legal restrictions on the conduct of the exit polls?”
Response Percent
cannot conduct opinion poll at all 11%
cannot be conducted inside the polling station 19%
cannot be conducted within a specified distance from polling station 9%
no restrictions but exit polls have not been conducted to date 17%
no restrictions and some exit polls have been conducted to date 30%
don’t know 14%
4
World Association for Public Opinion Research (WAPOR) jointly with ESOMAR publishes these reports
on a regular interval since 1984.
5Historically, exit polls have been successful in predicting the actual election
result in some cases whereas they have failed to predict in the other cases. The
recent history of UK exit poll suggests that BBC and ITV, the major news
channels, have failed to predict the results prior to 2001 and they , with new
improved methods of conducting exit polls, have improved their accuracy.5
In 2016 presidential elections of USA, polls have been unsuccessful as most
polls predicted win of Hillary Clinton over Trump (Kennedy et al ,2018). In
the Indian context, seat predictions were accurate for both 1998 and 1999
general elections whereas they were imprecise for 2004 general elections (Rai
2014).
Exit polls can be unsuccessful in prediction due to methodological chal-
lenges. An incorrect sampling technique can lead to inaccurate predictions.
For instance, if majority of the respondents to exit poll are old whereas ma-
jority of the voters for that constituency are young, we are likely to have erro-
neous predictions as the preferences of old and young differ in general. In ad-
dition to age group, agencies conducting exit polls should make sure that the
sample of the respondents represent whole population for other demographic
parameters such as income, race, ethnicity etc also. It is recommended to
use advanced sampling such as random sampling or non-probability sampling
(quota sampling) . Another issue is that of the actual response rate. If re-
sponse rate is too low, spurious predictions are made. The exit poll results
5
Source: https://warwick.ac.uk/fac/sci/statistics/staff/academic-research/firth/exit-poll-explainer/
6can be influenced by the environment in which the poll is conducted - time
of exit poll, type of questions asked. We can find cases of social desirability
bias as people respond under the influence of social norms (McDonald and
Thornburg, 2012). In case of secret- ballot , we can expect people responding
their true responses. Statistical method used for prediction can also lead to
inaccurate predictions.
In addition to methodological challenges in conducting exit polls, predic-
tions of election outcomes may be subject to cognitive biases and ‘wishful
thinking’ (Searles et al, 2018).6 Also, there have been allegations that the
exit polls are tweaked to favor one of the parties by the media. The exit poll of
2000 presidential election in USA predicted that Al Gore has won the Florida
state. However, Bush won the election by a narrow margin after 45 days of
lawsuits and recounting. Many questioned the motive behind the exit poll
that resulted in inaccuracy and along similar lines noted congressman John
Conyers asked Edison-Mitofsky ”to turn over raw data collected in Election
Day exit polls, for investigation of any discrepancies between voter responses
and certified election results” (Barreto et al, 2006) . In Indian context, a
recent sting operation on polling agencies have revealed that seat prediction
figures are manipulated in favor of their client (Rai, 2014). The news article
7
from Indian Express reads as below:
6
Wishful thinking can be viewed as a positive relationship between candidate preference and electoral
expectations.
7
To access the article click the link here https://indianexpress.com/article/explained/
exit-polls-and-why-they-are-restricted-by-the-panel-dainik-jagran-editor-arrest-4527055/
7“polls can be controversial if the agency conducting them is perceived to be biased. Critics
say the projections of these surveys can be influenced by the choice, wording and timing of the
questions, and by the nature of the sample drawn. Political parties often allege that many opinion
and exit polls are motivated and sponsored by their rivals, and could have a distorting effect on
the choices voters make in a protracted election, rather than simply reflecting public sentiment or
views.”
The main reasons for an exit poll ban are unconvincing methodology and
biased surveys of respondents in the exit polls. Given the financial and hu-
man resources and deadlines media houses face, it is unlikely that they take
into account the issues highlighted above such as drawing a sample that is
representative of entire population and using a well designed questionnaire
or making sure environment in which the polls are conducted is free from
face-to-face interactions (methods like secret ballots are recommended). Ad-
ditionally, the possibility of manipulation of exit poll results so that a partic-
ular political party gets benefited accentuates the motivations of such a ban.
Thus, many countries have restrictions on exit poll.
2.1 Exit Boll Ban in India
Representation of the People (Amendment) Act 2009 , which was published
in an extraordinary issue of the Gazette of India dated 23rd December 2009,
puts restrictions on conducting the exit polls and publishing the results of exit
8polls in any manner during the period specified in new section 126A.8 Under
this Act, exit polls are defined as ,“an opinion survey respecting how electors
have voted at an election or respecting how all the electors have performed with
regard to the identification of a political party or candidate in an election”.
Ministry of law and justice chose 1st February 2010 as the date on which the
provisions of the act would come into force.
However, it was not the first attempt by Government of India to ban Exit
9
Poll. Indian Express article explains earlier attempts as below:
“The Election Commission consulted political parties on exit polls on December 22, 1997 - when
MS Gill was election commissioner. In the meetings, representatives of most national and state
parties said these polls were unscientific, and suffered from biases in the size and nature of samples.
Soon afterward, on January 11, 1998, with Lok Sabha polls and Assembly elections in Gujarat,
Himachal Pradesh, Meghalaya, Nagaland and Tripura around the corner, the Election Commission
issued guidelines under Article 324 of the Constitution, prohibiting newspapers and news channels
from publishing results of pre-election surveys and exit polls between 5 pm on February 14 and 5
pm on March 7. The first votes in the elections were scheduled to be cast on February 16, 1998,
and the last votes on March 7. The EC also mandated that while carrying the results of exit
and opinion polls, newspapers and channels should disclose the sample size of the electorate, the
details of polling methodology, the margin of error and the background of the polling agency.”
8
Election commission, an autonomous constitutional body responsible for administering election in India,
sets the duration of ban for assembly elections whereas for general election the article itself have defined the
period
9
Refer to Indian express article written by Ritika Chopra , 16 Feb 2017, Exit polls and why they are
restricted by the panel: All your questions answered , https://indianexpress.com/article/explained/
exit-polls-and-why-they-are-restricted-by-the-panel-dainik-jagran-editor-arrest-4527055/
9As discussed above, Representation of the People (Amendment) Act 2009
came into effect on 1st February 2010. Bihar was the first state which had
election after the ban (multi-phase election spanning from October 2010 to
November 2010) and Arunachal pradesh , Harayana and Maharashtra were
the last states to have had elections before the ban in the month of October
2009. Interestingly, all these states had single phase elections and therefore
can serveas a potential control group in our estimation strategy.
2.2 Related Literature
The literature has extensively studied presence of bandwagon effect and un-
derdog effect as a result of exit poll surveys (McAlliaster and Studler, 1991).
Although most of the empirical studies suggest bandwagon effect, the pres-
ence of underdog effect is also supported by substantial research. Another
way in which exit poll can influence is to affect voting turnout and voting
behaviour (Moy and Rinke 2012;Sudman 1986; McAllister and Studler 1991;
Morwitz and Pluzinski 1996; Andersen et al 2014; John E. Jackson 1983;
Morton et al 2015). The main reason for increase in voter turnout , in pres-
ence of exit poll, could be the inherent motivation of those who vote later if
there is a close election as they find their vote pivotal in case of a close elec-
tion (Jackson, 1983). In addition to closeness of election, expressive voting
and protest voting can also influence voters turnout as people might vote for
the sake of voting or they might express their protest against all the candi-
10dates contested(Ujhelyi, Chatterjee and Szabo 2019). Apart from empirical
studies , more recently , researchers have exploited game theoretical and ex-
perimental setup to study effect of exit polls (Battaglini et al 2007; Coate et
al 2008;Taylor and Yildirim 2010) .
It is a well-recognized fact in literature that exit polls suffer from method-
ological challenges. These methodological challenges seem to be one of the
plausible reasons for ban on exit poll. In addition to methodological chal-
lenges, the literature has also pointed out possible controversies that the exit
polls suffers from (Barreto et al 2006; Rai 2014). Only study similar to ours
is Morton et al (2015) and they have studied effect of exit poll ban in French
context and unlike us they have found presence of Bandwagon effect. To
the best of our knowledge, no study has empirically found presence of ei-
ther bandwagon or underdog effect in Indian context. It is first paper to
empirically estimate the causal effects of India’s exit poll ban of voter and
candidate behaviour. While some papers have studied the effects of exit poll
bans, none that we know of have looked at the impact on ex-ante and ex-post
candidate behaviour and performance. We also happen to find a mismatch
in candidate’s expectations and voter’s behaviour as voters show bandwagon
voting whereas candidates expect underdog voting.
112.3 Conceptual Framework
The conceptual framework underlying the voters’ behavior maybe motivated
in terms of a strategic interaction setting. Essentially the research question
of this paper attempts to make inference about collective decision making of
individuals in an interactive environment based on some asymmetric infor-
mation dissemination. The empirical exercise is relatively easy to motivate if
one considers voters’ utilities as functions of the benefit derived from a poten-
tial favorite candidate winning and an additional expressive motive such as
desire to protest or some intrinsic utility from participating in the democratic
process, irrespective of who wins. This expressive motivation to vote can ex-
plain the potentials of underdog voting, rather than voting for a preferred
candidate. If one desires to cast a protest vote, it is quite possible that they
choose a fringe candidate unlikely to win as a means of sending a signal of
their dissent to the frontrunners. In this setup, the influence of exit polls are
essentially like a shock leading to a change in the thresholds for choosing to
vote for the favorite candidates over and above the fringe ones.
3 Empirical Framework
This section discusses about the data sources, identification strategy and the
econometric model used.
123.1 Data
We use administrative data from the statistical reports published by election
10
commission of India(ECI) . ECI publishes reports for both assembly elec-
tions and general elections. Our analysis is based on five general elections
conducted between 1998 and 2014 and on two assembly elections each, for
four states between 2004 and 2010.
For assembly elections,the dataset consists of 681 constituencies of four
Indian States namely Arunchal Pradesh, Bihar, Haryana and Maharashtra.
The rationale for selecting these four states is that they had election either
immediately before or immediately after the ban. Arunchal Pradesh, Haryana
and Maharashtra had just before the exit poll ban and Bihar had elections
just after the exit poll ban. Moreover, among the four states, Bihar was the
only state which had multi-phase election.
For general elections, we have included only those states which always had
multi-phase or always had single-phase elections for all five elections in the
span of our data. Consequently, we have dropped the states that switch from
single-phase in some elections to multi-phase in others. The states included in
our analysis are shown in figure 1. Data regarding total number of candidates
contested for an election , withdrawn nomination from an election, submitted
forfeiture deposits , total electors and number of polling stations are also from
the statistical reports.
10
Statistical reports are published in PDF format and the data is converted to usable excel format by
authors
13Figure 1: Indian States
Note: Numbers in the map represent number of constituencies in parliamentary elections in each state.
The data for variables used as controls in regressions are taken from Re-
serve Bank of India( India’s Central Bank) “Handbook of statistics on Indian
Economy”. These variables include population, sex ratio, literacy , total elec-
tors and urban employment.
Indian government undertook a massive electoral redistricting exercise in
1411
the country (redefining the boundaries of constituencies ) in 2002 through
“The Delimitation Act , 2002”. Cabinet Committee on Political Affairs
(CCPA) decided to implement the report of the Delimitation Commission
12
on January 4 , 2008 . The delimination notification came into effect from
13
Febraury 20, 2008. . Due to this delimitation exercise, we are unable to
use a panel of constituencies for our analysis as the boundaries have changed
nationwide. However, since the number of constituencies have not changed as
a result of this redistricting, our analysis depends on a repeated cross section
of constituencies and states.
The summary statistics of the data-set are reported in table 2. The number
of registered voters in assembly elections is around 200 thousands and in that
of national elections is around 1.3 million in the average constituency. The
eventual winner in the average election gets around 44 to 46 percent of the
total number of votes.14 It is interesting to observe that in state elections
seventy five percent of the total votes usually go to the top two front runners
whereas this number is above 80 percent in the parliamentary elections. As
a result, candidates who finish in the third position or below are usually the
fringe candidates. However, these fringe candidates are not entirely irrelevant
11
The need of redefining boundaries arises due the changing population. That’s why this redefining is
based on recent census. The Delimitation Act , 2002 redefined boundaries based on 2001 census of India.
Also note that total number of constituencies remain same as before for all states.
12
https://economictimes.indiatimes.com/articleshow/2673204.cms?utm_source=
contentofinterest&utm_medium=text&utm_campaign=cppst
13
https://www.thehindu.com/todays-paper/Delimitation-notification-comes-into-effect/
article15169974.ece
14
Since India has a first-passed-the-post voting system, the winner need not get the majority of the votes
in a given constituency. The candidate with the plurality of votes emerges as the eventual winner.
15as is evident from the fact that the average winning margin is around 12
percent which is quite less than the vote shares of these fringe candidates.
Average voter turnout ranges from around 60 to 62 percent. On average,
more than 10 candidates contest in every constituency, in both assembly and
parliamentary elections. However, except the top two candidates most of the
others usually end up forfeiting their monetary deposit due to not achieving a
cutoff threshold of vote shares. For various reasons, around 1 to 3 candidates
withdraw from the race.
Table 2: Summary Statistics
Assembly Election General Election
Mean Standard Deviation Mean Standard Deviation
Total number of registered voters (in ’000) 202.87 88.59 1271.99 316.18
Vote Share Winner 44.04 9.97 46.65 8.42
Vote Share Runnerup 31.80 7.69 35.09 7.34
Vote Share Third and below 24.21 13.74 18.25 12.33
Number of candidates contested 10.59 4.91 11.40 6.15
Number of candidates forfeited deposit 8.33 4.93 9.10 6.11
Number of candidates withdrawn 3.16 4.42 1.50 2.35
Voter Turnout (Poll Percentage) 60.50 13.28 62.08 11.84
Margin Percentage 12.23 11.21 11.47 9.79
163.2 Identification Strategy
Our objective is to identify causal effects of exit poll ban on voter and can-
didate behavior. Ideal identification strategy would be to use experimental
setting like RCT where elections are conducted in all states and some ran-
domly chosen states ban exit polls whereas others dont. As conducting such
experiment is infeasible and impractical, we have to compare states that had
elections just before and just after exit poll ban. However, the issue of se-
lection still persists with such a comparison as these groups of states may
have intrinsically different characteristics either way and hence differences in
mean outcomes may not be entirely attributable to the policy. As a result,
we employ a double difference estimation framework by comparing the same
states from an earlier round of elections to account for preexisting differences.
Additionally, results of exit polls are reported at the end of the day, so it can-
not affect the behavior of voters of single-phase election but it has potential
to affect multi-phase elections. Thus, one source of variation in our identi-
fication strategy is coming from the number of phases in election. Second
source of variation is coming from the fact that this ban came in 2009. After
the ban, result of exit polls were reported after the completion of elections
in all phases. Luckily, the states that went to elections just before and just
after the ban fulfill the phase-criterion as above.
We have used difference-in-difference setup. We run the general form of
the model for constituency c in state s at time t as follows:
17Yct = α + β · alwaysmultic + γ · af tert + δ · (alwaysmultic ∗ af tert )
+ θ1 · Xct + θ2 · Xst + ct , (1)
where the coefficients such as β, γ and δ are all unknown parameters and
epsilon is a random unobserved “error” term which contains all determinants
of Yi which our model omits. The parameter of interest is δ which captures
the true effect of exit poll ban and in our model, alwaysmultii and af teri
are dummy variables so that alwaysmultic = 1 if constituency c is in a state
in which all the election were always multi-phase and af tert = 1 if elections
were held after 2009.
In our model Yct represents outcomes such as vote share of winner, vote
share of runner up and vote share of other fringe candidates. We also look at
outcomes such as number of candidates who contested, withdrew and forfeited
their deposit. Our final set of outcomes include voter turnout and winning
margin. Xct represents constituency level controls such as total number of
registered voters. We additionally control for state specific demographics
such as population , sex ratio, literacy and employment, represented by Xst .
While the state election results may give compelling results for a small
neighborhood around the timing of the legislation, concerns regarding gener-
alizability remain. To address these concerns, we also use data from national
elections in the country (to elect parliamentarians and eventually the prime
18minister) and employ the same identification strategy. The identifying as-
sumption is that in the absence of the ban, outcome trends in multi and
single phase states would have been identical. These results imply that in
the counterfactual i.e. without the exit poll ban vote share of the front-
runner would have been lower and that of the candidates who finish 3rd or
below would have been higher. This is suggestive evidence of underdog voting
because apparently more voters would have been likely to vote for candidates
finishing 3rd and below in the presence of exit polls. As exit polls usually
would predict the front-runners to win (eventual winner or runner up), we
expect underdog votes to vote less for them and hence with exit polls their
vote share are likely to be lower.
4 Results
In this section, we present the main results from the above regressions. First,
we present the estimates of the effect of the exit poll ban on vote shares
of the candidates , for both state and national elections. We then present
an analysis of common pre-trends in outcome in support of our identifying
assumption. Finally, we present results on candidate behavior, turnout and
winning margins.
194.1 State Legislative Assembly Elections
Table 3 reports the estimates of effect of EPB on vote shares of candidates.
It is evident from the table that the vote shares of winner has gone up by
around 3 percentage point and the vote shares of others have gone down
by approximately same magnitude. This is consistent with the idea that
the winners have got the votes at the expense of other contestants. The
insignificant coefficient corresponding to vote share of runner up suggests no
effect of exit poll ban on the vote share of runner up.
Table 3: Impact of Exit Poll Bans on Vote Shares of Candidates - Assembly Elections
Winner Runner-Up Others
δ̂ 0.652 2.921* -2.278*** 0.738 1.781 -2.934*
(1.012) (1.196) (0.778) (0.987) (1.349) (1.461)
Controls No Yes No Yes No Yes
R-squared 0.07 0.18 0.08 0.15 0.12 0.25
Obs 1352 1352 1352 1352 1352 1352
Notes: Voter share data is based on the statistical reports on election to legislative assemblies published by election commission of India. Control
variables include population, sex ratio, literacy , total electors and urban employment. The data for control variables is taken from RBI’s
”Handbook of statistics on Indian Economy”. The δ̂ captures the true effect of treatment (exit poll ban) in difference-in-difference setup. Robust
Standard Errors in parentheses. *** pimplementation of the ban. Additionally, possibility of split-ticket voting and
the fact that state elections are held on different issues compared to national
general elections can affect our findings if the electorate in the states chosen
for the analysis systematically differ in their response to the exit poll ban.
To alleviate these concerns, we shift focus to a more general setting where
we perform a similar analysis with data on 5 national elections in India held
from 1998-2014 and include all states which have not experienced any switch
from single phase to multi phase elections in this time span. Every state
that always had single phase elections form our control group as they would
be usually unaffected by exit polls, since these are only announced at the
end of each polling day. States which have always held elections in multiple
phases form our treatment group as these are affected directly by exit polls
as trends in some constituencies may impact how voters react in subsequent
constituencies.
We exploit state-time variation in the impact of exit poll ban to estimate
the causal effect of this legislation on outcomes of interest. Similar to as-
sembly election, it is evident from the table 4 that the vote shares of winner
has gone up by around 3.5 percentage points and the vote shares of others
have gone down by approximately 5 percentage points. The findings lead to
very similar conclusions drawn from the earlier analysis. It appears that in
the absence of the ban, with prevalence of exit polls, the frontrunner’s vote
share would have been lower and a lot more fringe candidates who eventually
21finish 3rd or below would have been favored. This is suggestive evidence of
underdog voting among the electorate in general.
Table 4: Impact of Exit Poll Bans on Vote Shares of Candidates - General Elections
Winner Runner-Up Others
δ̂ 2.452* 3.504** -0.016 1.264 -2.436 -4.768**
(1.197) (1.286) (0.984) (0.941) (1.449) (1.600)
Controls No Yes No Yes No Yes
R-squared 0.077 0.213 0.08 0.247 0.094 0.311
Obs 1740 1737 1740 1737 1740 1737
Notes: Voter share data is based on the statistical reports on election to legislative assemblies published by election commission of India. Control
variables include population, sex ratio, literacy , total electors and urban employment. The data for control variables is taken from RBI’s
”Handbook of statistics on Indian Economy”. The δ̂ captures the true effect of treatment (exit poll ban) in difference-in-difference setup. Robust
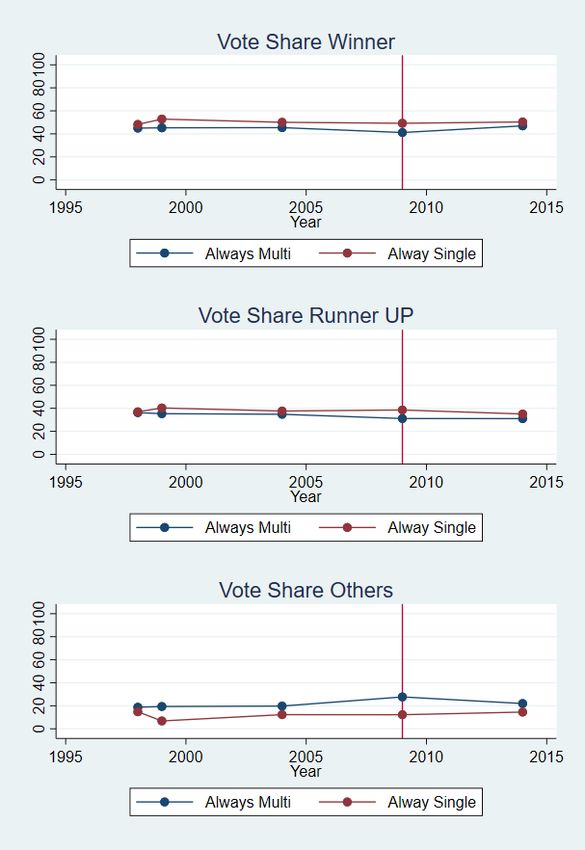
Standard Errors in parentheses. *** ptrends are reported in figure 2. For all outcomes, the mean of the variables
do not seem to be very different over time for the states which have held only
single phase elections to the ones which have had multiple phases of polling.
This provides some support to our identification assumption that any change
estimated post policy, may be attributable to the policy.
Figure 2: Parallel Trends
234.4 Impact on Candidate Behavior
The findings from table 5 is that in response to the exit poll ban more number
of candidates contest and less number of candidates withdraw from the race.
The decision to contest elections in India, in pat, depends on the likelihood
of securing a minimum threshold percentage of votes, failing which the candi-
dates have to forfeit their deposits. A lot of fringe candidates would therefore
depend on the characteristics of the electorate before making such a decision.
If the electorate in general exhibits underdog voting, then it is likely that
with exit polls, a lot more candidates would want to contest elections.
Table 5: Impact of Exit Poll Bans on Candidates’ Decision to Contest - Assembly Elections
Contested Withdrawn Forfeited
δ̂ 3.180*** 1.906*** -1.922*** -1.705*** 3.473*** 2.238***
(0.465) (0.402) (0.329) (0.228) (0.468) (0.407)
Controls No Yes No Yes No Yes
R-squared 0.19 0.44 0.25 0.46 0.20 0.44
Obs 1362 1359 1362 1359 1362 1359
Notes: Data regarding total number of candidates contested for an election , withdrawn nomination from an election and submitted forfeiture
deposits is based on the statistical reports on election to legislative assemblies published by election commission of India. Control variables include
population, sex ratio, literacy , total electors and urban employment. The data for control variables is taken from RBI’s ”Handbook of statistics
on Indian Economy”. The δ̂ captures the true effect of treatment (exit poll ban) in difference-in-difference setup. Robust Standard Errors in
parentheses. *** pdidates to contest and fewer withdrawals. This implies that in the counter-
factual, with exit polls, lesser candidates contest and more withdrawals from
the race. This would only be consistent with the idea that candidates do not
seem to have a sense of the extent of underdog voting in India and perhaps
feel voters follow the bandwagon. Consequently, with the ban, more fringe
candidates become optimistic and decide to run for office.
Unlike State elections, the findings from table 6 show that less number of
candidates are contesting the national elections as a result of the exit poll
ban. This suggests that in the counterfactual scenario in the presence of
exit polls, more candidates would have contested. This implies that some
of the fringe candidates overestimate their probabilities of success when exit
polls are prevalent presumably because they believe that the Indian electorate
would engage in underdog voting.
Table 6: Impact of Exit Poll Bans on Candidates’ Decision to Contest - General Elections
Contested Withdrawn Forfeited
δ̂ -0.641 -1.983* 0.321 -0.123 -0.532 -1.827*
(0.917) (0.873) (0.401) (0.391) (0.907) (0.858)
Controls No Yes No Yes No Yes
R-squared 0.084 0.292 0.03 0.157 0.084 0.281
Obs 1740 1737 1740 1737 1740 1737
Notes: Data regarding total number of candidates contested for an election , withdrawn nomination from an election and submitted forfeiture
deposits is based on the statistical reports on election to legislative assemblies published by election commission of India. Control variables include
population, sex ratio, literacy , total electors and urban employment. The data for control variables is taken from RBI’s ”Handbook of statistics
on Indian Economy”. The δ̂ captures the true effect of treatment (exit poll ban) in difference-in-difference setup. Robust Standard Errors in
parentheses. *** pOn the whole, the results on candidate behavior turn out to be somewhat
inconclusive in terms of their potential expectations about the electorate. The
results seem to be different in terms of state assembly elections and general
elections. One reason for this could be that since constituencies in national
elections are larger in size (comprising on average 7 assembly constituencies),
candidates may potentially overestimate the probability of them being able
to secure enough votes in national elections.
4.5 Voter Turnout and Winning Margins
It is also interesting to study if voter turnout is affected by exit poll ban.
Potentially such an exercise provides some suggestive inference on the source
of the changes in vote shares. Are the vote shares affected by more people
coming in to vote or is it mostly due to switches from people who would have
voted eitherway. Can the potential underdog voter’s decision to participate
in the process be affected by the absence of the exit polls?
As shown in Table 7, voter turnout seems to have increased with the exit
poll ban which means in the counterfactual, when there is no ban, the voter
turnout would be less. This may happen if voters collectively overestimate
the closeness of elections in the absence of exit poll. Column 3 and 4 point
out that Winning margin also increased with the ban of exit polls which
supports this argument further as voters might now want to ensure that
their favorite candidate wins and hence the popular candidate gets higher
26number of incremental votes relative to the runner-up.
Table 7: Impact of Exit Poll Bans on Voter Turnout and Winning Margins - Assembly Elec
Voter Turnout Winning Margin
δ̂ 9.492*** 4.706*** 2.930** 2.183
(0.944) (1.290) (1.194) (1.593)
Controls No Yes No Yes
R-squared 0.41 0.58 0.01 0.03
Obs 1355 1355 1352 1352
Notes: Voter turnout and Winning margin data is based on the statistical reports on election to legislative assemblies published by election
commission of India. Control variables include population, sex ratio, literacy , total electors and urban employment. The data for control variables
is taken from RBI’s ”Handbook of statistics on Indian Economy”. The δ̂ captures the true effect of treatment (exit poll ban) in difference-in-
difference setup. Robust Standard Errors in parentheses. *** pTable 8: Impact of Exit Poll Bans on Voter Turnout and Winning Margins - General Elec
Voter Turnout Winning Margin
δ̂ -3.518* -0.897 2.44 2.186
(1.278) (1.292) (1.639) (1.580)
Controls No Yes No Yes
R-squared 0.08 0.387 0.055 0.089
Obs 1740 1737 1740 1737
Notes: Voter turnout and Winning margin data is based on the statistical reports on election to legislative assemblies published by election
commission of India. Control variables include population, sex ratio, literacy , total electors and urban employment. The data for control variables
is taken from RBI’s ”Handbook of statistics on Indian Economy”. The δ̂ captures the true effect of treatment (exit poll ban) in difference-in-
difference setup. Robust Standard Errors in parentheses. *** pto contest the general elections. As a result, it is not clear whether the can-
didates mispredict their probability of success or the characteristics of the
electorate in general. We also do not find any clear evidence of an impact on
voter turnout. However, winning margins seem to have increases by 2 per-
centage points as a result of the exit poll ban; suggesting that in the presence
of exit poll elections are usually much closer.
29References
Andersen, A. L. and Jensen, T. (2014). Exit polls and voter turnout. Journal
of Theoretical Politics, 26(1):117–134.
Barreto, M. A., Guerra, F., Marks, M., Nuno, S. A., and Woods, N. D. (2006).
Controversies in exit polling: Implementing a racially stratified homogenous
precinct approach. PS: Political Science & Politics, 39(3):477–483.
Battaglini, M., Morton, R., and Palfrey, T. (2007). Efficiency, equity, and tim-
ing of voting mechanisms. American political science Review, 101(3):409–
424.
Best, S. J. and Krueger, B. S. (2012). Exit polls: Surveying the American
electorate, 1972-2010. CQ Press.
Coate, S., Conlin, M., and Moro, A. (2008). The performance of pivotal-
voter models in small-scale elections: Evidence from texas liquor referenda.
Journal of Public Economics, 92(3-4):582–596.
Jackson, J. E. (1983). Election night reporting and voter turnout. American
Journal of Political Science, pages 615–635.
Kennedy, C., Blumenthal, M., Clement, S., Clinton, J. D., Durand, C.,
Franklin, C., McGeeney, K., Miringoff, L., Olson, K., Rivers, D., Saad,
L., Witt, G. E., and Wlezien, C. (2018). An Evaluation of the 2016 Elec-
tion Polls in the United States. Public Opinion Quarterly, 82(1):1–33.
30McAllister, I. and Studlar, D. T. (1991). Bandwagon, underdog, or projec-
tion? opinion polls and electoral choice in britain, 1979-1987. The Journal
of Politics, 53(3):720–741.
McDonald, M. P. and Thornburg, M. P. (2012). Interview Mode Effects: The
Case of Exit Polls and Early Voting. Public Opinion Quarterly, 76(2):326–
349.
Morton, R. B., Muller, D., Page, L., and Torgler, B. (2015). Exit polls,
turnout, and bandwagon voting: Evidence from a natural experiment. Eu-
ropean Economic Review, 77:65–81.
Morwitz, V. G. and Pluzinski, C. (1996). Do polls reflect opinions or do opin-
ions reflect polls? the impact of political polling on voters’ expectations,
preferences, and behavior. Journal of Consumer Research, 23(1):53–67.
Moy, P. and Rinke, E. M. (2012). Attitudinal and behavioral consequences
of published opinion polls. In Opinion Polls and the Media, pages 225–245.
Springer.
Rai, P. (2014). Status of opinion polls. Economic and Political Weekly.
Searles, K., Smith, G., and Sui, M. (2018). Partisan Media, Electoral Predic-
tions, and Wishful Thinking. Public Opinion Quarterly, 82(S1):888–910.
Sudman, S. (1986). Do exit polls influence voting behavior? Public Opinion
Quarterly, 50(3):331–339.
31Taylor, C. R. and Yildirim, H. (2010). Public information and electoral bias.
Games and Economic Behavior, 68(1):353–375.
Ujhelyi, G., Chatterjee, S., and Szabó, A. (2019). None of the above.
32You can also read