WAMU'S OPTION-ARM STRATEGY
←
→
Page content transcription
If your browser does not render page correctly, please read the page content below

∗
                                 WaMu’s Option-ARM Strategy
      “The option–ARM product is the key flagship product for our company.” Kerry Killinger, CEO

Washington Mutual, Inc. (generally known as “WaMu”) called itself “the bank for everyday
people” because it focused on consumers and small-to-medium-sized businesses. With this
strategy, WaMu grew by the end of 2007 to be the nation’s largest savings and loan in both assets
($328 billion) and revenues ($25.5 billion) – see Exhibit 1.1 Headquartered in Seattle, the
company’s history dated back to 1889.

In simple terms, a savings and loan bank borrows (generally from ‘depositors’ or ‘savers’) and
invests the proceeds (generally by lending). The bank pays interest on borrowed money, e.g.,
demand deposits and certificates of deposit (CDs), and earns interest on loans to individuals and
businesses. Bank profits are affected by the “spread” between the borrowing and lending interest
rates. Other things equal, banks make more money when borrowing (deposit) rates are low and
lending rates are high. Banks earn additional revenue by charging fees for “originating” loans.
Banks may also sell their loans or investments to other financial institutions rather than holding
them to maturity. If the proceeds from the sale exceed the book value of the loan or investment,
the bank recognizes a gain on the sale. Thus, WaMu’s sources of revenue include: (1) interest
income generated from loans to customers and investment securities, (2) fees for originating and
servicing loans, (3) gains from loan sales, and (4) fees for other financial services provided to
customers. WaMu’s costs include: (1) interest paid on customer deposits and other borrowing, (2)
losses due to loan defaults, and (3) administrative costs.

Home Loans – the Adjustable Rate Mortgage (ARM) Strategy
Home (mortgage) loans are secured by property and can vary dramatically in their structure
(Exhibit 8). The conventional fixed rate mortgage has a constant monthly payment calculated to
pay off both the loan balance and interest over the term of the loan, which is typically 30 years.
With an adjustable rate mortgage (ARM), the interest rate on the principal balance resets or
‘adjusts’ periodically. ARMs that adjust in less than one year are classified as short-term ARMs
in Exhibit 8. Those that adjust after one year are classified as medium-term ARMs. For example,
the interest rate may start at 5% for five years and then ‘adjust’ at the five-year anniversary to a
new rate based on current market conditions.

∗
  This case was prepared from public sources by Jane Jollineau Kennedy, Deloitte & Touche Professor of
Accounting and Robert M. Bowen, PricewaterhouseCoopers Professor of Accounting – both at the University of
Washington. Revised October 26, 2008.
1
  Savings and loan associations are also called thrift institutions. Thrifts were originally established to promote
personal savings through savings accounts and home ownership through mortgage lending, but now provide a range
of services similar to many commercial banks.
WaMu’s Option-ARM Strategy                                                                            page 2

In 2004 WaMu was under considerable pressure to turn around its lagging mortgage division. A
key initiative, beyond cost control, was to emphasize higher margin products (e.g., loans), most
notably ARMs. In prepared remarks for the 2004 third-quarter conference call, CEO Kerry
Killenger said:
    “We are paying closer attention than ever to product mix to assess our profit by product and
    distribution channels, and exercise stronger controls than ever. The goal is to ensure that we are
    disciplined about originating higher margin product whenever we can. In this market our emphasis is
    ARM product origination, principally for our balance sheet. These ARMs helped the balance sheet to
    grow by $10.3 billion this past quarter.”

The Option-ARM Strategy
During the same third-quarter 2004 conference call, Killinger said “The option–ARM product is
the key flagship product for our company.” The option-ARM is a variation of the ARM that
allows the borrower ‘options’ such as paying the ‘interest only,’ or even making payments that are
less than the interest on the loan. When this latter option is chosen, the principal amount owed by
the borrower increases, which is referred to as “negative amortization” or “neg-am.”

Option-ARMs proved extraordinarily popular during the housing boom. Between April 2004 and
the end of 2007, WaMu underwrote $184.8 billion in option-ARMs and another $9.5 billion in
ARMs that reset within a year. The company also earned fees for bundling these loans and selling
them as mortgage-backed securities.2

As the boom faded in 2006 and 2007, nearly one half of all option-ARM borrowers made
minimum negative amortization payments. Despite booking $1.4 billion of negative amortization
interest revenue in 2007 (Exhibit 3),3 WaMu recorded a net loss for 2007 of $67 million,
compared with a net income of $3.56 billion in 2006. The decline was primarily the result of
significant deterioration in the company’s residential mortgage loan portfolio and a sudden and
severe contraction in secondary mortgage market liquidity for nonconforming residential loan
products such as ARMs.4

Subprime Lending
From the bank’s perspective, “subprime” loans are those made to borrowers who cannot get the
best (prime) rates due to their poor financial position or credit rating. The bank charges a higher
2
  “Mortgage-backed securities (MBS) are debt obligations that represent claims to the cash flows from pools of
mortgage loans, most commonly on residential property. Mortgage loans are purchased from banks, mortgage
companies, and other originators and then assembled into pools by a governmental, quasi-governmental, or private
entity. The entity then issues securities that represent claims on the principal and interest payments made by borrowers
on the loans in the pool, a process known as securitization” (http://www.sec.gov/answers/mortgagesecurities.htm). Mortgage-
backed securities were typically purchased as low-risk investments by institutions such as banks, corporations, and
pension funds.
3
  For example, the journal entry would look something like:
         DR: Cash (A)                                    $x billion
         DR: Loan receivable (A)                      $1.4 billion
                   CR: Interest income (OE - revenue)               $x+1.4 billion
4
  Loans are generally called ‘jumbo’ or ‘non-conforming’ loans when they exceed the loan amounts allowed by
Fannie Mae (Federal National Mortgage Association) and Freddie Mac (Federal Home Loan Mortgage
Corporation) — two government-sponsored enterprises that help facilitate the availability of home loans.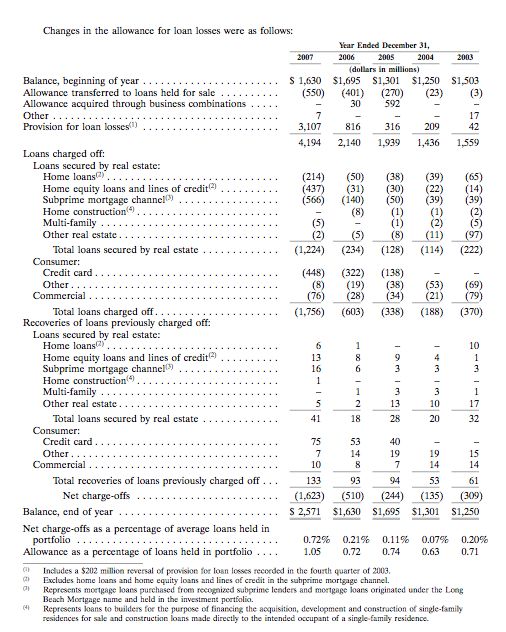
WaMu’s Option-ARM Strategy                                                                         page 3

rate of interest on these loans to compensate for the higher default risk. Although WaMu
appeared to exit the subprime lending business in 2003 when it sold Washington Mutual Finance
to Citigroup, it retained a significant presence in the subprime market through its 1999 purchase of
Long Beach Mortgage. As of early 2008, Long Beach Mortgage was one of the country’s largest
lenders to people with damaged credit. While Long Beach operated in all 50 states except
Mississippi, its largest market by far was California (Exhibit 10).

In 2005, Long Beach Mortgage made more than one-quarter of all WaMu home-purchase loans.
CEO Killinger expressed a desire to see that business grow faster than WaMu’s traditional
mortgage lending because it was more profitable: “We earn better margins in the subprime
business because we’re very efficient and have an advantage over some competitors” (Seattle
Times, Nov. 13, 2005). In prepared remarks for a conference call discussing WaMu’s 2004
results, Senior Vice President and CFO Tom Casey said
    “First, we remain comfortable that we can achieve average asset growth in the 10 to 12% range. While
    we sell a significant portion of our ARM production into the secondary market, we still expect ARM
    retention to be a driver of asset growth. We also expect growth to come from planned increases in the
    home equity, multi-family, and nonprime lending.”

In late 2005, WaMu planned to expand subprime lending along the East Coast taking subprime
mortgages directly to consumers through its retail branches and home-loan offices. Analysts
expressed concern about this strategy, e.g., “I hate the business,” said Richard Bove, an analyst
with Punk, Ziegel & Co. “Asking people who can’t afford to buy something to pay up to buy that
product is a concept that, for me, doesn’t work.” (Seattle Times, Nov. 13, 2005).

Accounting for Loan Losses
When banks lend money, they expect the customer will repay the loan with interest according to
the agreed-upon payment schedule. Inevitably though, some customers fail to meet this obligation
and ultimately default on the loan. Under Generally Accepted Accounting Principles, it is not
permissible for banks to wait until customers default on their loans to recognize uncollectible
accounts. Instead, management must estimate a periodic expense that anticipates loan defaults by
customers. Although management cannot know which customers will not pay, it can make a
reasonable estimate using models that predict loan defaults. The expense that results from this
estimate reduces current period income and is typically called the “provision for loan losses.”5 To
adjust the asset side of the balance sheet for this contingency, banks set up a contra-asset to Loans
Receivable called Allowance for Loan Losses.6 Its purpose is to reduce the balance of the asset,
Loans Receivable, to the amount expected to be collected in the future, i.e., its net realizable
value. Thus the journal entry for the periodic estimate of loan losses is:
    DR: Provision for loan losses (OE)                   xxx
       CR: Allowance for loan losses (contra A)          xxx

5 This expense account is similar to “bad debts expense” or “Uncollectible Accounts Expense” or “Provision for
Uncollectible Accounts” used by non-financial businesses to recognize estimated bad debts.
6
  This contra-asset account is similar to “allowance for doubtful accounts” used by non-financial businesses to
reduce their accounts receivable to the net realizable value.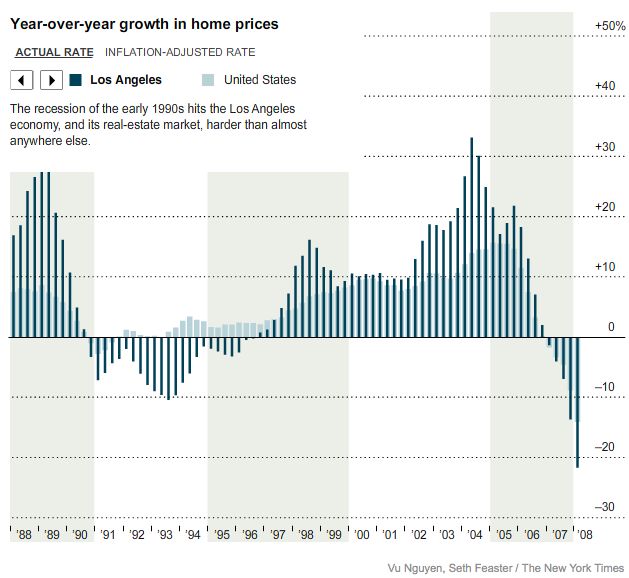
WaMu’s Option-ARM Strategy                                                                    page 4

When an actual customer account is determined to be uncollectible, it is written off against the
Allowance account as follows:
    DR: Allowance for loan losses (contra A)          yyy
       CR: Loans receivable – acct #10101 (A)               yyy

This journal entry removes customer loan #10101 from the books. Note that the expense
associated with this bad debt was recorded when the original provision for loan losses was
estimated, likely in an earlier period.

WaMu described its allowance for loan losses as follows:
    The allowance for loan losses represents management's estimate of incurred credit losses inherent in
    the Company's loan portfolio as of the balance sheet date. The estimate of the allowance is based on a
    variety of factors, including past loan loss experience, the current credit profile of borrowers, adverse
    situations that have occurred that may affect a borrower's ability to meet his financial obligations, the
    estimated value of underlying collateral, general economic conditions, and the impact that changes in
    interest rates and unemployment levels have on a borrower's ability to repay adjustable-rate loans.
    Determining the appropriateness of the allowance is complex and requires judgment by management
    about the effect of matters that are inherently uncertain. The Company maintains a comprehensive
    governance structure and a certification and validation process that is designed to support, among
    other things, the appropriateness of the estimate of the allowance for loan losses. Subsequent
    evaluations of the loan portfolio, in light of the factors then prevailing, may result in significant
    changes in the allowance for loan losses in future periods. 2007 10-K, MD&A, p. 63.

Evaluating WaMu’s mortgage loans
The case questions below put you in the role of a financial analyst attempting to evaluate the
quality of WaMu’s mortgage portfolio and the adequacy of its loan loss provisions.

Figures and exhibits in the case include:
•   Figure 1: U.S. inflation-adjusted Home Prices: 1890 to 2006
•   Figure 2: Percentage change in Los Angeles inflation-adjusted home prices: 1988 – 2008
•   Figure 3: Percentage change in Miami, Florida inflation-adjusted home prices: 1988 – 2008
•   Exhibit 1: Rankings of U.S. Thrifts by (A) assets and (B) revenues, 2007
•   Exhibit 2: Income from continuing operations, 2005-2007
•   Exhibit 3: Balance sheets for the years ended December 31, 2006 and 2007
•   Exhibit 4: Statement of Cash Flows, Operating and Investing Sections
•   Exhibit 5: Statement of Cash Flows, Financing Section
•   Exhibit 6: Loans by category
•   Exhibit 7: Nonperforming Loans (i.e., loans over 90 days past due) and Foreclosed Assets
•   Exhibit 8: Home loans by category (excluding home equity loans and lines of credit)
•   Exhibit 9: Option-ARM Home Loans (excluding subprime loans)
•   Exhibit 10: Geographic Distribution of Option-ARM Home Loans at December 31, 2007
•   Exhibit 11: Unpaid principal balances (“UPB”) of Subprime Home Loans held in portfolio at
    December 31, 2007
•   Exhibit 12: for an analysis of WaMu’s allowance for loan losses.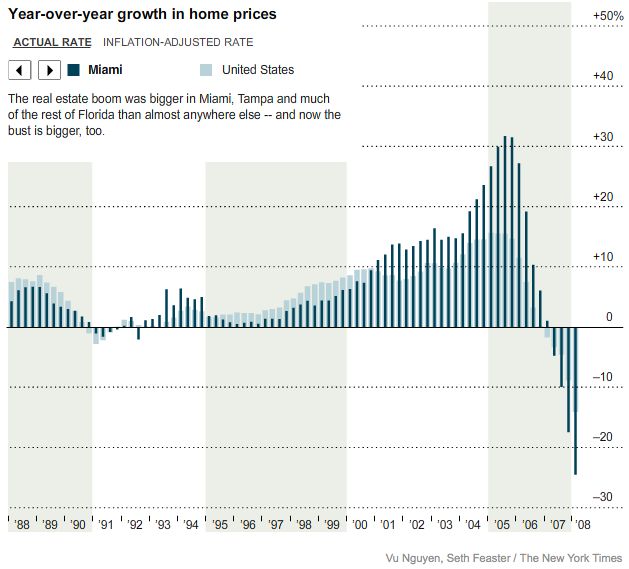
WaMu’s Option-ARM Strategy                                                                           page 5

Questions:
    1. Describe WaMu’s business model. To assist your thinking about this, prepare journal
       entries to record the following hypothetical events:
    2.

         a)   customer deposits $50,000 in a WaMu savings account on 1/1/2008
         b)   WaMu pays 2% (annual) interest on that deposit at 3/31/08
         c)   WaMu lends the $50,000 to another customer for a 8% home equity loan on 1/1/08
         d)   WaMu accrues interest on that loan as of 3/31/08
         How much did WaMu earn in the first quarter of 2008 on this deposit and the
         corresponding loan? What affects this spread?

    2. Consider the data in Exhibit 8 on home loans and Exhibit 9 on option-ARMs. What is
       your assessment of the magnitude and risk of option-ARMs relative to conventional fixed-
       rate loans?

    3. Using data in Exhibit 12, prepare journal entries for 2007 that show the aggregate effect of
       WaMu’s: a) estimate of bad debts, b) charge-offs of loans receivable, and c) recovery of
       previously charged-off accounts.

    4. As an analyst (and trying to avoid hindsight bias), evaluate the quality of WaMu’s loans
       and the adequacy of WaMu’s loan loss estimates. As a basis for analyzing loan losses over
       time, calculate the following ratios for as many years as possible with the data given:
         a. Ratio of non-performing loans to all loans and the ratio of non-performing home loans
            to total home loans. (See Exhibits 6 and 7)
         b. Ratio of the balance in the allowance for loan losses to the balance of non-performing
            loans held in the portfolio.
         c. Ratio of the annual loan charge-offs to the balance of non-performing loans.
         d. Ratio of the annual loan charge-offs to the annual provision for loan losses.
         What is your overall assessment of WaMu’s ability to anticipate loan losses?

    5. [Purely Optional] To understand the mechanics of standard fixed-rate mortgages versus
       ARMs, construct amortization tables for the following loans:
         a. Fixed rate mortgage: $200,000 30-year mortgage at 6% that is paid off fully by equal
            monthly payments over 30 years
         b. Interest-only mortgage: $200,000 30-year mortgage at 6% with ‘interest only’ monthly
            payment (i.e., no principal paid)
         c. Option ARM: $200,000 30-year option-ARM with negative amortization in the first
            five years. Assume the minimum payment is made for the first 24 months.7
         [Hints for above: See the template on Blackboard to get you started. You can use the fill
         command on each spreadsheet once you set it up.]

7
 To calculate this minimum payment, assume that the loan is designed to be paid out monthly over 30 years as if it
accrued 1% interest, i.e., the payment is based on a term of 360 months, an interest rate of .01/12, where the PV is
$200,000 and the FV is $0. Of course, interest is actually accruing at the market rate of 6%.
WaMu’s Option-ARM Strategy page 6 Figure 1 U.S. inflation-adjusted Home Prices: 1890 to 2006 Source: New York Times, August 26, 2006
WaMu’s Option-ARM Strategy                                                     page 7

Figure 2
Percentage change in Los Angeles inflation-adjusted home prices: 1988 – 2008

Source: New York Times, May 28, 2008
WaMu’s Option-ARM Strategy                                                  page 8

Figure 3
Percentage change in Miami, Florida inflation-adjusted home prices: 1988 – 2008

Source: New York Times, May 28, 2008
WaMu’s Option-ARM Strategy                                             page 9

Exhibit 1
Rankings of U.S. Thrifts by (A) assets and (B) revenues, 2007

A. Top Ten U.S. Thrifts by Assets (in $ millions)

Rank             Company                                            Assets
1               Washington Mutual, Inc.                         $327,913.0
2               Countrywide Financial Corp. (1)                  208,366.9
3               Sovereign Bancorp, Inc.                           84,746.4
4               ING Bank, FSB                                     79,986.1
5               E*TRADE Bank                                      51,623.3
6               Hudson City Bancorp, Inc.                         44,424.0
7               Merrill Lynch Bank & Trust Co., FSB               37,832.4
8               IndyMac Bancorp Inc. (2)                          32,734.5
9               New York Community Bancorp, Inc.                  30,579.8
10              USAA Federal Savings Bank                         30,219.5

Source: SNL Financial LC.

B. Top Five U.S. Thrifts by Revenues (in $ millions)1

Rank             Company                                         Revenues
1               Washington Mutual, Inc.                           $25,531
2               Sovereign Bancorp                                    5,011
3               Hudson City Bancorp                                  2,135
4               IndyMac Bancorp                                      2,020
5               New York Community Bancorp                           1,678

1
    Based on an analysis of companies in the Fortune 500.

Source: Fortune.
WaMu’s Option-ARM Strategy page 10 Exhibit 2 Income from continuing operations, 2005-2007
WaMu’s Option-ARM Strategy                                      page 11

Exhibit 3
Balance Sheets for the years ended December 31, 2006 and 2007
Exhibit 4
Statement of Cash Flows, Operating and Investing Sections
WaMu’s Option-ARM Strategy                   page 13

Exhibit 5
Statement of Cash Flows, Financing Section
WaMu’s Option-ARM Strategy   page 14

Exhibit 6
Loans by category
WaMu’s Option-ARM Strategy                                                      page 15

Exhibit 7
Nonperforming Loans (i.e., loans over 90 days past due) and Foreclosed Assets
WaMu’s Option-ARM Strategy                                                 page 16

Exhibit 8
Home loans by category (excluding home equity loans and lines of credit)
WaMu’s Option-ARM Strategy                         page 17

Exhibit 9
Option-ARM Home Loans (excluding subprime loans)
WaMu’s Option-ARM Strategy                                                    page 18

Exhibit 10
Geographic Distribution of Option-ARM Home Loans (excluding subprime loans) at December 31, 2007
WaMu’s Option-ARM Strategy                                                     page 19

Exhibit 11
Unpaid principal balances (“UPB”) of Subprime Home Loans held in portfolio at December 31, 2007
Exhibit 12
Changes in the Allowance for Loan Losses Account, 2003-2007
You can also read