Waste Tire Management at a Crossroads - SOUTH CAROLINA A Special Report Prepared by the - SCDHEC
←
→
Page content transcription
If your browser does not render page correctly, please read the page content below
SOUTH CAROLINA

Waste Tire
Management
at a Crossroads
             A Special Report Prepared by the
   S.C. Department of Health and Environmental Control

                            2022
Introduction                                                                                                                                                                                                 SECTION

South Carolina’s waste tire management
program has been a success story from its
                                                                                                                      Two key challenges are:                                                                     1
beginning in fiscal year (FY) 1994 (July 1, 1993                                                                      1. Significant increased
to June 30, 1994) – with counties recovering                                                                             costs for the collection,
nearly 110 million tires from current generation                                                                         hauling and processing of
and stockpiles of illegally dumped or stored                                                                             waste tires that current
tires across the state.                                                                                                  funding cannot match – resulting in a
                                                                                                                         spiraling price tag for county governments.
The end-of-life management of waste tires was                                                                            In turn, this may limit waste tire collection
addressed with the passage of the S.C. Solid                                                                             services, require moving funding from
Waste Policy and Management Act (Act) of 1991                                                                            traditional recycling programs to offset
(Section 44-96-170). The Act:                                                                                            costs, result in increased storage until
•     Bans the disposal of whole tires in landfills;                                                                     funding is available or disposal; and
•     Requires county governments to manage                                                                           2. Limited markets. Markets such as
      waste tires generated within the county                                                                            tire-derived fuel, crumb rubber and civil
      with collection and enforcement                                                                                    engineering applications are available with
      programs; and                                                                                                      emerging technologies on the horizon, but
•     Places a $2 fee on the purchase of specific                                                                        most current markets are not economically
      new tires to provide funding for the proper                                                                        feasible and/or face resistance from various
      management and recycling of tires. More                                                                            stakeholders. (See “Waste Tire Markets” on
      than $110 million has been allocated to                                                                            page 8 for more details.)
      the program since FY94. (See page 5 for                                                                         This report is designed to provide information
      additional information.)                                                                                        to assist stakeholders in addressing those
Why the special attention? If improperly                                                                              two challenges. It includes tire recovery data
managed, waste tires (also known as scrap                                                                             with cost and funding information as well as a
tires) pose a potential threat to human                                                                               checklist of possible actions for stakeholders
health, safety and the environment. (See “Why                                                                         to consider.
recover waste tires?” on page 2 for additional
information.)                                                                                                         Tires are essential to our lives.

Nearly 30 years later, issues have emerged that                                                                       Proper management of waste tires is just as
threaten the program.                                                                                                 essential.

    Table of Contents
    SECTION 2: Tire Recovery by Counties................................................................................................................................................................................ 2
        Waste Tires Recovered by Tons, Tire Quantity and Per Capita from FY00 to FY21..............................................................................3
        Waste Tires Recovered by Tons and County Leaders from FY10 to FY21....................................................................................................3
        Waste Tire Stockpile Clean-Ups by Tons and Tire Quantity from FY94 to FY22................................................................................... 4
    SECTION 3: Costs and Funding............................................................................................................................................................................................... 5
        Funding for Waste Tire Management from FY10 to FY22.................................................................................................................................. 7
        Grants Awarded to Counties from FY94 to FY23..................................................................................................................................................... 7
        County Government Collection of Waste Tire Fees for FY22............................................................................................................................ 7
    SECTION 4: Waste Tire Markets............................................................................................................................................................................................... 8
    SECTION 5: South Carolina’s Waste Tire Markets....................................................................................................................................................... 10
    SECTION 6: For Your Consideration: Waste Tire Management Checklist.....................................................................................................12

South Carolina Waste Tire Management at a Crossroads                                                                                                                                                                                 1
Tire Recovery by Counties                                                                             SECTION

Counties have reported nearly 110 million
waste tires have been diverted from disposal
                                                             because it is used in
                                                             waste tire rules and
                                                                                                         2
and recovered in South Carolina’s statewide                  regulations in many
program since fiscal year (FY) 1994 (July 1, 1993            states. The new standard
to June 30, 1994). That’s an average of more                 is one ton of waste tires
than 4.2 million waste tires per FY.                         equals 80 tires.
It is important to note that these numbers do        •       It is an industry standard that one waste
not include waste tires sent directly to recyclers           tire is generated per person per year.
and not through county programs.
                                                     •       It is also estimated that one new tire is
Tables on pages 3 and 4 provide historical data              purchased per person per year. Given
including tires recovered by tons and their                  that, South Carolina purchased 5.2 million
tire equivalents from FY00 to FY22, county                   tires and counties reported 3.6 million
leaders from FY10 to FY21 and number of tires                tires recycled in FY21 – giving the state a
recovered in stockpile remediation from FY94                 projected 69.8 percent recycling rate.
to FY22.
Data collection from FY94 to FY99 is
incomplete, but it is estimated that 19.2 million
tires were recovered during those years. While           Why recover waste tires?
reviewing Tables 2.1 to 2.3, it is important to          The risks include:
note the following:
                                                         •     Illegal dumping and stockpiles;
•   South Carolina’s program targets specific
    waste tires generated by residents – car             •     Rainwater accumulation in tire piles
    and truck, motorcycle, bus and tractor                     creates an ideal environment for
    trailer. The program does not target waste                 mosquitoes that can transmit illness;
    tires generated by businesses, but all tires         •     Fire hazards from tire piles. Tire
    must be recycled in South Carolina.                        fires – which are extremely difficult
•   Data is collected from counties – which are                and expensive to extinguish – release
    required by law to report the number of                    toxic air pollutants and can cause
    tires recycled in their jurisdiction to DHEC               rubber to decompose into oil that can
    each FY.                                                   contaminate ground and surface water;
                                                               and
•   The majority of waste tires are recovered
    by retailers when consumers buy new tires.           •     Harm to a community’s reputation and
    Actual tire recovery is higher, but currently              lower property values due to illegal
    there is no process to quantify the amount                 dumping and tire piles.
    of tires recycled by new tire dealers and sent       The benefits include:
    directly to processors.
                                                         •     Protection of human health;
•   This report reflects the longtime industry
    standard that one ton of waste tires equals          •     Reduction of illegal dumping in
    89 tires. In May 2021, the Tire Industry                   abandoned lots, lakes, rivers and
    Association, after conducting a field study                streams, along the side of the road, in
    of waste tires, updated the average weight                 the woods and sensitive habitats;
    for passenger and light truck tires taken            •     Conservation of natural resources; and
    off vehicles from 20 pounds to 25 pounds.
    This figure, known as Passenger and Light            •     Saved landfill space.
    Truck Tire Equivalent (PLTTE), is important

2                                                                South Carolina Waste Tire Management at a Crossroads
Tire Recovery by Counties
  TABLE 2.1: Waste Tires Recovered by Tons, Number of Tires and Per Capita from FY00 to FY21
       FISCAL YEAR                     POPULATION                           TONS                    NUMBER OF TIRES                     PER CAPITA
              2021                                  5,190,705                       40,112.28                   3,569,992.92                             0.70
              2020                                  5,160,174                       39,361.08                    3,503,136.12                            0.68
              2019                                  5,084,127                      45,687.07                     4,066,149.23                            0.80
              2018                                 5,024,369                        35,098.37                    3,123,754.93                            0.62
              2017                                   4,961,119                     40,680.44                     3,620,559.16                             0.73
              2016                                  4,896,146                       61,017.79                    5,430,583.31                              1.11
              2015                                  4,832,482                       51,663.84                   4,598,081.76                              0.95
              2014                                  4,774,839                      45,959.99                     4,090,439.11                             0.87
              2013                                  4,723,723                      48,940.00                    4,355,660.00                             0.92
              2012                                 4,679,230                        45,080.21                    4,012,138.69                            0.86
              2011                                  4,625,364                       37,106.02                   3,302,435.78                              0.71
              2010                                  4,576,446                      55,055.40                    4,899,930.60                              1.07
              2009                                  4,494,435                      28,042.80                    2,495,809.20                              0.55
              2008                                  4,428,393                       53,537.00                   4,764,793.00                              1.08
              2007                                  4,343,204                       82,933.50                    7,381,081.50                             1.70
              2006                                  4,278,134                      62,765.00                    5,586,085.00                              1.37
              2005                                  4,198,068                      62,736.00                    5,583,504.00                               1.33
              2004                                   4,147,152                     27,322.00                    2,431, 658.00                            0.58
              2003                                  4,107,183                      29,774.00                    2,649,886.00                             0.64
              2002                                  4,063,011                      43,836.00                    3,901,404.00                             0.96
              2001                                  4,012,012                      39,256.00                    3,493,784.00                              0.87
              2000                                 3,885,740                        43,136.00                   3,839,104.00                             0.99
            TOTAL                                            ––                 1,019,100.79                  90,699,970.30                                     ––
SOURCE: U.S. Census Bureau and S.C. Solid Waste Management Annual Report
NOTES: Data collected from FY94 to FY99 is incomplete, but it is estimated that 19.2 million tires were recovered. The totals in this table include stockpile
tires recovered, but not tires sent directly to recyclers by new tire retailers.

  TABLE 2.2: Statewide Waste Tires Recovered – Total Tons by FY and County Leaders
  FISCAL YEAR              TOTAL TONS                                                   COUNTY LEADERS BY TONS
       2021                   40,112.28           1) Horry, 5,968.09 – 2) Greenville, 5,596.43 – 3) Charleston – 3,196.06
       2020                  39,361.08            1) Horry, 5,678.58 – 2) Greenville, 4,649.60 – 3) Charleston, 3,007.28
       2019                  45,687.07            1) Aiken, 6,604.92 – 2) Lexington, 4,926.09 – 3) Horry, 4,790.47
       2018                  35,098.37            1) Greenville, 4,079.85 – 2) Horry, 4,000.85 – 3) Charleston, 3,157.61
       2017                  40,680.44            1) Horry, 4,510.17 – 2) Greenville, 4,293.27 – 3) Richland, 3,576.41
       2016                   61,017.79           1) Greenville, 9,923.57 – 2) Horry, 5,647.01 – 3) Charleston, 4,791.00
       2015                  51,663.84            1) York, 8,304.88 – 2) Lexington, 8,007.77 – 3) Greenville, 4,584.18
       2014                  45,959.99            1) York, 9,000.07 – 2) Greenville, 7,713.23 – 3) Horry, 4,342.35
       2013                  48,940.00            1) Greenville, 9,203.55 – 2) Horry, 4,875.56 – 3) Charleston, 3,393.64
       2012                  45,080.21            1) Greenville, 9,256.97 – 2) Horry, 4,296.65 – 3) Charleston, 3,203.49
       2011                  37,106.02            1) Greenville, 7,664.79 – 2) Horry, 3,528.39 – 3) Charleston, 2,577.43
       2010                  55,055.40            1) Richland, 5,702.70 – 2) Greenville, 5,610.90 – 3) Spartanburg, 5,218.60
      TOTAL                 545,762.49                 TOTAL TIRES                 48,572,861.6
SOURCE: S.C. Solid Waste Management Annual Report

South Carolina Waste Tire Management at a Crossroads                                                                                                             3
Stockpile Tire Recovery
Table 2.3: Waste Tire Stockpile Cleanups by Tons and Tire Quantity from FY94 to FY22
FISCAL YEAR TONS NUMBER OF TIRES GRANT
2022 52.83 4,701.87 $15,420.76
2021 8,730.41 777,006.49 $2,054,795.98
2020 434.00 38,626.00 $140,193.83
2019 13,322.44 1,185,697.16 $3,133,626.32
2018 792.41 70,524.49 $212,058.00
2017 1,136.95 101,188.55 $445,540.91
2016 682.46 60,738.94 $144,651.99
2015 264.23 23,516.47 $22,696.77
2014 0.00 0.00 $5,232.00
2013 656.32 58,412.48 $99,686.55
2012 301.30 26,815.70 $48,506.70
2011 111.95 9,963.55 $33,585.00
2010 84.61 7,530.29 $15,605.52
2009 2,329.41 207,317.49 $267,122.79
2008 18.15 1,615.35 $1,862.98
2007 284.46 25,316.94 $51,202.80
2006 0.00 0.00 $0.00
2005 174.30 15,512.70 $22,029.41
2004 65.60 5,838.40 $26,467.00
2003 709.37 63,133.93 $126,718.02
2002 309.89 27,580.21 $30,989.00
2001 4,373.18 389,213.02 $437,318.00
2000 8,228.67 732,351.63 $822,867.00
1999 899.00 80,011.00 $89,900.00
1998 2,105.65 187,402.85 $210,565.00
1997 24,875.27 2,213,899.03 $2,487,527.00
1996 3,895.49 346,698.61 $389,549.00
1995 17,259.39 1,536,085.71 $1,725,939.00
1994 13,229.49 1,177,424.61 $1,322,949.00
TOTAL 105,327.23 9,374,123.47 $14,336,606.33
SOURCE: DHEC
NOTE: No waste tire cleanups were conducted in FY06 or FY14. The funding provided in FY14 was to reimburse a county for the costs of having staff monitor
a site before cleanup.
4 South Carolina Waste Tire Management at a CrossroadsCosts and Funding SECTION
The issue is simple. (based on population) and
through grants from the
3
The funding for the required management of S.C. Department of Health
waste tires is based on an advance recycling and Environmental Control
fee set in 1991. The cost of management (DHEC). See infographics
has increased since then and significantly below and Table 3.1 and Table 3.2 on page 7
in the past few years. The status quo is not for additional information.
sustainable.
• The cost of collecting, hauling and
• Funding to counties for the proper processing tires has increased 53.5 percent
management of waste tires is provided by from fiscal year (FY) 2018 (July 1, 2017 to
a $2 consumer fee placed on the purchase June 30, 2018) to FY23 (i.e., a state average
of specific new tires. The fee is collected of $122.93 to an average of $188.72 per ton).
by the S.C. Department of Revenue (DOR). Even from FY22 to FY23, there was nearly a
In turn, counties receive funding from DOR 21 percent surge in average costs ($156.39 to
$188.72).
• Overall, the average cost for recovering one
Waste Tire waste tire surged from 59 cents in FY10
Grant Funding to $1.70 per tire in FY21 – a 188.5 percent
increase. This does not include a county’s
Since FY94 overhead (e.g., equipment, staffing).
• Current funding cannot meet expenses.
FY23 is the first year that DHEC cannot fund
100 percent of the shortfall allowances (i.e.,
difference between contractor costs and
tire revenue received from DOR, DHEC and
Continued on the following page
Counties May Charge Fees
$51.1 $59.2 $110.3 for Specific Tires
million million million
Grant funding provided Funding provided by Total funding
by DHEC since FY94 DOR since FY94 provided since FY94 Counties are permitted to charge tipping
fees for:
• Heavy equipment tires from farming,
S.C. Average Cost for Hauling/ logging and mining operations;
Processing Waste Tires Per Ton • Tires generated outside of South
Carolina;
• Fleet tires on which there is no
FY23 documentation that a fee has been
FY18 $188.72 paid; and
$122.93
• Unsold tires manufactured in South
Carolina on which no fee has been paid.
NOTE: Currently only 23 counties collect fees. See Table 3.3 on page
7 for additional information.
53.5 PERCENT INCREASE
South Carolina Waste Tire Management at a Crossroads 5any tipping fees that county governments • Increased costs and less funding pose
charge). huge challenges for county budgets. What
will counties do if forced to adjust budgets
• It is important to note the advance and/or programs to manage waste tires?
recycling fee on tires does not apply to new Will funding and/or services be eliminated
car purchases. from traditional recycling programs
(e.g., aluminum/steel cans, cardboard) or
• DHEC and DOR are in discussions to look
difficult-to-manage items (e.g., electronics)?
for possible improvements in reviewing
Several counties already are stockpiling
tire credits claimed by new tire retailers to waste tires as well as considering limiting
DOR. In FY22, DOR reported that new tire collection services and disposal.
retailers claimed about $2 million in tire fee
credits and about $2.3 million in FY21 – the • New property owners ask for funding
two-year equivalent of more than 4.2 million to clean up tire piles (e.g., someone buys
waste tires. property, discovers tires and asks the county
and/or DHEC to pay for the cleanup).
• DHEC is increasing assistance to counties
• Waste tire stockpiles continue to be an
on how to correctly audit the ST-390 forms
issue. Since the program began, more
presented by waste tire haulers for new
than $14.3 million has been allocated for
tire retailers. The county should verify stockpiles with nearly $5.2 million spent
hauler registration, the ST-390 form and on two major cleanups in FY19 and FY21 and
receipt of payment for each load of tires about $455,000 in FY17.
accepted. See Tire Fee Credits below for
additional information. • Will the Bipartisan Infrastructure Law be
an opportunity for funding? The objectives
• New tires weigh more. In May 2021, the of this law are to minimize waste, advance
Tire Industry Association (TIA) updated the pollution prevention, support markets for
average weight for passenger and light truck recycled products and promote a transition
tires from 20 to 25 pounds. The new industry to a circular economy. TIA offers that both
standard of 1 ton of waste tires now equals rubber-modified asphalt and tire-derived
80 tires – down from 89. The end result? It aggregate be included in achieving the
may cost more to manage waste tires. legislation’s goals.
Tire Fee Credits Explained
• The S.C. Solid Waste Policy and Management Act of 1991 (Section 44-60-170 (N)) places
a $2 fee – called the Solid Waste Excise Tax by DOR – on the purchase of specific new tires
(i.e., passenger car/truck, bus, motorcycle, tractor trailer).
• New tire wholesalers or retailers may claim a $1 credit on the ST-390 for every tire
recycled through a DHEC-approved facility and not delivered to a county collection site.
The credit for the number of tires recycled cannot be more than the number of tires sold.
• New tire wholesalers or retailers may not claim a $1 credit if the tires are taken to a
county collection center for free disposal.
6 South Carolina Waste Tire Management at a CrossroadsCounty Funding and Fees TABLE 3.3: Reported Waste
Tire Tipping Fees by County
for FY22
These tables provide a historical review of funding collected
AMOUNT
through the $2 advance recycling fee and provided to counties COUNTY
COLLECTED
for the management of waste tires from FY94 to FY23. In addition, Abbeville $6,148.80
revenue collected by counties for specific tires is provided for the Aiken $7,129.00
past FY. Allendale ––
Anderson $14,399.00
Table 3.1 shows DHEC grant awards that provide funding for Bamberg $898.50
contractor costs, stockpile clean-ups, equipment (e.g., rolloff Barnwell $700.00
containers, concrete pads), public education and professional Berkeley $50,493.00
development. Since FY94, counties have received more than $51 Beaufort ––
million in DHEC grants. Calhoun ––
Charleston $113,688.70
Table 3.2 reflects revenue provided by DOR to county Cherokee ––
governments for the management of waste tires. This revenue Chester ––
is determined by the county’s percent of South Carolina’s total Chesterfield $14,259.50
population. Since FY94, counties have received more than $59 Clarendon $30,272.00
million in DOR funds. Colleton $8,260.92
Darlington $27,570.00
Table 3.3 provides the FY22 revenue collected by counties for
Dillon ––
specific tires. See the infographic on page 5 for more details.
Dorchester ––
Edgefield ––
Fairfield ––
TABLE 3.1: DHEC Grants Awarded to TABLE 3.2: DOR Florence $8,718.94
Counties from FY94 to FY23 Funding Allocated Georgetown $27,158.00
to Counties from Greenville $96,927.00
GRANT GRANT
FY FY FY10 to FY22 Greenwood $447.00
AMOUNT AMOUNT
Hampton $14,187.98
2023 $2,214,302.59 2008 $3,392,499.00 FY DOR ALLOCATION
Horry SWA $101,746.00
2022 $2,085,360.10 2007 $1,927,022.00 2022 $2,861,206.67 Jasper ––
Kershaw $2,935.50
2021 $3,343,126.35 2006 $1,873,945.00 2021 $2,716,886.03
Lancaster ––
2020 $1,993,387.16 2005 $2,361,754.38 2020 $2,959,871.00 Laurens ––
2019 $3,757,554.62 2004 $1,905,403.00 Lee ––
2019 $2,165,301.60
Lexington ––
2018 $2,475,687.48 2003 $2,097,225.00 2018 $2,218,506.49 Marion ––
2017 $2,642,113.23 2002 $2,058,421.00 Marlboro ––
2017 $2,012,792.74
McCormick ––
2016 $861,676.00 2001 $4,114,790.45
2016 $1,983,981.53 Newberry $13,502.22
2015 $1,223,650.00 2000 $2,072,428.00 Oconee $14,795.57
2015 $1,831,687.69
2014 $1,358,094.26 1999 $1,798,080.00 Orangeburg $52,453.50
2014 $1,773,940.90 Pickens ––
2013 $1,531,442.00 1998 $2,039,633.00 Richland $46,465.50
2013 $1,640,714.08
2012 $1,604,902.00 1997 $3,831,262.00 Saluda ––
2012 $1,766,119.22 Spartanburg $51,651.50
2011 $1,309,076.00 1996 $2,234,272.00
2011 $1,822,674.97 Sumter ––
2010 $1,214,150.00 1995 $1,750,557.00 Union ––
2010 $1,698,069.24 Williamsburg ––
2009 $3,889,527.58 1994 $2,017,880.00
TOTAL $27,451,752.17 York ––
TOTAL $51,109,802.90 TOTAL $704,808.13
SOURCE: DOR
SOURCE: DHEC NOTE: DOR’s total allocation SOURCE: DOR
NOTE: This funding does not reflect funding used for of funds is more than $59 NOTE: Reporting comes from counties
the cleanup of waste tire piles. million since FY94. that receive DHEC grants.
South Carolina Waste Tire Management at a Crossroads 7Waste Tire Markets SECTION
Waste tires are one of the nation’s most
recycled commodities.
to grow existing and new
markets.
4
About 76 percent of the waste tires generated Most stakeholders also
nationwide were recycled into automotive agree that waste tires offer
products, mulch for landscaping, tire-derived significant end-use market
fuel (TDF), rubber-modified asphalt (RMA) opportunities in both energy and material
and other products according to the U.S. Tire recovery applications with new technologies
Manufacturers Association’s (USTMA) most being developed.
recent (2019) report.
So what are the markets? The top three
End-of-life markets, however, have become an markets nationwide are TDF, ground rubber
issue. Here are some of the reasons: and civil engineering applications according
to the USTMA’s 2019 report. (See “National
• Waste tires have a negative market value; Markets” for additional information.)
• Many current markets are not economically
feasible and/or are limited by real or
perceived barriers; National Markets
• Markets are not keeping pace with the Here is a national breakdown of the top three
annual generation of waste tires; markets from the USTMA’s 2019 report.
• Transporting, processing and recycling • TDF was the largest end market for recycled
waste tires are expensive – and costs are waste tires accounting for 36.8 percent of
rising; and the total market. TDF is created by reducing
waste tires into rubber chips – usually 1 to 3
• The current largest end market – TDF – is inches in size – that can be used as a viable
declining according to some reports. alternative to fossil fuels and coal in cement
kilns, pulp and paper mills and electric
While each of the market challenges utility boilers.
outlined above is subject to discussion, most
• Ground rubber comprises 24.4 percent
stakeholders agree that steps need to be taken
of the national market. It is produced by
reducing waste tires into small granules.
Reinforcing material (e.g., steel, fiber) are
removed along with contaminants (e.g.,
glass, rock, dust). Ground rubber is used for
FIBER RUBBER new rubber products such as floor mats,
POWDER & railroad ties, portable speed bumps, vehicle
10% GRANULATE
mud guards as well as asphalt paving,
75% playgrounds, sports fields and running
STEEL
WIRE Output tracks.
15% from • Civil engineering applications made
up 5.1 percent of the U.S. market. Waste
Recycled tires are reduced into shreds of different
Tires sizes that can be used in drainage
material applications (e.g., septic systems,
landfill drainage) and permeable fill for
infrastructure (e.g., embankments, bridge
SOURCE: The U.S. abutments).
Tire Manufacturers
Association
8 South Carolina Waste Tire Management at a CrossroadsPossible Solutions USTMA members – which set a goal that all
waste tires enter sustainable end markets – are
The need to expand all economically viable investing in technologies to meet that goal.
and environmentally sound waste tire markets
remains an imperative. They include:
Both the USTMA • Bridgestone is working on turning
and the Tire Industry The U.S. Tire end-of-life tires into new material including
Association (TIA) Manufacturers sustainable synthetic rubber that does not
promote the use of Association’s rely on petrochemicals;
rubber-modified goal is that all
asphalt. The TIA, in fact, waste tires enter • Continental reportedly began using
sees the Bipartisan recycled plastic (PET) bottles this year to
sustainable
Infrastructure Law has make a polyester yarn to replace the virgin
end-use markets.
a potential opportunity material previously used;
for funding RMA and • Michelin has committed to have 100
tire-derived aggregate. In the letter sent to percent of its new tires made from
the Biden administration, the environmental sustainable material by 2050; and
and economic benefits of both products are
highlighted. • Liberty Tire Recycling, the nation’s largest
waste tire recycler and a major processing
Emerging technologies seemingly offer a bright
market for South Carolina, produces
future with the ultimate goal of a circular
recycled rubber for industrial feedstock
economy where material, products and services
for molded products, construction and
remain in circulation for as long as possible.
civil engineering applications, tire-derived
Pyrolysis and devulcanization, for example fuel and mulch for landscaping and
are helping advance the circular economy by playgrounds. The company announced in
converting waste tires into raw material that January 2022 that it will open new facility
can be used in the manufacturing of new tires in Sanford, NC that will produce rubberized
as well as other rubber and plastic products. mulch.
Scrap Tire Market Development Study
Michigan released its study in January 2020 with the goal
of finding the way to transition from managing waste to
creating economic value for waste tires and ultimately a robust
circular tire economy. The report provided recommendations
including:
• Increased use of RMA despite the multiple barriers by using grant funding to spur the
adoption of RMA;
• Discourage grant requests for cleanup in cases where local governments can otherwise
pursue such projects independently;
• Incrementally reduce cleanup grant disbursements and shifting funds to use toward
market development; and
• Develop state and/or regional partnerships to improve the economies of scale.
To view the study, visit michigan.gov/-/media/Project/Websites/egle/Documents/Programs/
MMD/Scrap-Tires/2020-MARKET-STUDY.pdf.
South Carolina Waste Tire Management at a Crossroads 9South Carolina’s Waste Tire Markets SECTION
South Carolina’s 46 counties reported more
than 40,000 tons of waste tires – the equivalent
facility (see Table 5.1 for
additional information);
5
of more than 3.5 million tires – collected for
recycling in fiscal year (FY) 2021 (July 1, 2020 to • Seven facilities that are
June 30, 2021). permitted to burn waste
tires (see Table 5.2); and
That’s more than 9,700 tires each day.
• Forty registered waste tire haulers.
How are waste tires managed in South
Carolina? End markets include: It is important to note that South Carolina does
not have any manufacturers that are using
• Seven approved waste tire recycling and recycled waste tires as a raw material: and
processing facilities with three facilities in
South Carolina, and two each in Georgia South Carolina has a small tire retreading
and North Carolina. Most of South Carolina’s infrastructure that focuses on heavy equipment
waste tires are processed at a North Carolina and industrial clients (including tractor trailer
Table 5.1: Approved S.C. Waste Tire Recycling Table 5.2: S.C. Facilities Approved to Use Waste
and Processing Facilities Tires as a Fuel Alternative
FACILITY LOCATION FACILITY LOCATION
Argos Cement LLC Harleyville, SC Ameresco Federal Solutions Aiken, SC
Junk-A-Way Services LLC Nuberg, GA Argos Cement, LLC Harleyville, SC
Giant Cement Harleyville, SC
New River Tire Recycling LLC Pilot Mountain, NC
Holcim (U.S.), Inc. Holly Hill, SC
Quality Tire Recycling LLC* Jackson, GA
International Paper
Ridge Recyclers* Johnson, SC Georgetown, SC
Georgetown
S.C. Tire Processing LLC Jackson, SC New-Indy Catawba Catawba, SC
U.S. Tire Recycling Inc.* Concord, NC Sylvamo-Eastover Mill Eastover, SC
NOTE: Approved as of April 15, 2022 SOURCE: DHEC NOTE: Approved as of September 11, 2022
*Part of Liberty Tire Recycling SOURCE: DHEC
South Carolina’s Other Tire Story
Mention South Carolina and you think of palmetto trees, beautiful beaches, amazing weather,
delicious seafood or barbecue and more. You should also think tires – particularly new tires.
South Carolina leads the nation in both the production – about 133,000 per day – and export
sale of tires accounting for nearly 40 percent of the U.S. market share according to the S.C.
Department of Commerce.
These tire manufacturers call South Carolina home: Michelin; Bridgestone; Continental; Giti;
and Trelleborg.
10 South Carolina Waste Tire Management at a Crossroadstires), but not passenger tires. Remember, tractor trailer tires are one of the four types of tires that
have the advance recycling fee. The state also has a robust used tire market – larger than most
states according to one industry expert.
The S.C. Department of Commerce’s Recycling Market Development staff conducted a survey of
waste tire processors in Spring 2021 that processed South Carolina-generated tires in FY20. The
purpose of the survey was to learn how tires are used in recycling applications.
Six of seven processors responded to the survey. Here are key
findings:
• A reported 360,948.5 tons of tires were sent to South
Carolina-registered processors in FY20. These numbers are
not exclusively South Carolina tires, but a snapshot of all the
tires that these processors handled in FY20;
• Of that amount, an estimated 22 percent (78,327.79 tons)
were disposed of;
• An estimated 61 percent of the tires processed were
turned into tire-derived fuel (TDF). Other end-use
markets were civil engineering applications (23 percent)
and ground/crumb rubber for new products (14 percent).
• The survey also showed that no ground/crumb rubber
was used in rubber surface or asphalt end-market
applications.
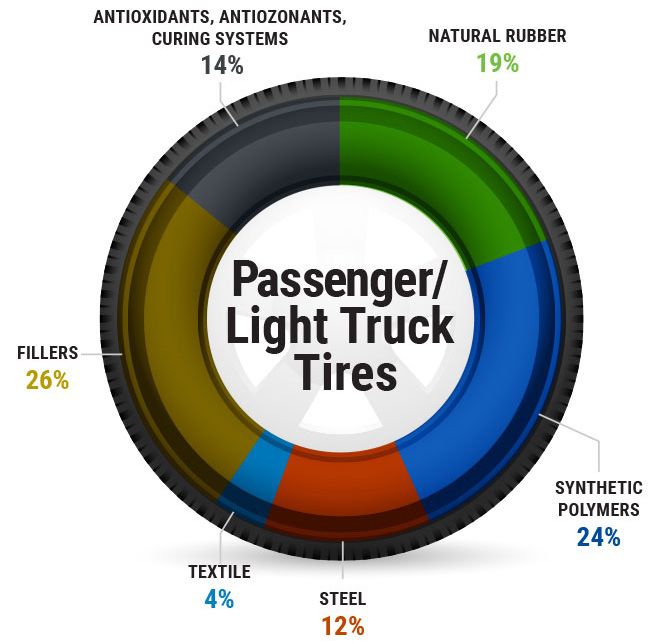
Components of a Typical Passenger Automobile & Truck Tire
SOURCE: The U.S. Tire Manufacturers Association
South Carolina Waste Tire Management at a Crossroads 11For Your Consideration: SECTION
Waste Tire Management Checklist
Here is an opening checklist of possible actions suggested by various stakeholders to
6
address challenges currently facing South Carolina’s waste tire management program.
q Make stakeholders aware of the waste tire m Tire Processors – Look
management issue. for ways to build infrastructure and increase
competition.
q Ask stakeholders to assist in the development
of a realistic plan to address key issues. m Liberty Tire Recycling – Consider partnership
opportunities.
m Waste Tire Committee – Continue leadership
role. q Tire retailers must be advised/reminded on the
proper rebate as required by law.
m S.C. Waste Tire Sustainability Coalition –
Bring work group back. q Address the $2 fee and consider if it should be
increased and/or changed.
m S.C. Asphalt Pavement Association – Open
new discussions on opportunities. q Address the Cap – Currently $150 per ton –
on what local governments can charge for
m S.C. Department of Transportation – Open undocumented tires.
new dicussions on opportunities.
q Encourage county local governments to charge
m S.C. Department of Commerce (DOC) – a fee for the management of undocumented
Continue work on the development of tires.
recycling markets. q Consider state-term contract for tire hauling
m S.C. Department of Revenue (DOR) – Review with the goal of reducing costs.
advance recycling fee collection and q Explore infrastructure grant/funding
distribution process. opportunities from both internal and external
m S.C. Department of Natural Resources stakeholders and other sources including U.S.
– Review process of illegal dumping Environmental Protection Agency solid waste
enforcement and reporting. infrastructure grants.
q Disposal – If tire recovery becomes cost
m S.C. Department of Health and
prohibitive, consider landfill disposal. It must
Environmental Control – Improve
be noted that county governments cannot use
coordination of response to illegal dumping grant funding to pay for disposal costs, but can
and revise reporting data collected from use funds received from DOR for disposal.
haulers and processors.
q Advance Recycling Fee – If tires can be disposed
m PalmettoPride – Review process of litter of, how is the advance recycling fee explained?
control officers role and reporting.
q Paving – Consider setting aside funding to
m U.S. Tire Manufacturers Association – encourage, supplement and implement paving
Continue discussions on current and opportunities.
trending issues, research, best management
q Review reporting of waste tire processors to
practices and any potential funding.
explore ways for improved data collection
m S.C. Tire Manufacturers – DOC to contact and (i.e., numbers collected, type, final disposition,
provide manufacturers realistic summary end-of-life applications, export and more).
of current situation. If South Carolina is the q Consider a waste tire project manager to work
national leader in tire manufacturing and with all internal stakeholders and track and
exports, is potential disposal due to costs an coordinate all agency activities.
option that will be accepted?
q Consider a permanent waste tire work group to
m Cement Kilns – Determine any potential for track and coordinate all agency activities.
increased use as a tire-derived fuel.
q Promote “See It, Report It” campaign designed
m County Governments – Continue outreach on to reduce illegal dumping and other public
the financial situation and best management outreach. Cleanup of illegal tire dumps has had
practices. a devastating effect on tire funds available.
12 South Carolina Waste Tire Management at a CrossroadsWebsites
S.C. Department of
Health and Environmental
Control (DHEC).............................. scdhec.gov
DHEC’s Office of Solid Waste Reduction
and Recycling.............. scdhec.gov/recycle
DHEC’s Tire Recycling
Website.................................. scdhec.gov/tires
PalmettoPride.............. palmettopride.org
S.C. Department of
Commerce (DOC).......... sccommerce.com
DHEC’s Bureau of Land and
Waste Management
Bureau Chief............................... Henry Porter
Assistant
Bureau Chief...................................Juli Blalock
Division of Mining and Solid Waste
Management Director......... Marty Lindler
Editor........................................Richard Chesley
Layout/Graphics.....................Gregg Glymph
CONTRIBUTORS
DHEC.................Woody Barnes, Alex Miller
and Stefanie Vandiver
DOC............... Anna DeLage, April Chaffins
and Ashley Jenkins
PalmettoPride............................... Sarah Lyles
Waste Tire Management at a Crossroads
is published by DHEC’s Office of Solid Waste
Reduction and Recycling.
Printed on RECYCLED Paper
OR-2416 9/22
2022You can also read


