WATER QUALITY IN THE GULF OF FINLAND 2014
←
→
Page content transcription
If your browser does not render page correctly, please read the page content below
WATER QUALITY IN THE GULF OF FINLAND 2014
TRILATERAL ENVIRONMENTAL MONITORING: ANNUAL REPORT

                           Data compiled by Estonian Marine Institute (EMI), Finnish Environment
                           Institute (SYKE), Marine Systems Institute (MSI), and North-West
                           Interregional Territorial Administration for Hydrometeorology and
                           Environmental Monitoring (Hydromet)
                           Craphics by Jan-Erik Bruun (SYKE)
                           Tables by Mika Raateoja (SYKE)
                           Text by Mika Raateoja, with contributions from Kai Myrberg, Heikki
                           Pitkänen, Jouni Lehtoranta and Seppo Knuuttila (SYKE)
                           Planned and assisted by the GOF2014 secretariat

VERSION HISTORY
Date         Version    Comment
05.12.2014   1. draft
11.12.2014   2. draft   Graphics included
21.1.2015    3. draft   New material included
29.1.2015    4. draft   Final version
                        Update to final version: MSI included in the list of institutes responsible
29.1.2015    update
                        of the GOF monitoring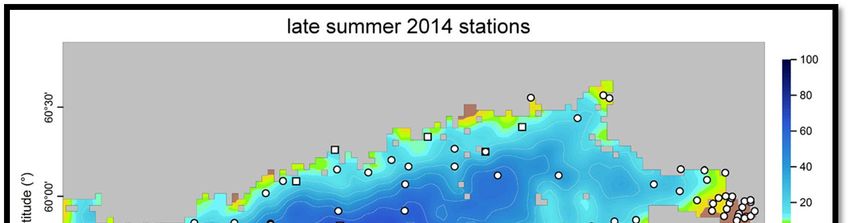
TABLE OF CONTENTS
Introduction ............................................................................................................................................... 3
Monitoring approach .................................................................................................................................. 3
   Responsible institutes ............................................................................................................................. 3
   Monitoring cruises .................................................................................................................................. 3
   Monitored parameters ........................................................................................................................... 3
Results ........................................................................................................................................................ 5
   Late-summer Chl a .................................................................................................................................. 5
   Wintertime DIN ...................................................................................................................................... 7
   Wintertime DIP ....................................................................................................................................... 8
   Deep-water O2 ........................................................................................................................................ 8
Remarks ..................................................................................................................................................... 9
Future steps ............................................................................................................................................. 11
Annex 1. ................................................................................................................................................... 14

                                                                                                                                                                2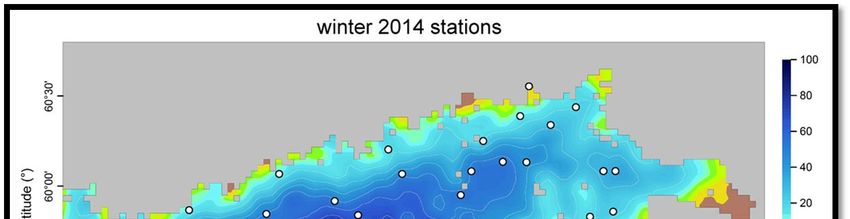
INTRODUCTION
The year 2014 was the 2nd international Gulf of Finland year, the 1st being organized in 1996. As part of
the GOF2014 agenda the riparian countries Estonia, Finland and Russia performed that year an extended
environmental monitoring programme in the Gulf of Finland (GOF). The aim was to get a profound insight
into the current state of water quality and biology of the GOF.
This report summarizes the state of water quality of the GOF. The message of this report is based on a
snapshot to the chemical state of the GOF and is not prepared by the trilateral scientific community. This
report should therefore not be considered as an in-depth assessment of the environmental state of the
GOF. Rather, this report is a progress report of the GOF2014 monitoring activity.
This report is the 1st in the series of the annual monitoring reports of the GOF within the frames of the
trilateral community.

MONITORING APPROACH
RESPONSIBLE INSTITUTES
The data compiled for this report was collected by Estonian Marine Institute (EMI), Finnish Environment
Institute (SYKE), Marine Systems Institute (MSI) and North-West Interregional Territorial Administration
for Hydrometeorology and Environmental Monitoring (Hydromet) as part of HELCOM’s Combine
monitoring programme. This year the monitoring station network was extended (Fig. 1).
MONITORING CRUISES
The actual field data collection was carried out using R/V “Aranda” by SYKE, R/V “Salme” by MSI and EMI,
and R/V “CH 1303B” by Hydromet. The cruise schedule is shown in Table 1.

            Territorial
                             Ship                          Timing of the cruise in 2014
              area
                                        January      April      May1       July      August1     October
                EST         Salme          x           x          x2         x          x2       x (Nov)
                FIN        Aranda          x                      x2                    x2          x2
                RUS       CH 1303B         x3                  x (Jun)                    x         x

           Table 1. The sailing schedules of the research vessels. Remarks: 1: joint survey. Cruise
           timings were as close to each other as possible. During the joint cruises in May/June
           and August, 77 and 92 stations were visited, respectively. 2: extended CTD-station
           network, 3: Aranda took care of the monitoring.
MONITORED PARAMETERS
This report is based on water-sample data. At each station, the sampling depths were chosen and
sampling procedures were carried out according to HELCOM’s COMBINE monitoring manual 1.

1
  HELCOM 2014. Manual for Marine Monitoring in the COMBINE Programme of HELCOM. Baltic Marine Environment
Protection Commission (Helsinki Commission). http://helcom.fi/action-areas/monitoring-and-assessment/monitoring-manual.
426 p.
                                                                                                                     3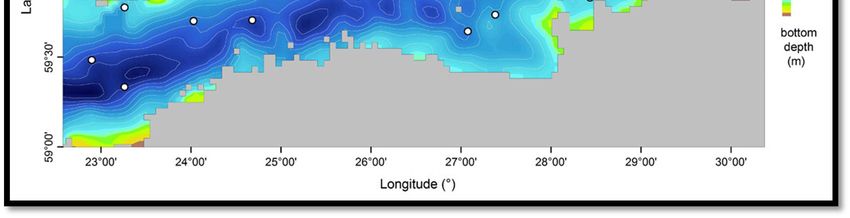
The monitored parameters include physical, chemical and biological analytes. Water physics was probed
with temperature and Secchi-depth. Water chemisty was assessed with nutrients: ammonium (NH3),
nitrite and nitrate sum (NO2+NO3), total nitrogen (TOTN), phosphate (PO4), total phosphorus (TOTP), and
silicate (SiO4), and additionally with dissolved oxygen (O2), hydrogen sulphide (H2S), pH, and salinity.
Biological parameters included Chlorophyll a (Chl a) as well as taxonomy and biomass of phytoplankton,
zooplankton, and benthic animals. From biological parameters only Chl a is assessed in this report.
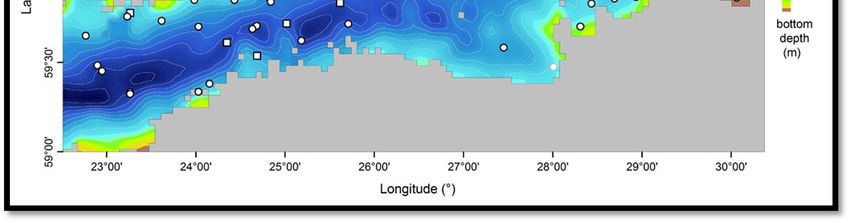
Fig 1. The monitoring stations in the Gulf of Finland year 2014. The nutrient assessment is
based on the wintertime stations (January, above) while the Chlorophyll a and oxygen
assessments are based on the summertime stations (August for Chl a, May/June and August
for O2, below).
Henceworth, the sum of NH3 and (NO2+NO3) will be denoted as DIN (dissolved inorganic nitrogen), and
PO4 will be denoted as DIP (dissolved inorganic phosphate). For information of the analytical performance
4
of the laboratories the reader is advised to get familiar with the report of analytical intercalibrations
carried out amongst the riparian countries in 2013-2014 2. By performing an intercalibration the
environmental laboratories can obtain unbiased information about their analytical performance against
the other participating laboratories. Carried out on board R/V Aranda, the sources of error in the
intercalibration due to sampling and sample handling were minimized by measuring the samples that
were taken simultaneously on board and froze until the measurement.
Since some of the samples for water chemistry and the bulk of the samples for water biology were still
waiting for analysis at the time of the writing of this report, this report summarizes the environmental
state of the GOF by i) the wintertime surface-water nutrient inventory (data from January), ii) the late-
summer surface-water Chl a level (data from August), and iii) the early-summer deep-water oxygen
condition (data from May/June and August). The long-term data was retrieved from the GOF2014
dataset3.

RESULTS
LATE-SUMMER CHL A
The Chl a level serves as a first-order proxy for phytoplankton biomass the increase of which is the 1st
biological consequence of eutrophication process. It ranged typically from 2 to 4 µg/l in the offshore areas
to 3 to 6 µg/l in the coastal areas and the shallow parts of the eastern GOF (Fig. 2, Table 2).

       Fig. 2. Horizontal Chl a map over the GOF in August 2014.
Higher values than these were observed in the inner gulfs of the Finnish coastal area and in the Vyborg
Bay (small scale data; not visualized in Fig. 2). To observe higher Chl a level in the coastal area is normal.
These areas experience most directly the anthropogenic nutrient load, and in case of a scattered

2
   Raateoja et al. 2014. The report of the physical-chemical-biological field intercalibration on sampling and analytical
procedures in the frames of the Gulf of Finland year 2014. http://www.gof2014.fi/wp-content/uploads/2014/08/
Intercalibration-report-Final.pdf.
3
  Trilateral collaboration 2014. Published in electronic format and accessible via SYKE’s ftp-service. Contact the author for more
information.
                                                                                                                                5
archipelago, the slow water exchange and weakly-stratified waters permit the nutrients to be both
available and harvested efficiently for phytoplankton growth.
The long-term averages for the offshore area and the coastal area are roughly 5 and 7 µg/l, respectively
(GOF2014 dataset). In 2014, the general Chl a level was lower than the long-term average in almost every
sub-area of the GOF (Table 3). In the easternmost and north-eastern GOF the gradually declining Chl a
trend is likely to be related to the lately-reduced DIP loading from St. Petersburg and via River Luga.

     Fig. 3. DIN in January 2014. Above: horizontal map over the GOF, below: vertical
     distribution along the center line of the GOF.

                                                                                                      6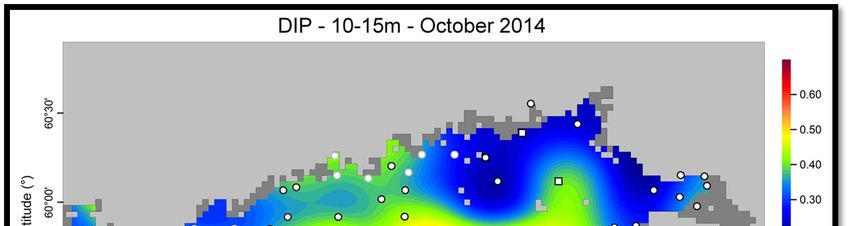
WINTERTIME DIN
DIN and DIP are the primary macronutrients for phytoplankton growth, and hence, their concentrations
are employed as the direct indices for eutrophication / oligotrophication process.

     Fig. 4. DIP in January 2014. Above: horizontal map over the GOF, below: vertical distribution
     along the centre line of the GOF.
The surface layer DIN level ranged typically from 6 to 10 µmol/l in the offshore areas and was slightly
above 10 µmol/l in the coastal areas (Fig. 3, Table 2). Although the most eastern areas were not sampled
there seemed to be a strong tendency for rising DIN levels towards the east indicative of more
pronounced riverine impact. In the areas subject to River Neva outflow, DIN had a typical estuarine two-

                                                                                                      7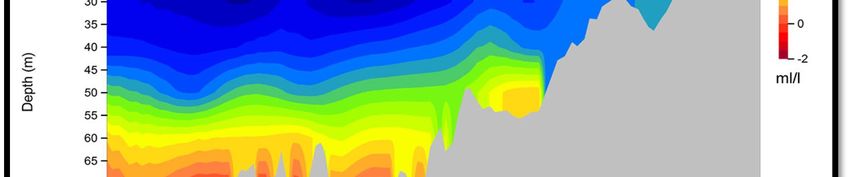
layered distribution with the low-saline and nitrogen-rich surface layer and the deep layer of higher
salinity and lower nitrogen concentration.
In 2014, the general DIN level was higher than the long-term average in almost every sub-area of the GOF
(Table 3). The possible reasons for this – loading, climatic factors, internal processes – must be addressed
thoroughly.
The long-term averages for the offshore area and the coastal area are roughly 7 and 13 µmol/l,
respectively (GOF2014 dataset). In 2014, the general DIN level was higher than the long-term average in
almost every sub-area of the GOF (Table 3).
WINTERTIME DIP
The surface layer DIP level ranged typically from clearly below 0.6 to 0.8 µmol/l in the western offshore
areas to 0.7 to 0.9 µmol/l in the northern parts of the GOF and to about 1 µmol/l in the southern parts of
the GOF (Fig. 4, Table 2). The lowest levels of DIP in the GOF were observed in the westernmost part of
the GOF, affected by the Northern Baltic Proper’s surface water having lower DIP levels compared to the
middle GOF, and in the area subject to River Neva outflow where the DIP concentrations have been
lowered by the intensified purification of St. Petersburg waste waters.
The highest annual DIP values are typically met in the deep layers of the western and middle GOF that are
frequently suffering from oxygen deficiency. From there, the DIP storage mixes to the whole water
volume due to late autumn and winter storms, and as a result, in winter high DIP levels are met also in
the surface layer. In 2014, the deep-water O2 conditions worsened during the spring, and consequently
DIP levels in the deep layers increased considerably towards the summer (data not shown).
The long-term averages for the offshore area and the coastal area are roughly 0.9 and 0.7 µmol/l,
respectively (GOF2014 dataset). In 2014, the general DIP level was lower than the long-term average in
the northern parts and offshore GOF but notably higher in the southern parts of the GOF (Table 3).
In October, the surface nutrient levels were already started to rise up after their summertime exhaustion
(Fig. 5). The highest DIP levels were observed in the southern part of the GOF, probably due to the timing
of the monitoring cruises. Estonia had her cruise three weeks later than Finland and Russia, giving some
room for re-mineralization and vertical wind-induced mixing and, as a result, the introduction of DIP
stocks into the surface layer.
DEEP-WATER O2
The deep-water O2 deprivation is the 2nd order consequence of advancing eutrophication. The more
nutrients there are to utilize, the more phytoplankton biomass we will have. The decomposition of this
increased organic load consumes the deep-water O2 inventory, and O2 problems will follow. In the GOF,
however, the link is not so straightforward. There, the hydrodynamic pressure from the Baltic Proper
plays a notable role for shaping the deep-water O2 condition in the western and middle GOF all the way
to Gogland Island and sometimes beyond that.
The GOF in the summer 2014 was characterized by the poor O2 condition near to the seafloor (Fig. 6,
Table 2). In August, the large bulk of those bottom areas from the mouth of the GOF to the Gogland
Island that were situating at deeper than 70 m, were anoxic. Similarly, those bottom areas that were
situating at deeper than 60 m, were severely hypoxic.
In addition to an unusually large coverage of the hypoxia in the western and middle GOF, the hypoxic
volume of water was record-breaking for a time period of at least since 1997 (the starting year of
Aranda’s LIMS-database). The O2 condition in the open southern seaboard and in the shallow areas of the
eastern GOF was good while at times hypoxic levels were observed in the more scattered Finnish coastal
                                                                                                          8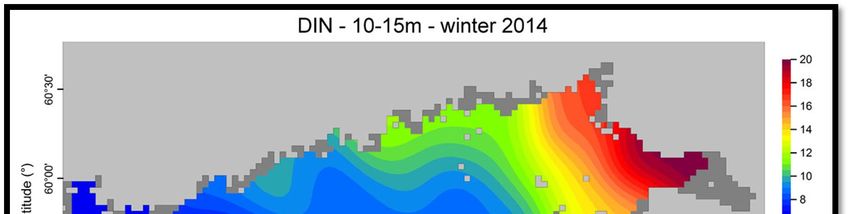
area and in Vyborg Bay. However, oxygen conditions of the local deeps in the Finnish archipelago are in
general better now than about a decade ago.

     Fig. 5. DIN and DIP in October 2014; horizontal map over the GOF. Note the different scales as
     compared to Figs. 3 and 4. The Russian measurements are based on the filtration technique that
     typically lowers the DIP estimate.

REMARKS
An extended monitoring network was carried out in the GOF as part of the Gulf of Finland year 2014. Both
more annual cruises per country (EST) and more station visits per cruise (EST, FIN, RUS) were realized.
Such an extensive annual dataset has been collected only once before, that is, during the 1st Gulf of
Finland year in 1996. This time, however, the annual monitoring dataset is supplemented by the newly-
released GOF2014 dataset comprising the years 1996 to 2013.

                                                                                                      9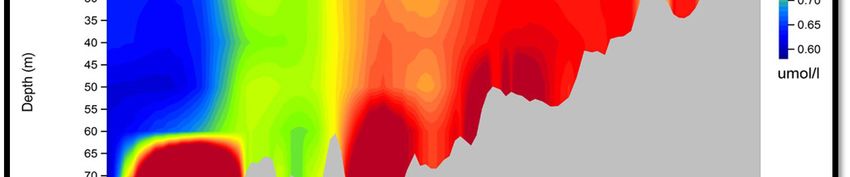
Using PO4 measurements as an index for the expanse of water quality monitoring, together these three
countries took about 1700 water samples as a total number. These samples were sampled at 110 various
stations during 14 cruises. At the time of writing this report the precise expanse of the biological
monitoring of the GOF in 2014 was not yet known due to the large workload required in the analyses of
the samples.

     Fig. 6. O2 in August 2014. Above: horizontal map over the GOF, below: vertical distribution
     along the center line of the GOF. Negative values refer to the occurrence of hydrogen
     sulphide which is the result of anaerobic bacterial metabolism.

                                                                                                   10
The year 2014 for the GOF presented somewhat contrasting environmental set-up. When compared to
the long-term data moderate or low Chl a levels coincided with a poor deep-water O2 condition and
generally increased DIN levels.
While the Chl a pattern suggested lowered phytoplankton biomasses as a result of decreased phosphorus
loading especially in the eastern GOF, the increased DIN levels suggested advanced eutrophication to
have taken place. The reasoning behind the increased DIN will be assessed as a part of the on-going GOF
assessment work.
The poor deep-water O2 condition poses a potential eutrophication threat; this may realize if the
internally-loaded DIP storages will be introduced in the surface layer before the next growth season. In
2014, the abnormally poor O2 condition was mainly a manifestation of a strong environmental pressure
exerted by the horizontal deep-water advection from the Baltic Proper. Consequently, the deep-water
PO4 levels rose up during the spring and summer. First in the spring, this was due to the PO4 storages
advected from the Baltic Proper. Later in the year, the levels were further increased by accelerated
internal phosphorus loading triggered by poor oxygen conditions due to the advected waters.
The year 2014 proved a marked influence of the basin-scale hydrodynamics of the Baltic Proper on the
trophic status of the GOF. The combined effect of the magnitude of the Baltic Proper’s advected water
mass and its poor O2 condition made the entrainment exceptional. However, the phenomenon of this
scale was not totally unheard of; an entrainment of a similar impact took place in 2006, and less severe
situations have been observed in 2003, 2010, and 2013. The unpredictable hydrographic pressure
described here frequently overrides the impact of the changing anthropogenic loading on the
environmental state of the GOF, and makes any nutrient trend-based eutrophication assessment of the
GOF a challenging task.
For PO4 especially, this report shows the central role of the Baltic Proper as the origin of the PO4
introduced in the biogeochemical system of the GOF, either as a direct source or by creating favorable
conditions for internal loading. The environmental conditions of the GOF can thus be improved only to a
limited extent without collaboration of all riparian countries of the Baltic Sea.
FUTURE STEPS
Continuation of the analytical inter-calibrations is important to further clarify the impact of different
analytical techniques employed by the environmental laboratories on our understanding of the
environmental status and dynamics of the GOF.
Continuation of joint surveys is important to yield as holistic and concurrent view over the GOF as
possible and to achieve that on as constant basis as possible.
Clarification of the data exchange procedure and the responsibilities and roles within are needed to
establish a consistent and reliable trilateral databank system.
11Table 2. Water-quality parameters in 2014 for various sub-areas of the GOF: average and min-max in
parentheses (if only one observation only this value is shown). The stations included in the areas are
listed in Annex 1.
O2 early
Chl a DIN DIP O2 late summer
summer
Unit (µg/l) (µmol/l) (µmol/l) (ml/l) (ml/l)
August January January May/June August
Definition: time, depth FIN: 5 m or 0-
close to the close to the
10 m, EST: 5 m,
1m 1m bottom bottom
RUS: 0 m
Number of station visits 59 44 44 47 76
Gulf’s centre line eastwards
H2S atTable 3. Water-quality parameters in 2014 as compared to long-term data. The colouring of the cells refers to the percentage of the ratio of the 2014 average presented in Table 1 to the long-term average. Green:
ANNEX 1. The stations included in the sub-areas of the GOF. Stations 2, 3, and 19 are
found both in Estonia and Russia. They are not the same stations, only named the same
way. In Russia, stations 2, 2*, and 2** all were originally named as “2” but here they are
re-named for clarity. Likewise 1, 1*, and 1**. The exact bearings of the stations can be
found in the GOF2014 database.

       Sub-area                   EST                         FIN                          RUS

    Offshore West                 H1               LL9, LL12, F62, JML, LL11                –
                                                   LL3A, LL5, LL7S, LL7, GF1,
   Offshore Middle             F1,F3,14                                                     –
                                                              GF2
    Offshore East                  –                           –                          2, 3, 4
  Shallow water area
                                   –                           –                19, 20, 21, 22, 1, 24, 26
  of the eastern GOF
                                                                                5, 6, 7, 9, 10, 11, 25, 30,
                                                                                2**, 12, 13, 15, 42, 1**,
      Neva Bay                     –                           –
                                                                                12 , 14, 16, 17, 39, 11 ,
                                                                                         14 , 17
                                                    UUS-10A, UUS-23, 39A,
   FiN coast / outer               –                                                        –
                                                          XIV3, XII3
                                                   KYVY-9, UUS-13, UUS-16,
                                                    Pohjanpitäjänlahti 92,
   FiN coast / inner               –                                                        –
                                                   Vanhankaupunginselkä 4,
                                                     Virolahti 291, KYVY-1
 Area south of Vyborg                              KYVY-11, KYVY-8A, GF6,
                                   –                                             A, 10F, 35F, 33F, 9F5
         Bay                                                F42
                                                                                1*, 2*,    , D, PS, SZ, VS,
     Vyborg Bay                    –                           –
                                                                                             Z
   EST coast / outer    17, 18, 19, 23, 23B, E80               –                            –
                        2, 3, 18A, 57A, 23A, PE,
   EST coast / inner                                           –                            –
                                   PW
      Narva Bay         G, 12C, 15, N12, 38, N8                –                            –
  Luga and Koporye
                                   –                           –                     3K, 6K, 6L, 18L
         Bay

                                                                                                              14
You can also read