WE'RE ABOUT GROWTH Sustaining the future - Sirius Minerals
←
→
Page content transcription
If your browser does not render page correctly, please read the page content below
Sustaining the future.

WE’RE
ABOUT
GROWTH
Investor presentation
November 2017
Sustaining the future.

IMPORTANT NOTICES
This document is produced for information only and not in connection with any            This document contains certain forward-looking statements relating to the business,
specific or proposed offer (the “Offer”) of securities in Sirius Minerals Plc (the       financial performance and results of the Group and/or the industry in which it
“Company”). No part of these results constitutes, or shall be taken to constitute,       operates. Forward-looking statements concern future circumstances and results
an invitation or inducement to invest in the Company or any other entity, and            and other statements that are not historical facts, sometimes identified by the
must not be relied upon in any way in connection with any investment decision.           words “believes”, “expects”, “predicts”, “intends”, “projects”, “plans”, “estimates”,
                                                                                         “aims”, “foresees”, “anticipates”, “targets”, and similar expressions. The forward-
An investment in the Company or any of its subsidiaries (together, the “Group”)          looking statements contained in this document, including assumptions, opinions and
involves significant risks, and several risk factors, including, among others, the       views of the Group or cited from third party sources are solely opinions and forecasts
principal risks and uncertainties as set out on pages 31 to 35 of the Company’s 2016     which are uncertain and subject to risks, including that the predictions, forecasts,
annual report and other risks or uncertainties associated with the Group’s business,     projections and other forward-looking statements will not be achieved. Any recipient
segments, developments, regulatory approvals, resources, management, financing           of this document should be aware that a number of important factors could cause
and, more generally, general economic and business conditions, changes in                actual results to differ materially from the plans, objectives, expectations, estimates
commodity prices, changes in laws and regulations, taxes, fluctuations in currency       and intentions expressed in such forward-looking statements. Such forward looking-
exchange rates and other factors, could have a material negative impact on the           statements speak only as of the date on which they are made.
Company or its subsidiaries' future performance, results and financial standing. This
document should not be considered as the giving of investment advice by any              No member of the Group or any of their respective affiliates or any such person’s
member of the Group or any of their respective shareholders, directors, officers,        officers, directors or employees guarantees that the assumptions underlying such
agents, employees or advisers.                                                           forward-looking statements are free from errors nor does any of the foregoing
                                                                                         accept any responsibility for the future accuracy of the opinions expressed in this
Any Securities offered for sale by the Company will not be registered under the          presentation or the actual occurrence of the forecasted developments or
U.S. Securities Act of 1933 (the “Securities Act”) and may only be offered and sold      undertakes any obligation to review, update or confirm any of them, or to release
pursuant to an exemption from, or in a transaction not subject to, such registration     publicly any revisions to reflect events that occur due to any change in the Group’s
requirements and applicable U.S. state securities laws.                                  estimates or to reflect circumstances that arise after the date of this document,
Unless otherwise indicated, all sources for industry data and statistics are estimates   except to the extent legally required.
or forecasts contained in or derived from internal or industry sources believed by       Any statements (including targets, projections or expectations of financial
the Company to be reliable. Industry data used throughout this document was              performance) regarding the financial position of the Company, any of its subsidiaries
obtained from independent experts, independent industry publications and other           or the Group or their results are not and do not constitute a profit forecast for any
publicly-available information. Although we believe that these sources are reliable,     period, nor should any statements be interpreted to give any indication of the future
they have not been independently verified, and we do not guarantee the                   results or financial position of the Company, any of its subsidiaries or the Group.
accuracy and completeness of this information.
                                                                                         Any statements (including targets, projections or expectations of financial
The information and opinions contained in this document are provided as at the           performance) regarding the financial position of the Company, any of its subsidiaries
date of this document and are subject to amendment without notice. In furnishing         or the Group or their results are not and do not constitute a profit forecast for any
this document, no member of the Group undertakes or agrees to any obligation             period, nor should any statements be interpreted to give any indication of the future
to provide the recipient with access to any additional information or to update this     results or financial position of the Company, any of its subsidiaries or the Group.
document or to correct any inaccuracies in, or omissions from, this document which
may become apparent.

                                                                                                                                                                                   1
Sustaining the future.
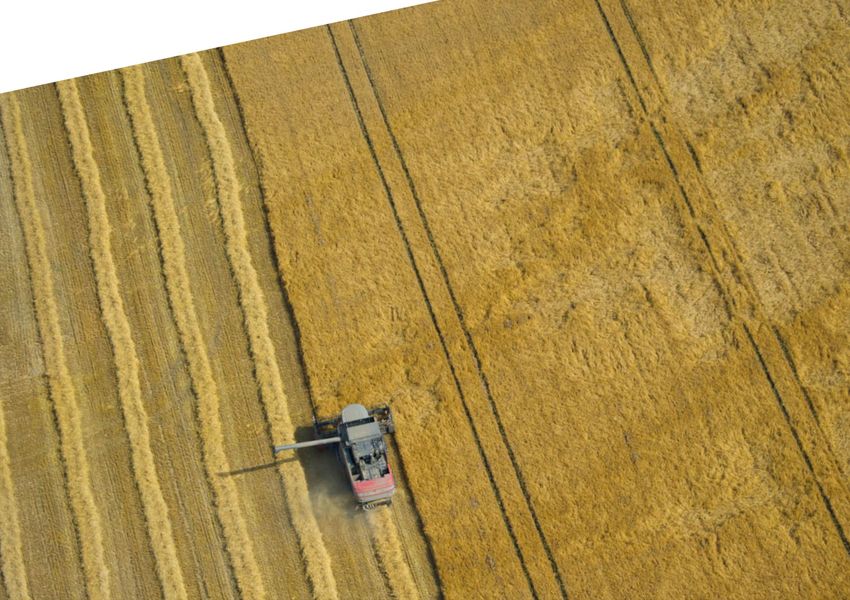
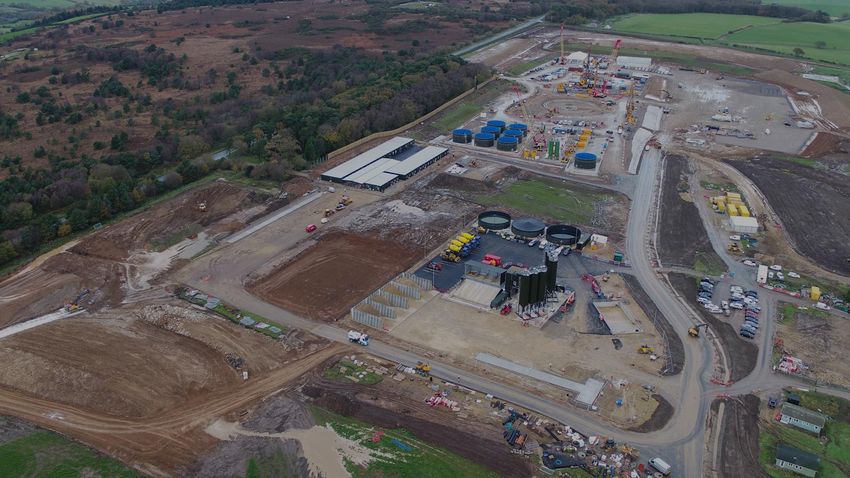
Bentonite plant Service shaft Production shaft
Site offices/Welfare MTS shaft platform
Concrete batch plant
Haul road
2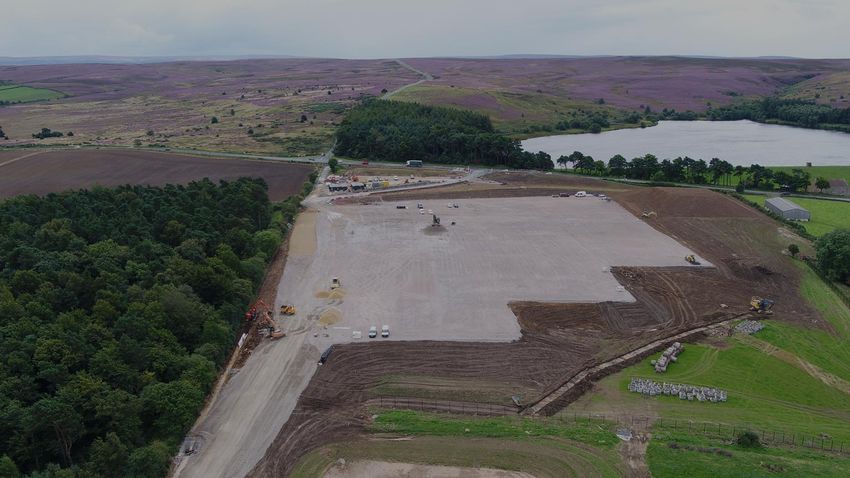
Sustaining the future.

PROGRESS
UPDATE

 Construction                                R&D, sales and                               Corporate &
                                             marketing                                    commercial
 • D Walling activities underway –           • Commercial discussions for new             • The project remains on time and on
   service shaft guide wall construction       agreements in key markets are                budget
   commenced                                   ongoing                                    • Shaft sinking scope formally awarded
 • Concrete batch plant installed            • 178 trials completed and 58 are being        to AMC Ltd
 • Woodsmith site office installed             processed                                  • Stage 2 financing process has
 • Lockwood Beck working platform,           • 9 new trials started in 8 countries on 8     commenced
   drainage and access complete                crops

 2017 milestones                             2017 milestones                              2017 milestones
 • Complete site preparation works at        • Execute incremental offtake                • Seek a premium listing and move to
   Woodsmith and Lockwood Beck                 agreements                                   the Main Board
 • Substantially complete “D wall”           • Expand breadth and depth of                • Preparation work (structuring, due
   installation for production and service     agronomy programme                           diligence) for stage 2 financing
   shafts                                                                                   execution in late 2018
 • Progress design activities for MTS and
   front-end design for harbour and MHF

                                                                                                                                   3
Sustaining the future.

INVESTMENT
PROPOSITION

Unparalleled                                           Disruptive product,                                    Simple and low cost                                     Stage 1 financing
resource                                               proven market                                                                                                  in place
• World’s largest and highest                          • Growing global fertilizer                            • Simple mining and transport                           • Stage 1 financing complete
  grade resource                                         demand                                                 methodology                                             – US$1.2bn
  of polyhalite                                        • POLY4 contains four of the                                                                                   • Stage 2 financing intended
                                                                                                              • Minimal processing
• 37km from deep-water port                              six essential plant nutrients1                         requirement                                             to be 100% debt
• Located in the UK                                    • POLY4 competes with                                  • Lowest cost multi-nutrient                            • Targeting stage 2
                                                         premium fertilizers                                    potassium fertilizer3                                   commitments late 2018
                                                       • 3.6 Mtpa ToP offtake,                                • 70-85% EBITDA margins
                                                         8.1 Mtpa total customer
                                                         commitments2

  2011 - 2012                               2012 - 2015                                Nov 2016                                    2017 - 2021                                2021
  Resource definition and                   Development                                Stage 1 financing                           Construction and                           First polyhalite
  mineral rights                            and approvals                              complete                                    development

                                                                                                                                                                                                              4
Notes: 1) Potassium 14% K2O, sulphur 19% S, magnesium 6% MgO, calcium 17% CaO. 2) 3.6 Mtpa take-or-pay agreements, remainder combination of offtake options, MOUs, FSAs and LOIs. 3) US$233/t FOB cost K 2O
equivalent materially cheaper than next lowest cost product, SOP primary at US$712/t.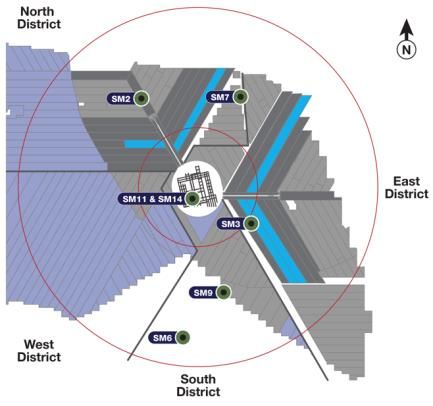
Sustaining the future.

WORLD’S LARGEST & HIGHEST
GRADE POLYHALITE RESOURCE

Located in UK and only 37km
from deep-water harbour facilities

JORC Reserve of 280 million tonnes
and Resource of 2.66 billion tonnes1                                                                           Historical boreholes not drilled
                                                                                                                                                        General area of interest             Mineral transport system
                                                                                                               to depth of polyhalite resource

                                                                                                               Historical boreholes drilled
                                                                                                                                                        Sirius Minerals borehole             Resource area
                                                                                                               through polyhalite

Notes: 1) JORC compliant probable reserve 280m tonnes with a mean grade of 88.4% polyhalite, JORC compliant indicated and inferred resource of 2.66bn tonnes with a mean grade of 85.7% polyhalite.                     5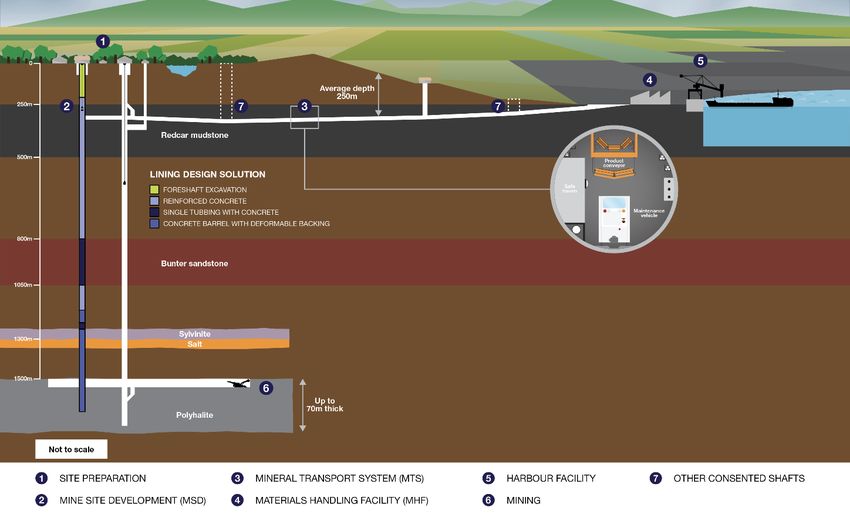
Sustaining the future.

DEVELOPMENT
PLAN
Mining infrastructure designed
to maximise throughput and
long-term opportunity

 World class partners

                    Shaft sinking
                    contractor

                    Tunnelling preferred
                    contractor

                    Partnership with world
                    class mining equipment
                    supplier

                                             6
Sustaining the future.

PROJECT
SCHEDULE
First polyhalite three years after start of main sink

                                  STAGE 1                       STAGE 2           STAGE 2                            FIRST                         10 Mtpa
PROJECT MILESTONES                FINANCING                     FINANCING         DRAWDOWN                           POLYHALITE                    RATE
AND KEY DATES                                                   COMMITTED

CONSTRUCTION                      SITE
                                                                    CONSTRUCTION                                              RAMP UP AND COMPLETION
AND RAMP UP                       PREP

                           2016           2017              2018               2019           2020          2021              2022          2023             2024
                  MSD
SINKING                             SITE PREP AND
                                     D-WALLING                          SHAFT SINKING, TUBBING AND LINING                         FIT OUT
MAIN SHAFTS

                     MTS
SHAFT SINKING                     SITE              SHAFT SINKING                                                       FIT
                                  PREP                                              TBM ASSEMBLY AND TUNNELLING
AND TUNNELLING                                       AND CAVERN                                                         OUT

                  MHF
ENGINEERING,
PROCUREMENT                                                    DESIGN               CONSTRUCTION AND COMMISSIONING
CONSTRUCTION
                 HARBOUR
ENGINEERING,
PROCURMENT,                                                              DESIGN         CONSTRUCTION AND COMMISSIONING
CONSTRUCTION

                                                                                                                                                                    7
Sustaining the future.
FINANCING
SUMMARY
PHASED SOLUTION NEXT STEPS
Stage 1 – US$1.2 billion Stage 2 – 100%
completed 2016 debt financing 1 Execute stage 1 scope of work
Equity Placing and Open Offer - £370m
• The only equity raise contemplated in
Mandated bank group provided
letters of interest prior to stage 1
2 Completion of procurement
the financing plan • Targeting commitments in late 2018
• Moved to the Main board April 2017 • First drawdown expected in 2019
• Subject to commercial deliverables
3 Enter into additional offtake
agreements
Convertible note – US$400m (see below) and credit approval
• 8.5% coupon with first three years’
payments in escrow
• Supported by letter of interest from
HMT UK Guarantee Scheme 4 Prepare lender due diligence
for credit approval
• Seven year maturity
• US$0.31 conversion price (25% premium to
equity placement price
• Listed in Jersey and Frankfurt
Strategic investment – US$300m
• Commitment provided by Hancock
Prospecting Pty Ltd
• US$250m revenue royalty paying 5%
up to 13 Mtpa and 1% thereafter
• US$50m equity (200m shares, determined
by the placement price and prevailing
foreign exchange rate)
8Sustaining the future.
GLOBAL DEMAND
DRIVERS FOR FERTILIZERS
Global demand driven
primarily by food, feed
33%
World population
expected to grow
and fuel demand between 2015 – 20501
53%
Growth in middle class
population between
2020 – 20301
60%
Increase in agricultural
production required
2010 – 20502
Fertilizers are fundamental
to improving agricultural
yields and addressing
63%
-15%
future imbalance between
food demand and supply
Increase in meat demand
Notes: 1) According to United Nations (UN) Population Division. to 130g per day by 20504
2) According to the Organisation for Economic Cooperation and
Development (OECD) to meet rising food demand. 3) According
Reduction in arable land
to the Food and Agriculture Organization (FAO). 4) Protein from 2,100m2 – 1,800m2 per
consumption increase per capita between 2010 – 2050 (FAO).
person by 20503
9Sustaining the future.
THE ATTRACTIONS OF POLY4
Magnesium (MgO)
Potassium (K2O)
A single source of bulk
nutrients as foundation for 6%
effective, efficient, flexible and 14%
sustainable fertilization
POLY4 characteristics
• Straight or as part of Calcium (CaO)
a fertilizer blend
• No negative effect
on soil conductivity
• Low chloride
17%
Micro nutrients: Boron,
• Does not change soil pH Zinc, Manganese,
Selenium, Iron, Copper,
Strontium
19%
Notes: 1) Based on 90% polyhalite grade. Macro nutriednts
basedon w/w5 and micro nutrients based on mg/kg; micro
nutrients’ content: B 169, Zn 1.9, Mn 3.1, Mo 0.3, Se>0.5,
FE>0.5, Cu 1.1, Sr 1414. 2) POLY4 is the trademark name for Sulphur (S)*
polyhalite products from the Sirius Minerals polyhalite project
in North Yorkshire, *48% SO3.
10Sustaining the future.
POLY4 OUTPERFORMS
TRADITIONAL PRODUCTS
NPK blends tested on a wide range of broad-acre and high-value crops
Blend studies ratify POLY4 as an excellent component1 Market opportunity
The current K2O consumption of
chloride-sensitive crops, often
High value Tomato2 +73%
Trials
crops classified as high-value crops,
represents a 101 Mtpa POLY4
230+ Cabbage2 +67%
opportunity
Peanuts3 +42% Corn, soybean, wheat and
Crops
sugarcane alone (broad-acre
Broad acre Corn3 +30%
29 crops crops) represent a 220 Mtpa
Soybean2 +13% POLY4 opportunity4
Countries
Wheat3 +10%
17
Sugarcane3 +9%
Yield Index MOP - T12 POLY4 - T12 Synthetic
POLY4 – T12
Notes: 1) Yield parameters by crop; sugarcane yield, wheat dry weight, soybean fresh weight, corn aerial fresh weight (40 days), peanuts fresh weight, cabbage head weight, tomato yield. Yield gains of POLY4
over MOP T12 NPK blends and T12 NPK synthetic POLY4 made out of SOP, Gypsum, and Kieserite. 2) Field trial. 3) Greenhouse trial. 4) Represents the theoretical POLY4 demand by multiplying the recommended
K2O rates per crop per ha by the global amount of hectares harvested for corn, soybean, wheat and sugarcane. Sources: Durham University, University of Florida, Shandong Agricultural University, IFA, Sirius
Minerals. 11Sustaining the future.
POLY4 SUBSTITUTION
OPPORTUNITIES
Clear opportunity for 20 Mtpa
Estimated potential substitute demand in 20181 (Mtpa of polyhalite equivalent) Sirius capacity4
(Mtpa)
Substitution market growth 2018 –
2025: 376
• 2.2% annual growth rate represents 114
>60 Mtpa demand growth in POLY4 262
equivalent
• >3x the Sirius capacity 178
84
1 macro nutrient
50 34
2 macro nutrients
35 15
3 macro nutrients 20
10 25
4 macro nutrients 5 10
Kieserite SOPM SOP SSP AS MOP-3 MOP-3 Total POLY4
NPK Straight
Multi-nutrient substitution market opportunity represents
more than ten times Sirius’ core infrastructure capacity
Notes: 1) Global demand forecast of primary substitute fertilizer products in 2018 by CRU expressed in polyhalite equivalent. 2) SOP-M demand calculated on MgO equivalent basis which represents 2.8 Mtpa of low
chloride K2O on a polyhalite equivalent basis. 3) Fertecon estimates that 61% of the total K 2O market ends up as part of multi-nutrient fertilizer blends. 4) Expansion phase capacity. 5) Represents the theoretical
POLY4 demand by multiplying the recommended K2O rates per crop per ha by the global amount of hectares harvested for corn, soybean, wheat and sugarcane. Sources: CRU; Sirius Minerals. 12Sustaining the future.
STRONG GLOBAL
DEMAND
4.4 Mtpa of take-or-pay offtake agreements in place
Strategy Offtake profile1 (Mtpa)
• Targeted regional strategy
• Commercial discussions are 1.1 5.5
progressing well
• Long-term offtake agreements
0.75 4.4
(five – ten years) in place
• Majority of pricing mechanisms 0.6
are linked 1.5
1.5
to underlying nutrient value and
product benchmarks (MOP,
SOP, sulphur, magnesium, etc.)
1.5
2
China North Latin SE Asia Total Offtake Total
America America options
Notes: 1) Customer commitments at their respective full volumes. 2) 1.1 Mtpa offtake options represents the options taken by the offtake partners. Source: Sirius Minerals.
13Sustaining the future.
HIGH-MARGIN BUSINESS
DUE TO LOW COST BASIS
Operating cost by area – Area Basis US$m
US$/t of POLY41,2
Mine site development DFS/contractor 977
US$32.6/t US$27.6/t
1
5.8 0.5 Mineral transport system DFS/contractor 857
4.2
10
9.7 Materials handling facility and harbour facility DFS 229
4.7
4.4 Stage 1 and
11.1 8.7 Other infrastructure and facilities DFS 82 2 financing
10 Mtpa 20 Mtpa Owner costs DFS/owner 280
Mining Transportation
Processing Storage and loading
General infrastructure Contingency and escalation DFS 445
Working capital and other DFS 31
Estimated FOB Low chloride cost –
US$/t K2O equivalent3 Total 2,902
Weighted Avg. FOB costs (US$/t of K2O)
Additional ramp-up capital DFS 207
Funded from
233 1173 Incremental capital to 13 Mtpa Owner/DFS 328 operating
932
36 712 cash flow
197 Incremental capital to 20 Mtpa Owner/DFS 1,157
POLY4 SOP SOP SOP-M
Primary Secondary
Cumulative Low chloride K2O fertilizer capacity (‘000tpa)
Lowest cost multi-nutrient potassium producer
Notes: 1) Operating cost based on LoM on a real 2016 basis and 80:20 split of granulated and coarse POLY4 production (excl. sustaining capex and royalties). 2) Includes outsourcing charges associated with mining
equipment, harbour facilities, MHF and a proportion of indirect costs of US$7.2/t and US$4.9/t for 10 Mtpa and 20 Mtpa respectively. 3) Operating costs shown on a real 2016 basis. CRU estimated weighted average
cost for SOP primary, secondary and SOP-M production and capacity (expressed in K2O equivalent) in 2025. POLY4 LoM cost and supply based on 10 Mtpa (US$233/t) and LoM cost 20 Mtpa case (US$197/t). 4) Total
capital funding requirement presented in nominal terms, to be funded by the stage 1 and 2 financing as per the detail set out in the company’s prospectus. Sources: Sirius Minerals, CRU. 14Sustaining the future.
APPENDIX
15Sustaining the future.
SIRIUS BOARD
Russell Scrimshaw Chris Fraser Thomas Staley Louise Hardy
Chairman Managing Director CEO Finance Director CFO Non-executive Director
• Former executive director and deputy • Over 20 years’ finance experience in the • Over ten years’ experience in financing • Non-executive director at Ebbsfleet
CEO of Fortescue Metals Group Ltd and mining industry with a focus on financing and developing resources, energy and Development Corporation , DCLG and
member of the Board 2003-2011. and strategic developments and founder infrastructure projects. Defence Infrastructure Organisation, MoD.
• Former chairman of ASX-listed Cleveland of the Sirius Minerals polyhalite project in • Financing experience across various • With 25-years’ experience in the
Mining Company, Non-Exec Director of North Yorkshire. sources of debt capital (project finance, engineering sector, Louise currently
Genome One Pty Ltd, non-exec director • During his finance career he worked for corporate debt, high yield, export credit) holds a part-time executive role, Civil
of the Garvan Institute, executive KPMG, Rothschild and Citigroup, where and equity in multiple jurisdictions. Engineering UK. Previously she was a
chairman of Torrus Capital Pty Ltd. he was Head of Metals and Mining • Previously responsible for the corporate director at Laing O’Rourke, working
• Held senior executive positions within the Investment Banking for Australia in 2006 governance and financial oversight of as infrastructure director within CLM,
Commonwealth Bank of Australia, Optus and Managing Director in 2008. numerous project development which was the consortium delivery
Communications Pty Ltd, Alcatel, IBM and companies. partner for the Olympic Delivery
Amdahl. Authority for the London 2012 Olympics.
Keith Clarke CBE Jane Lodge Noel Harwerth Lord Hutton of Furness
Non-executive Director Non-executive Director Non-executive Director Non-executive Director
• Previously held CEO roles with WS Atkins • 35 year career in audit at Deloitte where • Formerly COO and chief tax officer of • A member of the Government for 13
plc, the UK’s largest design and she advised multinational businesses in Citibank International with extensive years, including 11 years as a Minister
engineering consultancy for eight years construction, manufacturing, property international banking expertise. and four years serving on the Cabinet.
to July 2011as well as Skanska UK and and house building sectors. • Has sat on a number of boards in a • Lord Hutton was a legal advisor to the
Kvaerner Construction Group. • Jane has served as a non-executive variety of different sectors , including Confederation of Business Industry and a
• Keith has been chair of Tidal Lagoon director on a number of publicly listed mining and finance industry companies. senior law lecturer at Newcastle
(Swansea Bay) Plc and Tidal Lagoon Plc companies, including construction She has been chair of GE Capital Bank Polytechnic.
since September 2014 and September based companies, and she brings with Limited since February 2011, a non- • Lord Hutton joined the Board in January
2015 respectively. her a wealth of experience, particularly executive director of Standard Life Plc 2012. He is Chair or the Remuneration
• Adviser to both Infrastructure UK and in relation to financial governance and since July 2012 and a non-executive Committee.
the Government of Qatar. audit oversight. director of the London Metal Exchange
since December 2012.
16Sustaining the future.
SIRIUS MINERALS PLC CAPITAL STRUCTURE
AS AT 16 OCTOBER 2017
LSE Main Market SXX Options on issue (as at 10 October 2017)
OTCQX SRUXY No. of options Strike Expiry
Market cap £1,234M (27.65p) Directors 17,081,092 29.2p – 43.7p Various
Ordinary shares 4,463M Various mgmt and consultants 23,295,510 10.2p – 34.0p Various
12 month price range 17.25p – 39.06p1 Total options on issue 40,376,602 10.2p – 34.0p Various
Avg daily volume (12M) ~ 31M shares
50
Free float ~ 88%
45
Share Price (GBp) – rebased to Sirius
40
35
Directors’ beneficial interests (as at 6 October 2017)
30
No. of shares % Capital
Chris Fraser 123,747,368 2.78% 25
Minerals
Russell Scrimshaw 43,523,979 0.98% 20
Keith Clarke 852,207 0.02% 15
Thomas Staley 1,135,525 0.03% 10
Jane Lodge 386,953 0.01% 5
Lord Hutton 30,856 0.00%
-
Noel Harwerth 86,482 0.00% Mar-15 Aug-15 Jan-16 Jun-16 Nov-16 May-17 Oct-17
Total director holdings 169,763,370 3.82%
Sirius Minerals Fertilizer Index FTSE 250
Total shares on issue 4,463,105,303
Notes (Sources): as of October 16, 2017 (FactSet). 1) Represents intraday range as opposed to closing prices. 2) Market cap weighted index including CF Industries, OCI NV, PhosAgro, PotashCorp, Mosaic, K+S,
Uralkali, ICL, Compass Minerals, Tessenderlo, SQM, Yara, Agrium, Fertilizantes Heringer. 3) Average option exercise price.
17You can also read