Weekly Technical Review - Union Securities Research Team - Union Securities Switzerland
←
→
Page content transcription
If your browser does not render page correctly, please read the page content below

Weekly Technical Review

Union Securities Research Team
research@unionsecurities.ch

January 26, 2021
Amazon from 1997 to 2009
In 1999, Amazon becomes the biggest online sales platform in the world.
The story: “Soon, we will not only be buying books and CDs online but about every kind of product and services”.

                                                            2005:   Amazon       launches
                                                            Prime membership

January 26, 2021                                                                                                   2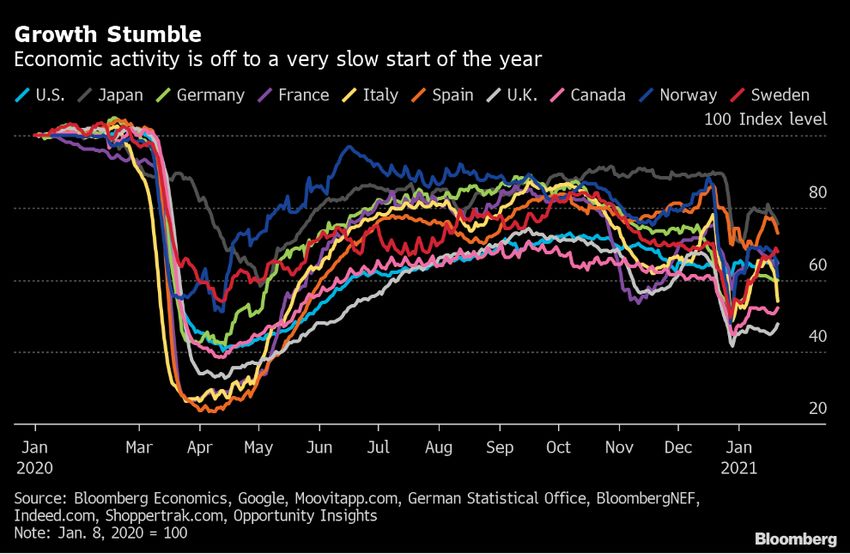
Cisco since 1990
In 2000, Cisco become the most valuable company in the world with a market cap of more than $500bn.
The story: “Globalization and the internet will driven a boom of infrastructure spending for telecom equipment”.

January 26, 2021                                                                                                   3
20%
                                                                40%
                                                                      60%
                                                                            80%
                                                                                   100%

                                                     0%

                   -80%
                          -60%
                                 -40%
                                        -20%
                                        01/12/1995
                                        01/07/1996
                                        01/02/1997

January 26, 2021
                                        01/09/1997
                                                                                  Communications
                                        01/04/1998
                                        01/11/1998
                                        01/06/1999
                                        01/01/2000
                                        01/08/2000
                                        01/03/2001
                                        01/10/2001
                                        01/05/2002
                                        01/12/2002
                                                                                                                                                                                                      Cisco since 1990

                                        01/07/2003
                                        01/02/2004
                                        01/09/2004
                                        01/04/2005
                                        01/11/2005
                                                                                                  Equipment manufacturer in the world.

                                        01/06/2006
                                        01/01/2007
                                        01/08/2007
                                        01/03/2008
                                        01/10/2008
                                        01/05/2009
                                        01/12/2009
                                        01/07/2010
                                        01/02/2011
                                        01/09/2011
                                        01/04/2012
                                        01/11/2012
                                        01/06/2013
                                        01/01/2014
                                        01/08/2014
                                        01/03/2015
                                        01/10/2015
                                        01/05/2016
                                        01/12/2016
                                        01/07/2017
                                        01/02/2018
                                        01/09/2018
                                        01/04/2019
                                        01/11/2019
                                        01/06/2020
                                                                                  The de-trended picture (vs 12Month MA) shows how Cisco (which was already a mature company in 1999) returned to a
                                                                                  “normal behaviour” after the 2000 crash. With a market capitalisation of nearly $200bn, Cisco remains the largest

4

                                        01/01/2021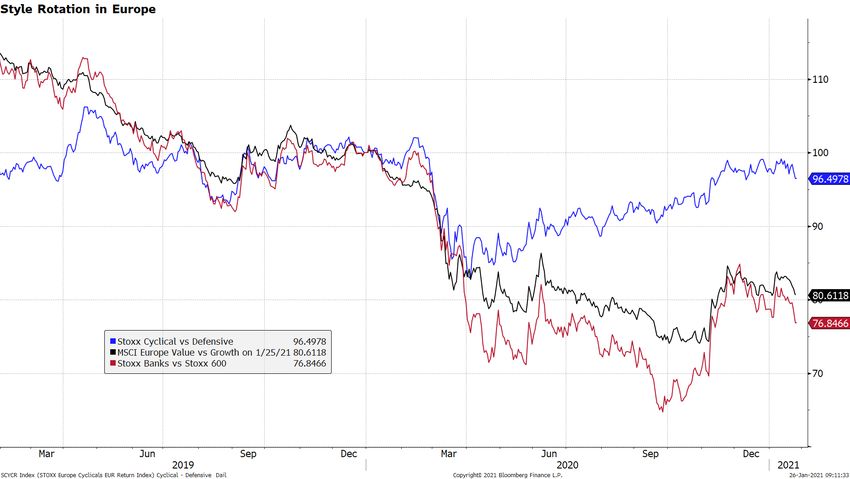
Orange since 1997
In 1997, the French government privatized France Telecom sparking a buying frenzy among French retail investors.
The story: “One day, everybody will have a mobile phone and a broadband internet connection at home”.

                       In August 2000, France Telecom bought Orange
                       Plc from Vodafone and rebranded the whole group.

January 26, 2021                                                                                                   5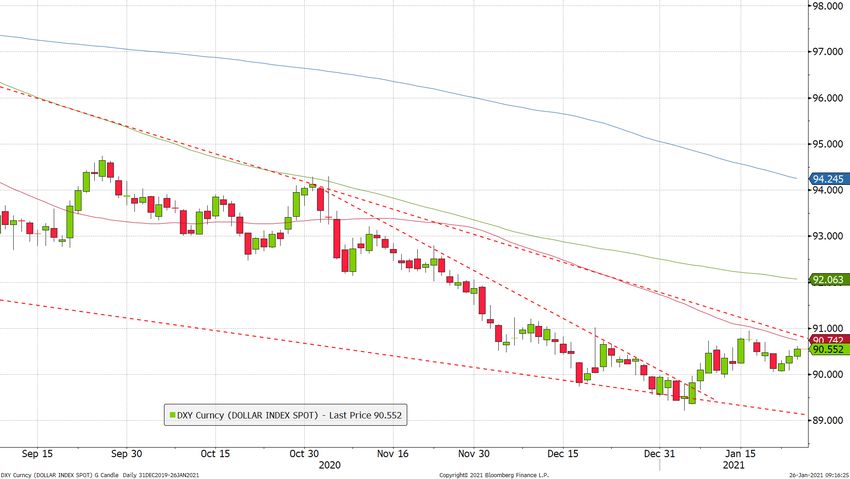
Qualcom since 1992
In 1998, Qualcom spun-off its base station and cell-phone manufacturing businesses to focus on the high
margin patents and chip business.
The story: “The mobile phone industry will boom and devices will offer increasingly complex features requiring
more computing power”.

                                                           2007: Apple launches the first iPhone

January 26, 2021                                                                                                 6
Microsoft since 1992 Even Microsoft, a good quality company with a large client base and a relatively stable business lost 2/3 of its value following the dot-com bubble. January 26, 2021 7
This time it’s different… and nothing can go wrong
Citi Research "Euphoria/Panic" index …

January 26, 2021                                     8
This time it’s different… and nothing can go wrong
The Goldman Sachs index of non-profitable Tech stocks is going ballistic. According to the US bank, negative
earnings firms account for 16% of equity trading volumes, exceeding the 15% share in 2000.

January 26, 2021                                                                                               9
This time it’s different… and nothing can go wrong
And the GS index of the most shorted stocks in the US is clearly showing a huge short squeeze for investors
trying to arbitrage this.
Yesterday, we learned that hedge fund manager Melvin Capital had to be bailed out by Citadel and other funds
or prop desks have probably been crushed.

January 26, 2021                                                                                               10
This time it’s different… and nothing can go wrong
Short interest is reaching a multi years low meaning that when the market goes down those natural buyers will not be here.

January 26, 2021                                                                                                             11
GameStop - Today

                                                                          2021: Short sellers get wiped out. Citron
                                                                          research is trolled, attacked and harassed
                                                                          online (see CEO comment below)

                                    2007:   new   offers            to
                                    download games online

                              2020: The company starts buying back its own shares and some
                              activist investors bet on the turnaround of the company. Bullish
                              analysts put target prices as high as $16.

“What Citron has experienced in the past 48 hours is nothing short of shameful and a sad commentary on the state of the investment community.
We will no longer be commenting on GameStop, not because we don’t believe in our investment thesis, but rather the angry mob who owns this
stock has spent the past 48 hours committing multiple crimes that I will be turning over to the FBI, SEC and other governmental agencies. This is not
just name-calling and hacking but includes serious crimes such as harassment of minor children. We are investors who put safety and family first,
and when we believe this has been compromised, it is our duty to walk away from a stock”.

January 26, 2021                                                                                                                                  12
Volkswagen in 2008 Please remember that short squeezes can be extremely violent but stocks always come back to their fundamental value at some point. January 26, 2021 13
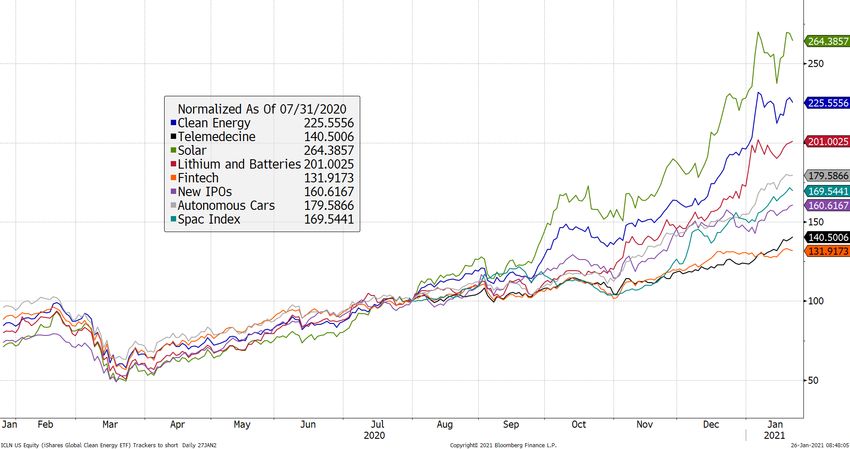
This time it’s different… and nothing can go wrong
The graph below show a selection of Thematic ETFs and Baskets since July 2020. Most of those thematic basket are actually
based on two of our favourite trends: The Digital Disruption and the Green Transition… but sadly, valuation on many stocks
has become irrational.

January 26, 2021                                                                                                       14
Asset Classes – Performance per Year

                                               2021     2020    2019     2018    2017    2016     2015  2014   2013    2012     2011    2010    2009    2008      2007
US Equities       S&P 500                     2.7%    18.4%    31.5%    -4.4%   21.8%   12.0%    1.4%  13.7% 32.4%    16.0%    2.1%    15.1%   26.4%   -37.0%    5.6%
                  Russell 2000                9.6%    19.9%    25.5%   -11.0%   14.6%   21.3%    -4.4%  4.9%  38.8%   16.4%    -4.2%   26.8%   27.1%   -33.8%    -1.6%
                  NASDAQ 100                  4.6%    48.9%    39.5%    0.0%    33.0%   7.3%     9.8%  19.4% 36.9%    18.3%    3.6%    20.1%   54.6%   -41.6%   19.2%
Global Equities   MSCI World                  2.6%    16.5%    28.4%    -8.2%   23.1%   8.2%     -0.3%  5.6%  27.4%   16.6%    -5.0%   12.4%   30.9%   -40.3%    9.7%
                  MSCI ACWI                   3.4%    16.8%    27.3%    -8.9%   24.7%   8.5%     -1.8%  4.8%  23.5%   16.8%    -6.8%   13.3%   35.5%   -41.8%   12.3%
                  EuroStoxx 50                0.2%     -2.6%   29.4%   -11.3%   9.9%    4.8%     7.3%   4.9%  22.7%   19.6%   -13.1%   -1.8%   27.0%   -41.8%   10.4%
                  Stoxx 600                   1.6%     -1.4%   27.9%   -10.1%   11.4%   2.6%    10.2%   7.8%  21.5%   18.9%    -8.0%   12.3%   33.4%   -43.4%    2.9%
                  FTSE 100                    2.8%    -11.4%   17.2%    -8.8%   12.0%   19.2%    -1.4%  0.7%  18.7%   10.0%    -2.1%   12.7%   27.4%   -28.3%    7.4%
                  SMI                         2.1%     4.3%    30.2%    -7.0%   17.9%   -3.4%    1.1%  12.9% 23.9%    19.1%    -4.6%   1.2%    22.1%   -33.0%    -1.4%
                  Topix                       2.4%     7.4%    18.1%   -16.0%   22.2%   0.3%    12.1% 10.3% 54.4%     20.9%   -17.0%   1.0%    7.6%    -40.6%   -11.0%
Emergings         MSCI China                  15.0%   29.0%    23.0%   -18.7%   55.6%   1.2%     -7.7%  8.3%   4.0%   22.9%   -18.3%   5.1%    62.7%   -51.1%   66.6%
                  Bovespa                     -1.4%    2.9%    31.6%   15.0%    26.9%   38.9%   -13.3% -2.9% -15.5%   7.4%    -18.1%   1.0%    82.7%   -41.2%   43.6%
                  MSCI Emerging Markets       9.2%    18.5%    18.8%   -14.3%   37.8%   11.8%   -14.6% -2.0% -2.3%    18.6%   -18.2%   19.2%   78.9%   -53.2%   39.7%
Bonds             Euro Aggregate Bond Index   -0.2%    4.0%    6.0%     0.4%    0.7%    3.3%     1.0%  11.1%   2.2%   11.2%    3.2%    2.2%    6.9%     6.2%     1.4%
                  Euro 1-3Y Bond Index        -0.1%    0.2%    0.4%     -0.2%   -0.1%   0.6%     0.6%   1.8%   2.0%   5.0%     2.3%    1.7%    5.8%     5.8%     3.6%
                  US Aggregate Bond Index     -0.5%    7.5%    8.7%     0.0%    3.5%    2.6%     0.5%   6.0%  -2.0%   4.2%     7.8%    6.5%    5.9%     5.2%     7.0%
                  US 1-3Y Bond Index          0.0%     3.1%    4.0%     1.6%    0.9%    1.3%     0.7%   0.8%   0.6%   1.3%     1.7%    2.6%    5.0%     4.6%     6.7%
                  US High Yield               0.5%     7.1%    14.3%    -2.1%   7.5%    17.1%    -4.5%  2.5%   7.4%   15.8%    5.0%    15.1%   58.2%   -26.2%    1.9%
Commodities       CRB Index                   4.0%     -9.7%   9.4%    -12.4%   0.7%    9.3%    -23.4% -17.9% -5.0%   -3.4%    -8.3%   17.4%   23.5%   -36.0%   16.7%
                  Gold                        -2.5%   25.1%    18.3%    -1.6%   13.5%   8.1%    -10.4% -1.4% -28.3%   7.1%    10.1%    29.6%   24.4%    5.8%    30.9%
                  WTI Crude Oil               8.7%    -20.5%   34.5%   -24.8%   12.5%   45.0%   -30.5% -45.9% 7.2%    -7.1%    8.2%    15.1%   77.9%   -53.5%   57.2%
                  Dollar Index                0.7%     -6.7%   0.2%     4.4%    -9.9%   3.6%     9.3%  12.8%   0.3%   -0.5%    1.5%    1.5%    -4.2%    6.0%     -8.3%
Hedge Funds       HFRX Hedge Fund Index       1.1%     6.8%    8.6%     -6.7%   6.0%    2.5%     -3.6% -0.6%   6.7%   3.5%     -8.9%   5.2%    13.4%   -23.3%    4.2%

 January 26, 2021                                                                                                                                                 15
Bitcoin Bitcoin remains volatile and overbought and is now losing momentum with a strong resistance at 38’000. It rebounded on 30’000 so far but we expect further pullback to the $22’000-$’25’000 range that would offer a great opportunity to jump in. January 26, 2021 16
Bitcoin & S&P 500
Bitcoin and the S&P 500 (shown in a log scale for more clarity) tend to be both linked to risk aversion and have
similar turning point.

January 26, 2021                                                                                              17
S&P Futures - Daily
The S&P 500 remains in a tight trading range and is facing some headwinds in 2021 including of course its very
high valuation. We recommend to keep a neutral position as the earnings season is unfolding.

January 26, 2021                                                                                            19
Nasdaq 100 - Daily
The Nasdaq is in a similar pattern with an even higher valuation, especially on some highly speculative stocks.
It attempted a break out ahead of a big week in terms of publication but remains so far within its range.

January 26, 2021                                                                                             20
FAANGs - Daily
FAANGs are making new highs ahead of a batch of major publications this week (Microsoft, Apple, Tesla,
Facebook, Visa,…).

January 26, 2021                                                                                    21
US Banks - Daily
US Banks confirmed their reversal and are dragging value stocks down in a sign that the market starts to take
into account some downside risks to the economy.

January 26, 2021                                                                                           22
Global Activity
Bloomberg indices see a new drop of economic activity following the Christmas break.

January 26, 2021                                                                       23
Large Tech stocks
                                 Market Cap in $Bn        50D   100D   200D   The table shows the distance of a
S&P 500 Information Technology   $               9'228    -6%   -10%   -17%
Apple Inc                        $               2'428   -13%   -16%   -27%
                                                                              number of tech indices and large
Microsoft Corp                   $               1'722    -5%    -6%   -10%   tech and media stocks to their
Amazon.com Inc                   $               1'680    -5%    -5%   -11%   moving average (expressed as a
Alphabet Inc                     $               1'299    -8%   -13%   -19%   potential downside).
Tesla Inc                        $                 832   -26%   -39%   -56%
Facebook Inc                     $                 792    -2%    -3%   -10%   Most of the large Tech stocks
Visa Inc                         $                 481    5%     3%     -1%
                                                                              remains well above their long
NVIDIA Corp                      $                 341    -4%    -4%   -18%
Mastercard Inc                   $                 323    4%     3%     -2%
                                                                              term trend with some significant
PayPal Holdings Inc              $                 296   -12%   -18%   -27%   downside risk.
Netflix Inc                      $                 249   -10%   -10%   -14%
Adobe Inc                        $                 228    1%     1%     -6%
salesforce.com Inc               $                 208    2%     6%     -7%
ASML Holding NV                  $                 196   -16%   -24%   -29%
Accenture PLC                    $                 167    0%     -5%   -12%
SAP SE                           $                 129    -2%    8%    13%
Zoom Video Communications Inc    $                 116    -1%    8%    -18%
ServiceNow Inc                   $                 107    -3%    -7%   -18%

January 26, 2021                                                                                             24
Russell 2000 - Daily US Small Caps continue to grind higher, with a signification contribution YTD from highly valued stocks or stocks caught in a short squeeze such as Plug Power, Game Stop, 3D Systems, Bed Bath & Beyond,… January 26, 2021 25
Russell 2000 – Debt-to-EBITDA
Among signs that the market is too complacent, we note that the credit quality of US small caps has declined
sharply in 2020 as measured by the ratio of Debt to EBITDA.

January 26, 2021                                                                                          26
EuroStoxx 50 - Daily
The EuroStoxx is still hovering around 3’600 amid rising risks of more lockdowns for longer in Europe and a
negative impact on the economy. Stay tuned.

January 26, 2021                                                                                         27
EuroStoxx 50 – 240 minutes
Over the very short term, the EuroStoxx broke out of its two weeks trading range.

January 26, 2021                                                                    28
Style rotation in Europe
The reversal of value and cyclical stocks seems to point to higher risks of a double dip recession.

January 26, 2021                                                                                      29
Europe vs US
This rotation towards growth stock stopped the relative rebound of European stocks versus the US.

January 26, 2021                                                                                    30
Nikkei – Weekly
The Nikkei remains in the 27’500-30’000 range. We see a strong resistance at 24’000 that can be used as a
barrier level to sell puts on the index.

January 26, 2021                                                                                       31
MSCI China – Weekly
China’s economy is outperforming the rest of the world during the pandemic and Chinese stocks are confirming
their major breakout.

January 26, 2021                                                                                          32
MSCI Emerging – Weekly
The MSCI Emerging Tracker is also making a major breakout amid a broad based rally (Korea, Mexico, Brazil,
Poland, …).

January 26, 2021                                                                                        33
Risk Appetite and Extreme Price Actions
Our Risk Appetite Index remains in a risk appetite level. Once again, a number of risky assets (Bitcoin,
Emerging Equities, Semis, High Yield, etc…) are at very high levels and are at risk of some profit taking.
2 4000
3800
1
3600
0
3400
Sep-18
Nov-18
Jan-19
Feb-19
Mar-19
Apr-19
Jul-19
Nov-19
Mar-20
Sep-19
Jan-20
Feb-20
Apr-20
Jul-20
Sep-20
Nov-20
Jan-21
Aug-19
Aug-20
Oct-18
Dec-18
Jun-19
Oct-19
Dec-19
Jun-20
Oct-20
Dec-20
May-19
May-20
3200
-1
3000
-2
2800
2600
-3
2400
-4
2200
-5 2000
Risk Appetite Index S&P 500
January 26, 2021 34The US Long Bond The US Long bond held on its support level and is likely to rebound further especially if risk aversion returns. This resistance level is important as a drop below 169-167 would be negative for equities especially for those with a distorted valuation. January 26, 2021 36
US Corporate Bonds
Investment Grade bonds in the US (in blue) have outperformed High Yield bonds thanks to their higher
duration (9.8 vs 3.7) amid a falling bond yields environment. The rebound of bonds yields is affecting
Investment Grade bonds first but should also weight on higher risk bonds at some point.

January 26, 2021                                                                                    37
US High Yield
US High Yield credit spreads remain tight and do not reflect the decreasing quality of issuers, the upcoming
boom of bankruptcies in 2021 and the risks facing the economic recovery. Be cautious

January 26, 2021                                                                                          38
The Dollar Index - Daily
The Dollar Index failed to break its intermediate resistance at 91 and retested 90. We still expect a rebound to
92 as a first target.

January 26, 2021                                                                                              39
The Dollar Index - Monthly
On a longer term picture the Dollar Index remains close to a major support level.

January 26, 2021                                                                    40
The EUR/USD - Daily
The Euro rebounded on its 50D MA but investors continue to rebuild Dollar positions (see next page).
A close below the 50D moving average would clear the path to a 1.19/1.185 target.

January 26, 2021                                                                                       41
Emerging Currencies
A number of emerging currencies are turning around (BRL, MXN, RUB) as can been seen in the JPM Emerging
Currencies Index.

January 26, 2021                                                                                     42
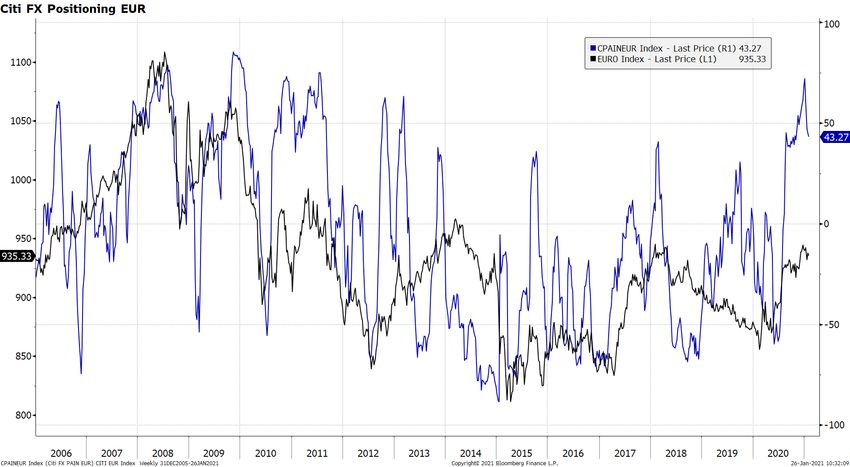
Citigroup EUR Positioning Index
Indices confirm a reversal of positioning on the Euro -> Stay tuned .

January 26, 2021                                                        43
Gold – Daily
Gold continues to hover around its 200 days moving average with little direction.

January 26, 2021                                                                    44
Gold – Monthly
On a long term picture, Gold is coming from a nearly 10 years correction and has the potential to make a $900
breakout in the coming months with a $2’750 to $3’000 target.

January 26, 2021                                                                                           45
Gold & S&P 500
On an even longer term picture we see that the value Gold to the S&P 500 is very low and has ample room to
rebound.

January 26, 2021                                                                                        46
Silver – Daily
Silver is in a similar short term pattern and is hovering over its 100D and 50D MAs.

January 26, 2021                                                                       47
Crude Oil
WTI Crude Oil failed to break its $54.5 resistance and may weaken along with risky assets. Long term, we
believe that structural imbalances between supply and demand will support prices.

January 26, 2021                                                                                      48
Copper
Copper remains supported by supply/demand imbalances. Shorter term, it could pullback along with other risk
assets but now has a very strong support level at about $320.

January 26, 2021                                                                                         49
CRB Commodity Index
The CRB index failed to break resistance level as expected. It should pause for now as the index is overbought
but it should ultimately break out in 2021 as the global economy recovers.

January 26, 2021                                                                                            50
Contacts
                       CONTACT US

                                Union Securities Switzerland S.A.
                                     Address
                                     11 Cours de Rive
                                     1204 Geneva, Switzerland

                                     Let’s Talk
                                     research@unionsecurities.ch

                                     Want to know more about us ?
                                     www.unionsecurities.ch

                   Union Securities Switzerland SA is a FINMA-registered Securities Dealer.

January 26, 2021                                                                              51
Disclaimer
Investment research – Risk information: USS researches are prepared and published by Union Securities Switzerland SA (regulated by FINMA in Switzerland) “USS”.
The investment views have been prepared in accordance with legal requirements designed to promote the independence of investment research.
This material is for your information only and is not intended as an offer, or a solicitation of an offer, to buy or sell any investment or other specific product. Certain services and
products are subject to legal restrictions and cannot be offered worldwide on an unrestricted basis and/or may not be eligible for sale to all investors. All information and opinions
expressed in this material were obtained from sources believed to be reliable and in good faith, but no representation or warranty, express or implied, is made as to its accuracy or
completeness (other than disclosures relating to USS). All information and opinions as well as any forecasts, estimates and prices indicated are current as of the date of this report,
and are subject to change without notice. The market prices provided in performance charts and tables are closing prices on the respective principal stock exchange. The analysis
contained herein is based on numerous assumptions. Different assumptions could result in materially different results. Opinions expressed herein may differ or be contrary to
those expressed by other business areas or divisions of USS as a result of using different assumptions and/or criteria.
In no circumstances may this document or any of the information (including any forecast, value, index or other calculated amount ("Values")) be used for any of the following
purposes (i) valuation or accounting purposes; (ii) to determine the amounts due or payable, the price or the value of any financial instrument or financial contract; or (iii) to
measure the performance of any financial instrument including, without limitation, for the purpose of tracking the return or performance of any Value or of defining the asset
allocation of portfolio or of computing performance fees. By receiving this document and the information you will be deemed to represent and warrant to USS that you will not use
this document or otherwise rely on any of the Information for any of the above purposes or otherwise rely upon this document or any of the information.
Opinions expressed herein may differ or be contrary to those expressed by other business areas or divisions of USS, as a result of using different assumptions and/or criteria. USS
and any of its directors or employees may be entitled at any time to hold long or short positions in investment instruments referred to herein, carry out transactions involving
relevant investment instruments in the capacity of principal or agent, or provide any other services or have officers, who serve as directors, either to/for the issuer, the investment
instrument itself or to/for any company commercially or financially affiliated to such issuers. At any time, investment decisions (including whether to buy, sell or hold securities)
made by USS and its employees may differ from or be contrary to the opinions expressed in USS research publications. Some investments may not be readily realizable since the
market in the securities is illiquid and therefore valuing the investment and identifying the risk to which you are exposed may be difficult to quantify. USS relies on information
barriers to control the flow of information contained in one or more areas within USS, into other areas, units, divisions or affiliates of USS. Futures and Options trading is not
suitable for every investor as there is a substantial risk of loss, and losses in excess of an initial investment may occur. Past performance of an investment is no guarantee for its
future performance. Additional information will be made available upon request. Some investments may be subject to sudden and large falls in value and on realization you may
receive back less than you invested or may be required to pay more. Changes in foreign exchange rates may have an adverse effect on the price, value or income of an
investment. The analyst(s) responsible for the preparation of this report may interact with trading desk personnel, sales personnel and other constituencies for the purpose of
gathering, synthesizing and interpreting market information. Tax treatment depends on the individual circumstances and may be subject to change in the future. USS does not
provide legal or tax advice and makes no representations as to the tax treatment of assets or the investment returns thereon both in general or with reference to specific client's
circumstances and needs. We are of necessity unable to take into account the particular investment objectives, financial situation and needs of our individual clients and we would
recommend that you take financial and/or tax advice as to the implications (including tax) of investing in any of the products mentioned herein. This material may not be
reproduced or copies circulated without prior authority of USS. Unless otherwise agreed in writing USS expressly prohibits the distribution and transfer of this material to third
parties for any reason. USS accepts no liability whatsoever for any claims or lawsuits from any third parties arising from the use or distribution of this material. This report is for
distribution only under such circumstances as may be permitted by applicable law. Forecasts and estimates are current only as of the date of this publication and may change
without notice. USS manages conflicts and maintains independence of its investment views and publication offering, and research and rating methodologies. Additional information
on the relevant authors of this publication and other USS publication(s) referenced in this report; and copies of any past reports on this topic; are available upon request from your
sales representative.
External Asset Managers / External Financial Consultants: In case this research or publication is provided to an External Asset Manager or an External Financial Consultant,
USS expressly prohibits that it is redistributed by the External Asset Manager or the External Financial Consultant and is made available to their clients and/or third parties.
Important notice USA: This document is not intended for distribution into the US, and/or to US persons, by USS personnel.
January 26, 2021 52You can also read