Using DEA Method to Measure and Evaluate Tourism Efficiency of Guangdong, Guangxi and Hainan Provinces in the South of China - A case of the Beibu ...
←
→
Page content transcription
If your browser does not render page correctly, please read the page content below
International Journal of Advanced Smart Convergence Vol.10 No.1 24-37 (2021)
 http://dx.doi.org/10.7236/IJASC.2021.10.1.24

 IJASC 21-1-3

Using DEA Method to Measure and Evaluate Tourism Efficiency of Guangdong,
           Guangxi and Hainan Provinces in the South of China
             - A case of the Beibu Gulf Urban Agglomeration-

                                         1
                                             Xiao-Chuan Wang, 2Hyung-Ho Kim
        1
            Doctoral Student, Graduate School of Business Management, Sehan University, Korea
                                            451551734@qq.com
              2
                Professor, Department of Air Transport and Logistics, Sehan University, Korea
                                            hhkim@sehan.ac.kr

                                                           Abstract
    China's "One Belt and One Road" initiative has brought multiple opportunities to the development of tourism
in Guangdong, Guangxi and Hainan provinces and the implementation of the Beibu Gulf Urban Agglomeration
Development Plan has set clear goals for further accelerating the coordinated development, in-depth cooperation
of the three. This study takes the Beibu Gulf Urban Agglomeration as the research object and utilized the data
envelopment analysis (DEA) procedure to estimate the technical efficiency, pure technical efficiency, and scale
efficiency scores for each city and Malmquist index was subsequently used to analyze dynamically, then tries to
offer an adequate inclusion of sustainable factors in overall tourism development efficiency results through the
detection and estimation of potential sources of efficiency. In order to complete the task, data collection was
focused on Guangdong, Guangxi and Hainan provinces of China over the period from 2016 to 2018. The results
in the first phase show relatively high efficiency scores, particularly in the case of the Beibu Gulf Urban
Agglomeration and with room for improvement in the case of other cities of Guangdong, Guangxi and Hainan
provinces. The second stage results present several aspects that should be carefully considered in order
to analysis tourism efficiency of the Beibu Gulf Urban Agglomerations vertically according to the changes of the
frontier.

  Key words: Beibu Gulf Urban Agglomeration; Tourism efficiency; DEA method

1. Introduction
   Guangdong, Guangxi and Hainan provinces are the cradleland of China's ancient Maritime Silk aRoad. It is
not only the platform of trade between ancient people and southeast Asia and other coastal countries, but also
a bridge for cultural exchange and tourism. Geographically, Guangdong, Guangxi and Hainan provinces are
all located in the Beibu Gulf and the South China Sea, and they are economic and geographical units closely
connected in their own systems. With an area of about 405,000 square kilometers, a coastline of more than
   10,000 kilometers, and a population of 128 million, the three provinces and autonomous regions belong to
Manuscript Received: December 19, 2020 / Revised: December. 23, 2020 / Accepted: December. 28, 2020
Corresponding Author: hhkim@sehan.ac.kr
Tel: +82-10-2071-8977, Fax: +82-41-359-6069
Professor, Dept. of Air Transport & Logistics, Sehan Univ., Korea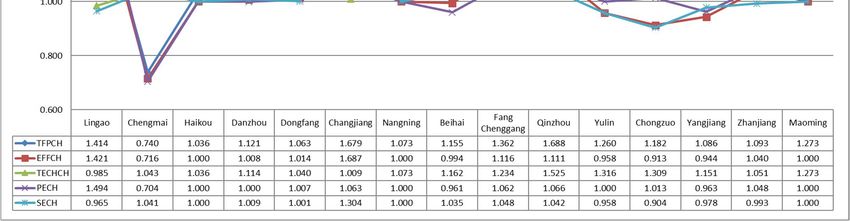
International Journal of Advanced Smart Convergence Vol.10 No.1 24-37 (2021) 25
the south China region, which straddles the tropics and subtropics. With the implementation of China's "One
Belt And One Road" strategy, it brings multiple opportunities for the economic and social development of
Guangdong, Guangxi and Hainan provinces. The joint development of tourism in this three provinces will help
to increase new economic growth points and enhance cultural cohesion, create a new normal of the economy
and new forms of cultural business, enhance the visibility and reputation both at home and abroad, and bring
material benefits and spiritual enjoyment to urban and rural residents. In February 2017, the National
Development and Reform Commission issued the " Beibu Gulf Urban Agglomeration Development Plan " and
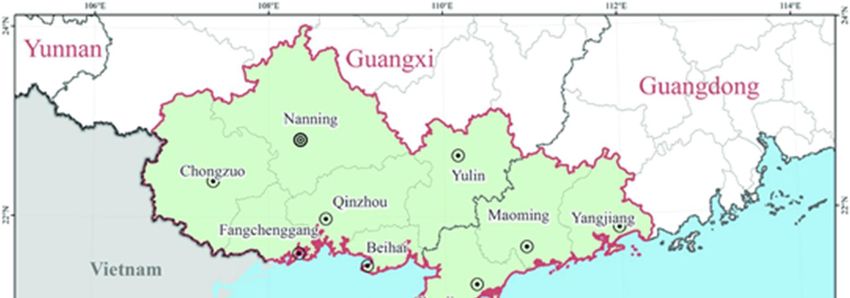
clearly points out that the Beibu Gulf Urban Agglomeration (as shown in figure. 1) should "strengthen regional
tourism cooperation, build a coordinated tourism development pattern of large, medium and small cities, and
jointly build an international tourism and leisure destination". There would be a large amount of financial,
human and material resources invested in the construction of Beibu Gulf Urban Agglomeration under this
under such a policy, which not only brings a new development opportunity to the tourism industry, but also
presents a severe challenge to the evaluation and improvement of tourism efficiency. On May 9, 2018,
Guangdong, Guangxi and Hainan provinces signed an agreement to develop the Beibu Gulf Urban
Agglomeration into a world-class tourist destination. Representatives of 15 cities and counties (Yangjiang,
Maoming, Zhanjiang, Nanning, Qinzhou, Beihai, Fang Chenggang, Yuli, Chongzuo, Haikou, Danzhou,
Lingao, Dongfang, Chengmai, Changjiang) from Guangdong, Guangxi, and Hainan signed the Beibu Gulf
Urban Agglomeration Tourism Cooperation Agreement. According to the agreement, the 15 cities and counties
will work together to develop the tourism brand of "Beautiful blue bay," as well as introduce more boutique
travel routes to jointly establish a world-class tourist destination in the region.
Figure 1. The location map of the Beibu Gulf Urban Agglomeration
The main hypothesis of this research is the proper inclusion of sustainable factors in the results of tourism
development efficiency according to the actual situation of the Beibu Gulf Urban Agglomeration development,
and unlike most studies dealing with the evaluation of micro-level efficiency, this paper tries to use a scientific,
reasonable, rigorous and feasible research methods to make a practical evaluation and in-depth research on the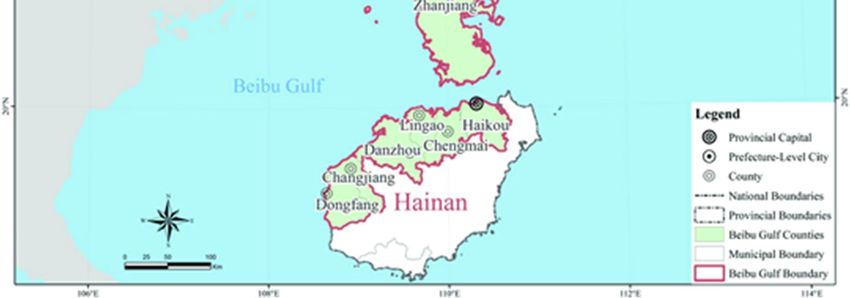
26            Using DEA Method to Measure and Evaluate Tourism Efficiency of Guangdong, Guangxi and Hainan Provinces in
                                                        the South of China - A case of the Beibu Gulf Urban Agglomeration-

tourism efficiency in the Beibu Gulf Urban Agglomeration which is of great significance to improve the
resource utilization rate, realize tourism transformation and upgrading.
   The remainder of this research is systematized as follows. Section 2 presents the results from previous
relevant researches. Section 3 provides research methodology by explaining the basis of a data envelopment
analysis (DEA) and the Malmquist index, as well as data collection procedure and descriptive statistics. Section
4 contains research results, including complete data analysis procedure. Finally, Section 5 concludes the
empirical results while highlighting the potential advantages and limitations of such an analysis, along with
recommendations for policymakers and other stakeholders.

2. Literature review
   Urban tourism efficiency refers to the nature of maximizing the output of unit factor input in a certain period
of time and maximizing the total surplus of all stakeholders in the development of the tourism industry by
taking the city as a tourism economic production unit. Overseas studies on the efficiency of the tourism
industry have been carried out earlier. Morey utilized DEA method to evaluate and study the operating
efficiency of some private chain hotels in the United States, and draw valuable conclusions about the efficiency
of hotel management [1]. Kgksal used DEA model to evaluate the operating efficiency of local travel agencies,
and the results showed that the operating efficiency of most travel agencies was not high [2]. Barros et al. and
Medina et al. evaluated and compared the efficiency of the tourism industry in France, Spain and Portugal [3-
4]. Hadad have indicated that great interest in evaluating productivity and efficiency in tourism industry is not
a surprise, considering both the growing economic significance of tourism as a source of international
employment and revenue, and increasing competition in the global tourist markets. Efficiency is the foundation
of development, and tourism is an important part of a state's economy, so it is considered very important for
both social and economic development of a certain state [5]. Toma proved in her paper that DEA model could
evaluate the efficiency of the tourism sector at the regional level, which can provide additional information
and indicate necessary decision making, so as to achieve an optimal scale of tourism market [6]. The main
purpose of this study is to assess the efficiency of tourism at provincial or regional level, in order to obtain
information that can be used as a reference for the government when making long-term decisions concerning
the future development of tourism. Efficiency is generally the relationship between output and input parameters,
and refers to the business performance of an enterprise (at micro level) or of a state (at macro level). The
process that produces more outputs than inputs is more efficient. Optimum efficiency will be achieved if you
can produce significantly more outputs than inputs. It is impossible to improve efficiency without the use of
new technologies or the introduction of various changes [7]. In addition, some foreign researchers have carried
on the evaluation research to the tourism traffic efficiency [8-9].
   Domestic research on the efficiency of the tourism industry started relatively late. Tao Zhuomin took 31
provinces of China as examples, conducted empirical analysis on the efficiency of China's tourism industry,
and drew the conclusion that the overall scale was not economic [10]. Ma Xiaolong took major Cities in China
as research objects, analyzed regional differences in the efficiency of tourism industry, and believed that scale
efficiency was the direct cause affecting technical efficiency [11]. Li Rui and Liu Jia explored the space-time
characteristics and evolution rules of tourism industry efficiency by taking Bohai Rim region and coastal region
as research areas respectively [12-13]. Besides, some researchers evaluated the efficiency of the tourism
industry in Anhui and Jiangsu provinces [14-15].
   According to the existing research results, most of the research on the efficiency of tourism industry focuses
on the national level, regional level, provincial level and enterprise level, etc., while the research on the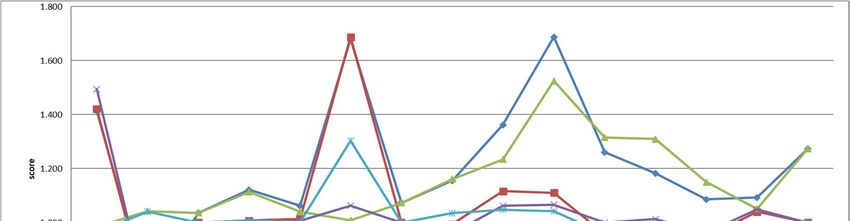
International Journal of Advanced Smart Convergence Vol.10 No.1 24-37 (2021)                                        27

comprehensive efficiency of the development of tourism industry in urban agglomeration is still insufficient.
Taking the Beibu Gulf Urban Agglomeration as a case study, this paper analyzes the efficiency differences of
the tourism industry in various cities and the reasons for their formation, so as to provide theoretical support
for promoting the transformation of the tourism industry in the urban agglomeration from scale and speed
expansion to quality and efficiency development.

3. Materials and Methods
   3.1. Research Methodology
   Efficiency, as a relation between achieved outputs and used inputs, has been put forward by Farrell , who
defines the term technical efficiency as the ability to achieve the maximal output for a given set of inputs [16].
Two decades later, Charnes, Cooper, and Rhodes developed the DEA method which is a commonly used
mathematical technique to analyze the multi-input and multi-output of the decision-making units (DMU) and
to compare their relative efficiency and benefit [17]. The researchers in various fields quickly admitted that
DEA was excellent methodology to modelling operational process.
   Charnes, Cooper and Rhodes proposed CCR DEA model which is the first DEA model in 1978. Suppose
there are n DMUs, namely DMU1, DMU2, DMU3, …, DMUn. Each DMUj, (j = 1, ..., n) use m inputs xij (i =
1, ..., m) dan generates s outputs yrj (r = 1, ..., s). Let the input weights vi (i = 1, 2, ..., m) and the output weight
ur (r = 1, 2, ..., s) as variables. Let the DMUj to be evaluated on any trial be designated as DMUo (o = 1, 2, ...,
n). Therefore, the efficiency of each DMUo, eo, can be found by solving the following linear programming,
which is called multiplier form in DEA [18].

                                                e o = max                åu y
                                                                           r
                                                                                   r ro

                                                s .t å u ry ro - å vix io £ 0
                                                         r                     i                                  (1)
                                                åvx
                                                 i
                                                             i io     -1

                                                ur , vi ³ 0

   The model is run n times to identify the relative efficiency scores of all the DMUs. Each DMU selects a set
of input weights vi and output weights ur to maximize its efficiency score. In general, a DMU is efficient when
it obtains the maximum score of 1, otherwise a DMU is inefficient. The DEA model that implemented Variable
Return to Scale (VRS) is called BCC model. In BCC model, VRS is assumed and the efficient frontier is
formed by the convex hull of the existing DMUs. The envelopment form of BCC [18] is:

                                                 min q o
                                                 s .t å l j x ij - q o x io £ 0
                                                              j

                                                 åly j
                                                                  j rj   - y ro ³ 0                              (2)

                                                 ål  j
                                                                  j   =1

                                                 lj ³ 0
  Note that BCC differs from CCR in that it has the additional convexity constraint, ∑j λj = 1 A DMU is BCC
28 Using DEA Method to Measure and Evaluate Tourism Efficiency of Guangdong, Guangxi and Hainan Provinces in
the South of China - A case of the Beibu Gulf Urban Agglomeration-
efficient if it has an optimal solution of θ = 1 λ = 1, and λ ≠ 0.
The Malmquist index method is based on the Malmquist productivity index proposed by Cave et al. (1982)
and the change value of total factor productivity (TFP) constructed by Fare et al. (1994), which can reflect the
DMU production efficiency of decision-making units in different periods [19-20]. Fare et al. (1994)
decomposed total factor productivity change rate (Malmquist productivity index) into technical efficiency
change index (TECI) and technological progress change index (TCI) under the assumption of variable returns
to scale [20]. The economic meaning of Malmquist index is that when Malmquist index m is greater than 1, it
means that the overall production efficiency of decision-making unit increases from t to t + 1. If it is equal to
or less than 1, it means that the overall production efficiency does not change and the overall production
efficiency decreases. Technological progress change index (TCI) indicates the degree of technological
innovation, which indicates the degree of change of DMU production technology between the two measured
time points. If the index TCI is greater than 1, it means technological progress; other the change index of
technical efficiency (TECI) reflects the change of production efficiency when the technical level is fixed. If
TECI is greater than 1, it means the production efficiency is improved. Otherwise, it means the production
efficiency is not changed or reduced.
3.2 Variable selection and data source
The DEA method has strict requirements on input and output indexes, and the quality of index selection is
crucial to the evaluation results. If the input index and output index are not selected scientifically, the shape
and position of the production frontier will change to a certain extent, thus affecting the accuracy of efficiency
evaluation. Therefore, the author has a comprehensive understanding of the variables selected by domestic and
foreign scholars for the research of tourism efficiency by using DEA method before studying, and summarizes
the more representative indexes as shown in Table 1.
Table 1. The summary of tourism efficiency evaluation index
No. Previous research Input index Output index
Number of employees in the tertiary
Ma Xiaolong et al. , industry; Urban fixed-asset investment;
1 Income from starred hotels
2010 Attraction of urban resources; The use of
foreign capital amount
Number of employees in the tertiary
Cao Fangdong et industry; Number of Tourist attractions; Number of tourist arrivals; Total
2
al. , 2012 Number of starred hotels; Number of tourism revenue
travel agencies
Number of employees in the tertiary
Gong Yan et al. industry; Number of Tourist attractions; Total tourism revenue; Number of
3
2014 Number of starred hotels; Number of tourist arrivals
travel agencies; Grade highway density
Number of arrivals; Number of
Ivana Ilić & Ivana Tourism costs (in mil. Euro); Number of
4 nights spent; Tourism revenue (in
Petrevska, 2018 beds
mil. Euro)
Tourism is a comprehensive industry with complex and diverse input and output indexes [21]. At present,
researchers have not reached consensus on the choice of input and output indexes. In economics, land, labor
and capital are the most basic factors of production, but the development of tourism is generally not limited byInternational Journal of Advanced Smart Convergence Vol.10 No.1 24-37 (2021) 29
land area [22]. Therefore, this paper does not take land as the input factors of tourism, but labor and capital
have an important impact on the development of tourism industry. The quantity of tourism direct employment
is an ideal indicator of labor factor input, but there is a lack of statistics on this data in the statistical yearbook
of China, so the quantity of employment in catering and accommodation industry is chosen to replace this
variable. In addition, the number of A-level national tourist attractions occupies a central position in the
tourism capital investment and is an important factor to attract tourists, while the number of starred hotels and
travel agencies reflects the tourism acceptance capacity of a region, so these elements are used as investment
indexes in this paper. By observing Table 3-1, we can find that the number of tourist arrivals and tourism
revenue are selected as the output indexes in most researches, and these two variables can reflect the
development level and scale of the urban tourism industry to some extent. Therefore, the number of tourist
arrivals and tourism revenue are also selected as the output indicators in this paper.
The research scope of this paper covers 53 cities and counties in Guangdong, Guangxi and Hainan provinces,
and the panel data of tourism input and output indexes from 2016-2018 are taken as the research samples. All
data are from statistical yearbooks of all provinces, China City Statistical Yearbook, China Regional Economic
Statistical Yearbook, official websites of National Tourism Administration, official websites of provincial and
municipal tourism bureaus, and statistical bulletins of national economic and social development of all regions.
4. Research Results
4.1 Data Envelopment Analysis Results
The results obtained from the output-oriented DEA – BCC model with MAXDEA 8 PRO software to
estimate the static efficiency of tourism in 53 cities of Guangdong, Guangxi and Hainan provinces, including
15 cities in the Beibu Gulf Urban Agglomeration from 2016 to 2018, and obtains the technical efficiency, pure
technical efficiency and scale efficiency.
Average technical efficiency
0.860
0.842
0.840 0.825
0.820
0.827
0.795
0.800
0.780 0.794
0.760 0.775
0.740
2016 2017 2018
Beibu Gulf Urban Agglomeration
Guangdong,Guangxi and Hainan provinces
Figure 2. Average efficiency scores in tourism industry of the Beibu Gulf Urban
Agglomeration and Guangdong, Guangxi, Hainan provinces from 2016-201830 Using DEA Method to Measure and Evaluate Tourism Efficiency of Guangdong, Guangxi and Hainan Provinces in
the South of China - A case of the Beibu Gulf Urban Agglomeration-
It can be found from Figure 2 that the overall average efficiency scores in tourism of the Beibu Gulf Urban
Agglomeration and Guangdong, Guangxi, Hainan provinces shows a trend of decreasing first and then
increasing from 2016-2018, and the average technical efficiency of the Beibu Gulf Urban Agglomeration is
lower than that of Guangdong, Guangxi and Hainan provinces in 2016 and 2017. The average technical
efficiency of the Beibu Gulf Urban Agglomeration reached 0.825, higher than 0.794 in Guangdong, Guangxi
and Hainan provinces in 2018. In general, the development momentum of tourism in the Beibu Gulf Urban
Agglomeration is overall good, higher than the regional average.
Average pure technical efficiency
0.920
0.899
0.900
0.880 0.869
0.860 0.850
0.867
0.840
0.848
0.820
0.830
0.800
0.780
2016 2017 2018
Beibu Gulf Urban Agglomeration
Guangdong,Guangxi and Hainan provinces
Figure 3. Average pure technical efficiency scores in tourism industry of the Beibu Gulf
Urban Agglomeration and Guangdong, Guangxi, Hainan provinces from 2016-2018
Figure3 illustrates the estimation results of the average pure technical efficiency scores in tourism industry
of the Beibu Gulf Urban Agglomeration and Guangdong, Guangxi, Hainan provinces is consistent with the
technical efficiency, showing the tendency declining at the beginning and rising up in late from 2016-2018,
and the average pure technical efficiency of the Beibu Gulf Urban Agglomeration is lower than that of
Guangdong, Guangxi and Hainan provinces in 2016 and 2017. The average pure technical efficiency of the
Beibu Gulf Urban Agglomeration reached 0.869, higher than 0.848 in Guangdong, Guangxi and Hainan
provinces in 2018. Thus, it can be seen that the organizational management level, tourism technology and
methods within the Beibu Gulf Urban Agglomeration have been greatly improved, higher than the regional
average level.International Journal of Advanced Smart Convergence Vol.10 No.1 24-37 (2021) 31
Average scale efficiency
0.955
0.949
0.950 0.944
0.945
0.940
0.935 0.931
0.930 0.934 0.933
0.925
0.920 0.924
0.915
0.910
2016 2017 2018
Beibu Gulf Urban Agglomeration
Guangdong,Guangxi and Hainan provinces
Figure 4. Average scale efficiency scores in tourism industry of the Beibu Gulf Urban
Agglomeration and Guangdong, Guangxi, Hainan provinces from 2016-2018
Figure 4 shows that different from the trend of technical efficiency and pure technical efficiency, although
the average scale efficiency scores in tourism industry of the Beibu Gulf Urban Agglomeration and Guangdong,
Guangxi, Hainan provinces from 2016-2018 takes on a downward and then upward tendency, the volatility of
the Beibu Gulf Urban Agglomeration is relatively flat, and the average scale efficiency of the Beibu Gulf Urban
Agglomeration is higher than that of Guangdong, Guangxi and Hainan provinces in 2016 and 2018, only in
2017, the average of scale efficiency is 0.924, lower than 0.931 of Guangdong, Guangxi and Hainan provinces.
In general, the large-scale development of tourism in the 15 cities of the Beibu Gulf Urban Agglomeration is
relatively smooth and has certain advantages of scale. The improvement of technical efficiency mainly comes
from the improvement of technical level rather than the expansion of scale.
The three mean values of efficiency reflect the overall situation of tourism between the Beibu Gulf Urban
Agglomeration and the 53 cities of Guangdong, Guangxi and Hainan, but in fact there are some differences in
the development of tourism among the 15 cities of the Beibu Gulf Urban Agglomeration. To be specific, the
tourism efficiency of each city needs to be analyzed according to the tourism efficiency value of each city.
Table 2 Three average efficiency scores in the 15cities’ tourism industry of the Beibu Gulf
Urban Agglomeration
DMU TE PTE SE
Lingao 0.504 0.638 0.798
Chengmai 0.498 0.536 0.948
Haikou 1.000 1.000 1.000
Danzhou 0.617 0.628 0.983
Dongfang 0.949 0.962 0.985
Changjiang 0.776 0.901 0.82232 Using DEA Method to Measure and Evaluate Tourism Efficiency of Guangdong, Guangxi and Hainan Provinces in
the South of China - A case of the Beibu Gulf Urban Agglomeration-
Nanning 1.000 1.000 1.000
Beihai 0.721 0.882 0.819
Fang Chenggang 0.937 0.963 0.971
Qinzhou 0.914 0.938 0.972
Yulin 0.972 1.000 0.972
Chongzuo 0.551 0.627 0.880
Yangjiang 0.869 0.883 0.983
Zhanjiang 0.827 0.869 0.953
Maoming 1.000 1.000 1.000
AVE 0.809 0.855 0.939
Note: "DMU, TE, PTE, SE" respectively represent decision-making units, technical efficiency, pure
technical efficiency and scale efficiency scores
1.100
1.000
0.900
0.800
score
0.700
0.600
0.500
0.400
TE PTE SE
Figure 5. Comparison and variation trend of three average efficiency in the 15cities’
tourism industry of the Beibu Gulf Urban Agglomeration
Table 2 and Firgure5 indicate that the average efficiency scores of tourism industry in Nanning, Maoming and
Haikou is euqal to 1 from 2016-2018, it means that these three cities are in the forefront of all 15 cities of the
Beibu Gulf Urban Agglomeration in terms of organization, management, technical level and scale of tourism,
and all the efficiencies reach the optimal level. In addition, the average efficiency of tourism in Dongfang, Fang
Chenggang, Qinzhou and Yulin was all greater than 0.9, ranking in the second tier among 15 cities, among which
Yulin reached 0.972, which was the closest to the forefront of efficiency.The average efficiency of tourism in
other 8 cities is less than 0.9, among which Chengmai is the lowest with only 0.498.
From the perspective of pure technical efficiency, the average pure technical efficiency of Haikou, Nanning,International Journal of Advanced Smart Convergence Vol.10 No.1 24-37 (2021) 33
Maoming and Yulin from 2016 - 2018 is equal to 1, indicating that these cities are in the state of pure technical
efficiency in terms of the technical level and management organization of tourism industry. In addition, the pure
technical efficiency of Dongfang, Changjiang, Fang Chenggang and Qinzhou all exceeded 0.9, ranking in the
second echelon of 15 cities of the Beibu Gulf Urban Agglomeration. Among them, Fang Chenggang's pure
technical efficiency reached 0.963, which was the closest to the efficiency frontier. The average pure technical
efficiency of tourism in other cities is less than 0.9, of which Chengmai is still the lowest with only 0.536.
The average scale efficiency in the 15 cities of the Beibu Gulf Urban Agglomeration is high overall, the average
scale efficiency of Nanning, Maoming and Haikou is equal to 1, in a state of scale efficiency effectivel. Except
that the average scale efficiency of Lingao, Changjiang, Beihai and Chongzuo is lower than 0.9, which shows
that the scale efficiency of tourism is insufficient. The scale efficiency of other cities is between 0.9 and 1.0,
among which Dongfang’s scale efficiency is 0.985, which is the closest to scale efficiency.
4.2 DEA-Malmquist analysis results
The previous part of the paper estimated the static efficiency of tourism in 53 cities of Guangdong, Guangxi
and Hainan provinces, including 15 cities in the Beibu Gulf Urban Agglomeration from 2016 to 2018. In this
part, the DEA-Malmquist index model is used to analyze the tourism efficiency according to the changes of the
frontier from a dynamic perspective, so as to make the analysis more comprehensive and objective.
Table 3 Annual Malmquist index of tourism efficiency in the Beibu Gulf Urban
Agglomeration from 2016 to 2018
Year Tfpch Effch Techch Pech Sech
2016-2017 1.115 0.977 1.136 0.998 0.977
2017-2018 1.315 1.146 1.174 1.053 1.060
mean 1.215 1.061 1.155 1.025 1.019
Note: Tfpch represents total factor productivity change, Effch represents efficiency change, Techch represents
technology change, Pech represents pure efficiency change, and Sech represents scale efficiency.
Based on the results in Table 3, the overall Tfpch value of tourism efficiency in the 15 cities of the Beibu Gulf
Urban Agglomeration shows an increasing change from 2016 to 2018, with an increase of 11.5% from 2016 to
2017, and a higher growth rate of 31.5% from 2017 to 2018. But overall, the average growth rate in the three
years reaches 21.5%. The Effch value increased at an average annual rate of 6.1%, and theTechch value increased
at an average annual rate of 15.5%. Therefore, it can be concluded that technological progress is the main factor
promoting the improvement of Tfpch value compared with the improvement of technical efficiency. For the
overall efficiency of the tourism industry in the 15 cities of the Beibu Gulf Urban Agglomeration, it is the most
urgent and critical work to improve the overall operation management level and organization level of the tourism
industry.34 Using DEA Method to Measure and Evaluate Tourism Efficiency of Guangdong, Guangxi and Hainan Provinces in
the South of China - A case of the Beibu Gulf Urban Agglomeration-
Figure 6. Individual Malmquist index of tourism efficiency in the Beibu Gulf Urban
Agglomeration from 2016 to 2018
Note: Tfpch represents total factor productivity change, Effch represents efficiency change, Techch represents
technology change, Pech represents pure efficiency change, and Sech represents scale efficiency.
According to the data given in figure 6, it can be seen that except for the Tfpch value of Chengmai decreased
by 26%, the other 14 cities showed an increasing trend (Tfpch>1) from 2016 to 2018, among which, Qinzhou
experienced the largest increase, reaching 68.8%, and Lingao, Changjiang, Beihai, Fang Chenggang, Yulin,
Chongzhi and Maoming all increased by more than 15%. In general, the dynamic changes of tourism efficiency
vary greatly in the 15 cities of the Beibu Gulf Urban Agglomeration, but the overall growth rate is still very fast.
5. Conclusion
According to previously conducted analysis made by the output-oriented DEA-BBC model in the first stage
and the DEA-Malmquist index in the second, the research assesses the sustainable tourism development
efficiency in 53 cities of Guangdong, Guangxi and Hainan provinces, including 15 cities in the Beibu Gulf Urban
Agglomeration over the period from 2016 to 2018. The main conclusions are as follows:
(1) The results in the first phase show relatively high efficiency scores, particularly in the case of the Beibu
Gulf Urban Agglomeration and with room for improvement in the case of other cities of Guangdong, Guangxi
and Hainan provinces. The average technical efficiency, pure technical efficiency, and scale efficiency scores of
tourism efficiency in the Beibu Gulf Urban Agglomeration is higher than it in the three provinces, that means the
overall level of organization and management within the tourism industry, as well as the technical means and
methods of the Beibu Gulf Urban Agglomeration have been developping rapidly from 2016-2018 and still have
some room for improvement.
(2) Although the overall efficiency of tourism in the Beibu Gulf Urban Agglomerations is comparatively higher,
the urban tourism development is still unbalanced and different from each other among the 15 cities, the technical
efficiency, pure technical efficiency and scale efficiency in Nanning during the three years are in a leadingInternational Journal of Advanced Smart Convergence Vol.10 No.1 24-37 (2021) 35
position, which is related to its political position and the level of economic development. The tourism efficiency
of Maoming and Lingao also achieves the optimal, shows that their organization and management of tourism,
technology level and scale are in the forefront of the beibu gulf urban agglomeration. The average efficiency of
Dongfang, Fang Chenggang, Qinzhou and Yulin are all greater than 0.9, ranking in the second echelon while the
remaining 8 cities including Haikou, Danzhou, Changjiang, Beihai, Chongzuo, Zhanjiang, Yangjiang, Chengmai
show a relatively low efficiency.
(3) The second stage results present several aspects that should be carefully considered in order to analysis
tourism efficiency of the Beibu Gulf Urban Agglomerations vertically according to the changes of the frontier.
The Tfpch value shows an overall upward trend from 2016 to 2018, which mainly due to the advance of
technology. Although the growth rate of Tfpch value in most cities is relatively close, the causes in each city are
not necessarily the same. Taking Qinzhou and Changjiang as examples, the dynamic efficiency increase based
on the Techch rate increase of 52.5%, while in Changjiang is mainly based on the improvement of the value of
Effch and Sech. Each city needs to take targeted measures to improve and optimize the tourism industry according
to its own characteristics and the current situation of the industry, so as to better improve the efficiency of local
tourism and promote the development of the industry.
(4) From the perspective of the division of provinces and regions, the tourism efficiency ranking of Maoming,
Zhanjiang and Yangjiang in Guangdong province is relatively high, which reflects that Guangdong province has
invested a lot in the development of urban tourism resources, tourism infrastructure and other tourism industry
elements in recent years, and has achieved good results. In the six cities in Guangxi province, Nanning has been
in a leading position due to its high political status and efficiency of economic development level of tourism,
Yunlin, Qinzhou, Fang Chenggang, Beihai and Chongzuo are in the middle position, and shows obvious rising
trend, that these cities have relatively strong social economic foundation strength, provide the strong support of
the development of the tourism industry. Besides Haikou, the other cities and counties (Dongfang, Lingao,
Danzhou, Chengmai and Changjiang) in Hainan province are all located along the beibu Gulf in the west, and
belong to the regions with late tourism development, relatively low development level and administrative level.
Therefore, all tourism efficiency is in the lower reaches. For cities of lower level and small scale, they should
focus on regional cooperation to improve tourism efficiency in the future, strengthen cooperation with Haikou in
resource development, route building, publicity and promotion, and sharing of tourists, and actively promote
regional tourism integration construction, so as to achieve the overall enhancement of regional tourism
competitiveness.
As so far, it should be noted that the results of the efficiency obtained by utilizing the DEA method are relative
measurements and that there are other controlled and uncontrolled factors. For instance, due to the constraints of
data availability, this paper selects the number of employment in catering and accommodation industry to replace
the number of direct employment in tourism, which reduces the number of actual tourism practitioners. However,
as tourism is a comprehensive industry with strong correlation, it can also explain the problem to some extent. In
addition, only 3 years of panel data are used in this paper, which has a short time span and some limitations, so
it needs further study and improvement.
References
[1] Morey, R. C., & Dittman, D. A., “Evaluating a hotel GM’s performance: a case in benchmarking,” Cornell hotel
restaurant and administration quarterly,36(5) : 30-35, 1995.
DOI: https://doi.org/10.1177/001088040304400507
[2] Kgksal, C., & Aksu, A., “An efficiency evaluation of A-group travel agencies with data envelopment analysis (DEA):
a case study in the Antalya region, Turkey,” Tourism management, 28(3) :830-834, 2007.
DOI: https://doi.org/10.1016/j.tourman.2006.05.01336 Using DEA Method to Measure and Evaluate Tourism Efficiency of Guangdong, Guangxi and Hainan Provinces in
the South of China - A case of the Beibu Gulf Urban Agglomeration-
[3] Barros, C. P., Botti L., & Pevpoch, N., et al., “Performance of French destinations: tourism attraction Perspectives,”
Tourism management, 32(1):141-146, 2011.
DOI: https://doi.org/10.1016/j.tourman.2010.01.015
[4] Medina, L. F., Ignacio, G. G., & Sandra, M. M., “Measuring efficiency of sun & beach tourism destinations,” Annals
of tourism research, 39(2):1248-1251, 2012.
DOI:https://www.researchgate.net/publication/256987276_Measuring_efficiency_of_sun_beach_tourism_destination
s
[5] Hadad, S.., Hadad, Y., Malul, M. & Rosenboim, M., “The economic efficiency of the tourism industry: a global
comparison,” Tourism Economics, 18(5), 931-940, 2012.
DOI: https://doi.org/10.5367/te.2012.0165
[6] Toma, E., “Regional scale efficiency evaluation by input-oriented Data Envelopment Analysis of tourism sector,”
International Journal of Academic Research in Environment and Geography, 1(1), 15-20, 2014.
DOI: http://hrmars.com/hrmars_papers/IJAREG_1_1_art_03_Toma_E1.pdf
[7] Soysal-Kurt, H., “Measuring Tourism efficiency of European Countries by Using Data Envelopment Analysis,”
European Scientific Journal, 13 (10), 31-49, 2017.
DOI: https://doi.org/10.19044/esj.2017.v13n10p31
[8] Charles, K. N., & Pauls, “Competition, privatization and productive efficiency: evidence from the airline Industry,”
The economic journal, 111(473):591-619, 2001.
DOI: https://www.jstor.org/stable/2667949
[9] Anderson, R. I., Lewisd, & Parker, M. E., “Another look at the efficiency of corporate travel management Departments,”
Journal of travel research, 37(3):267-272, 1999.
DOI: https://doi.org/10.1177/004728759903700308
[10] Tao, Z. M., Xue, X. W., & Guan, J. J., “Efficiency Characteristics Analysis of Tourism Industry in China Based on the
Method of DEA,” ACTA GEOGRAPHICA SINICA (8):1004-1012, 2010.
DOI: http://www.geog.com.cn/CN/10.11821/xb201008011
[11] Ma, X. L., & Bao, J. G., “Regional Difference and Spatial Patterns of the Tourism Efficiency in Chines Primary Tourist
Cities,” Human Geography (1):105-10, 2010.
DOI: http://en.cnki.com.cn/Article_en/CJFDTotal-RWDL201001024.htm
[12] LI, R., GUO, Q., & He, Ji, Wu, D. T., & YIN, H. M., & Ye, Q., “Spatial Temporal Characteristics of Development
Efficiencies for Urban Tourism: A Case Study of Three Urban Agglomerations in the Bohai Rim,” Progress in
Geography (6):773-785, 2014.
DOI:http://gb.oversea.cnki.net/KCMS/detail/detail.aspx?filename=DLKJ201406007&dbcode=CJFD&dbname=CJF
D2014
[13] Liu, J., Lu, J., & Liu N., “Space-Time Evolution, Influencing Factors and Forming Mechanisms of Tourism Industry’s
Efficiency in China’s Coastal Area of Based on DEA-Malmquist Model,” Resources Science (12):2381-2393, 2015.
DOI: http://www.resci.cn/CN/Y2015/V37/I12/2381
[14] Deng, H. B., & Lu, L., “The Urban Tourism Efficiencies of Cities in Anhui Province Based on DEA Model,” Journal
of Natural Resoures (2):313-323, 2014.
DOI: http://www.jnr.ac.cn/CN/10.11849/zrzyxb.2014.02.013
[15] Gong, Y., & Guo Z. R., “A Study on Efficiency and Countermeasures of Tourism Development in Jiangsu Province
—Analyses Based on Super-efficiency DEA and Malmquist Index, ” East China Economic Management (4): 7-12+17,
2014.
DOI:https://kns.cnki.net/KXReader/Detail?PlatForm=kdoc&TIMESTAMP=637413159987734375&DBCODE=CJF
D&TABLEName=CJFD2014&FileName=HDJJ201404002&RESULT=1&SIGN=vN8irnlRAEBYFNCj4M%2fB51
OCBCA%3d
[16] Farrell, M. J., “The measurement of productive efficiency,” J. R. Stat. Soc. 3, 253–290, 1957.
DOI: https://doi.org/10.2307/2343100
[17] Charnes, A., Cooper, W. W. & Rhodes, E., “Measuring the efficiency of decision- making units,” European Journal of
Operational Research, Vol.2, No.6, 1978.
DOI: https://doi.org/10.1016/0377-2217(78)90138-8
[18] Kuah, C. T., Wong, K. Y., & Behrouzi, F., “A review on Data Envelopment Analysis (DEA),” Fourth Asia
International Conference on Mathematical / Analytical Modelling and Computer, 2010.
DOI: https://ieeexplore.ieee.org/abstract/document/5489629
[19] Caves, D., Christensen, L. & Diewert, W., “The economic theory of index numbers and the measurement of input,
output and productivity,” Econometrica, Vol.50, No.6, pp.1393-1494, 1982.International Journal of Advanced Smart Convergence Vol.10 No.1 24-37 (2021) 37
DOI: https://doi.org/10.2307/1913388
[20] Fare, R., Grosskopf, S. , & Norris, M., et al. , “Productivity growth, technical progress and efficiency changes in
industrialized countries,” American Economic Review, Vol.84, No.1, pp.66-83, 1994
DOI: https://www.jstor.org/stable/2117971
[21] Cao, F. D., Huang, Z. F., Wu, J., & Xu, M., “The space-time pattern evolution and its driving mechanism of urban
tourism development efficiency: A case study of Pan-Yangtze,” Geographical Research, (8):1431-1444, 2012.
DOI: http://en.cnki.com.cn/Article_en/CJFDTotal-DLYJ201208009.htm
[22] Zhang, Y. G. “The Study on the Correlation between Debt Financing and Corporate Performance of Domestic Travel
Listed Companies,” Masteral dissertation. Bohai University, pp.25-29, 2012.
DOI:https://kreader.cnki.net/Kreader/CatalogViewPage.aspx?dbCode=cdmd&filename=1012410112.nh&tablename
=CMFD2012&compose=&first=1&uid=You can also read