WHA Corporation Public Company Limited - Opportunity Day 11th March 2021 - "Your Ultimate Solution Partner"
←
→
Page content transcription
If your browser does not render page correctly, please read the page content below
“Your Ultimate Solution Partner”

                  WHA Corporation Public Company Limited
                                          Year-ended 2021 Analyst Meeting
                  Opportunity Day                          2nd March 2022
                  11th March 2021
                                   WHA Corporation Public Company Limited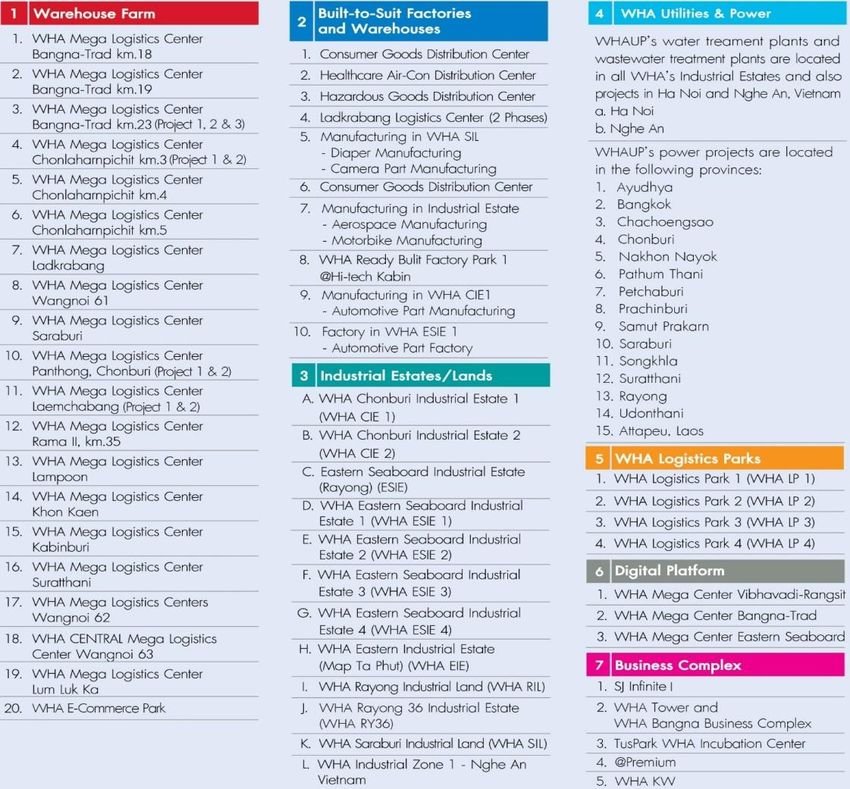
WHA Group
Disclaimers

The information contained in this presentation is for information purposes only and does not constitute an offer or invitation to sell or the solicitation
of an offer or invitation to purchase or subscribe for share in WHA Corporation Public Company Limited (“WHA” and shares in WHA, “shares”) in any
jurisdiction nor should it or any part of it form the basis of, or be relied upon in any connection with, any contract or commitment whatsoever.

In addition, this presentation contains projections and forward-looking statements that reflect the Company's current views with respect to future
events and financial performance. These views are based on a number of estimates and current assumptions which are subject to business, economic
and competitive uncertainties and contingencies as well as various risks and these may change over time and in many cases are outside the control of
the Company and its directors. You are cautioned not to place undue reliance on these forward looking statements, which are based on the current
view of the management of the Company on future events. No assurance can be given that future events will occur, that projections will be achieved,
or that the Company's assumptions are correct. The Company does not assume any responsibility to amend, modify or revise any forward-looking
statements, on the basis of any subsequent developments, information or events, or otherwise. These statements can be recognized by the use of
words such as “expects,” “plans,” “will,” “estimates,” “projects,” or words of similar meaning. Such forward-looking statements are not guarantees of
future performance and actual results may differ from those forecast and projected or in the forward-looking statements as a result of various factors
and assumptions.

                                                                                                                                                             2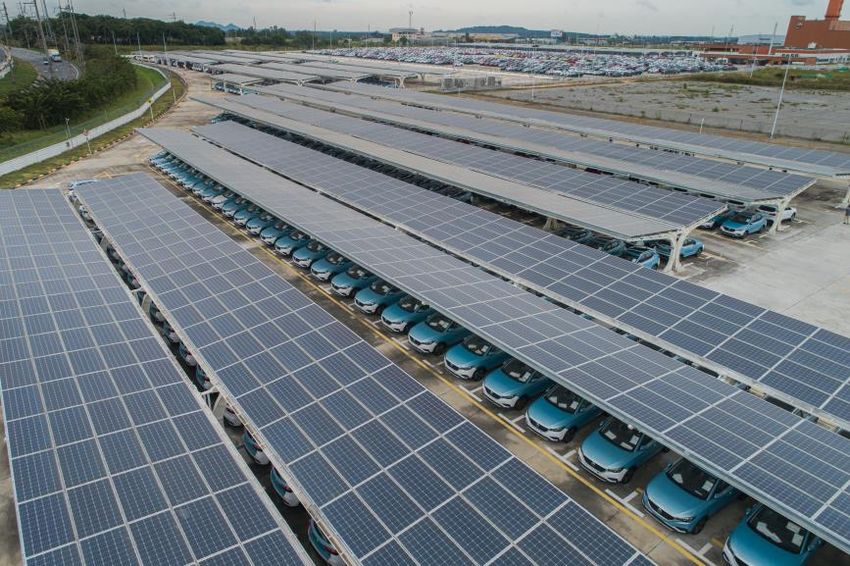
Agenda

         I.     WHA Group Overview

         II.    2021 Operating Performance

         III.   2021 Financial Performance

         IV.    Appendix

                                             3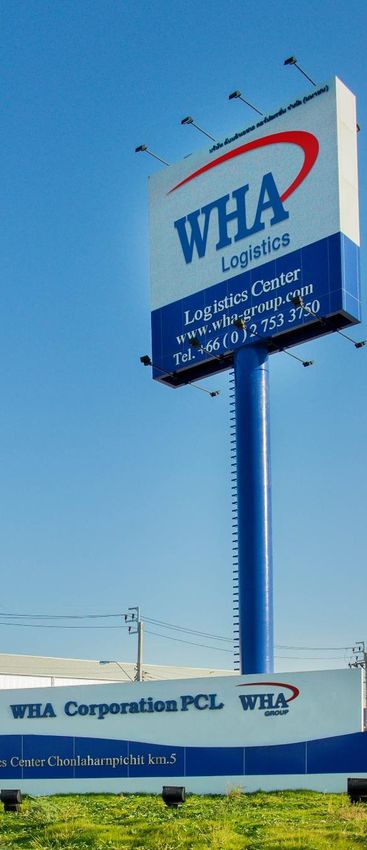
WHA Group Overview
Key Milestone
19-Year Achievements
2003 2006 2007 2010 2012 2013 2014 2015
FIRST STEP WHA’S FIRST & ESTABLISHMENT FIRST ASSET WHA IPO EXPANSION TO NEW A BIG LEAP
LARGEST of WHA MONETIZATION POWER OPPORTUNITIES FORWARD
WHA Alliance is CORPORATION WHA Corporation is
established in Feb BUILT-TO-SUIT WHAPF IPO, listed on the SET, WHA Corporation Acquisition of a
2003, pioneering WHA Corporation is consists of two raising its invested and Gunkul WHART IPO, including
DISTRIBUTION 92.88% shareholding
Built-to-suit established with a warehouses and capital to THB Engineering PCL 11 premium warehouse equity of Hemaraj
Concept of modern CENTERS IN registered capital of one factory, with a 1,709 mm form a joint venture buildings with a total
warehouse and SEA THB 170 mm, combined space of to invest in Solar area of 167,107 sqm WHABT IPO, as the
distribution centers developing high-quality 40,000 sqm project first office REIT in
Warehouse Asia warehouses, Thailand, with a fund
Alliance partners distribution centers size of THB 2,389
with GLOMAC from and factories mm
Malaysia, launched
the first Built-to-suit
Customer
Goods Distribution
Center, biggest in
Southeast Asia
2022
2016 2017 2018 2019 2020 2021
THE PATH TO NEW ERA FOR SPREADING THE YEAR OF THE YEAR OF MOVING FUTURE INNOVATIVE
SUCCESS WHA WINGS EXPONENTIAL TRANSFORMATION FORWARD WORKPLACE
WHA Group creates 4 WHA Utilities and • WHA ID and IRPC GROWTH • Establish a footprint in • New Mega Logistics • Build innovative-
business hubs: Power Plc. is listed in signs Shareholders Vietnam - WHA
Logistics, Industrial Agreement to Develop • WHA Logistics jointly Projects at Theparak driven culture,
SET invested with Alibaba, Industrial Zone 1 – with building area workplace and
Development, Utilities “WHA Industrial Nghe An ~400,000 sq.m
& Power and Digital WHA group develops Estate Rayong” in granting 232 rai in workforce to create
its first industrial zone Chachoengsao for an new revenue streams,
platform EEC • Undertake digital • 2nd Industrial Estate innovative products
in Nghe An Province, e-commerce special innovation and
HREIT IPO • WHA Hemaraj Nghe economic zone in Vietnam in Thanh and services to serve
Vietnam transformation journey Hoa Province,
An JSC celebrates customer’s demand,
• Chonburi Clean : Platform-above- Vietnam making WHA superior
groundbreaking infrastructure
ceremony for WHA Energy (CCE), a joint to competitors
venture company has • Continuing a Journey
Industrial Zone – • Launches TusPark digital innovation and
Nghe An Phase 1 signed the PPA with WHA Incubation
PEA for a contracted transformation journey
Center and cultural change
capacity of 6.90 MW
with a contractual
term of 20 years
30 January42020
WHA Group Overview
WHA GROUP AT-A-GLANCE

    2021 Performance Highlights
     #1 Logistics                                                   #1 Industrial                                               Leading                                            Spearheading
     Properties                                                    Estate                                                      Industrial                                         WHA Digital
     Developer                                                     Developer                                                   Utilities and                                      Transformation
                                                                                                                               Power Provider

  2,550,092                                             68,000           Rai/3

  Owned & Managed
                                   sqm
                                                        Land for Industrial Development                             135            mm m3                                    3   Data Centers
                                                                                                                    Water Utilities Sales & Management                            1 Tier II Facilities, 2 Tier-III facilities and the

  166,310                                         12 Industrial Estates               /6                                                                                          only Tier IV Gold Certified data center in
                                                                                                                                                                                  Asia Pacific (Excl. Australia)
                           sqm
  Net Rent for Built-to-Suit,
                                                  850 Rai Land Sale in Thailand                   /4
                                                                                                                 607            Installed Equity
                                                                                                                                MW Power
                                                                                                                                                                                  2 Data Centers to be monetized in 2022
  Warehouse Farm and RBF/RBW/1

  176,595                  sqm/2
                                                 41 Rai Land Sale in Vietnam                 /5                                                                             FTTx     covering     9    Estates

  Short-Term Contracts
                                                 879 Customers               /7

Remark: The data is as of 31 December 2021
/1 Including New Rent and Net Rent Under Ready-Built Properties (Include asset of HPF and HREIT) and Built-to-suit Properties, /2 Gross rent which include asset of WHART
/3 Including 49,400 rai operating and under development in Thailand and Vietnam, /4 Including Non-I.E Land Sales 341 Rai, /5 Excluding LOI/MOU 96 Rai in Vietnam,
                                                                                                                                                                                                                                        5
/6 11 industrial Estates in Thailand and 1 Industrial estate in Vietnam, /7 Accumulated customers based on land sales, land rent in Thailand and Vietnam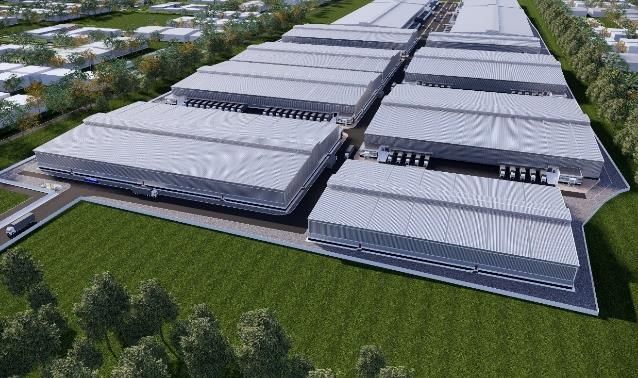
WHA Group Overview
 WHA Strategic Locations
                    WHA 50+ STRATEGIC LOCATIONS
                      IN THAILAND AND VIETNAM
             WHA is a Key Player in the Development of
                Eastern Economic Corridor (EEC)

Remark: Information as of February 2022
                                                         6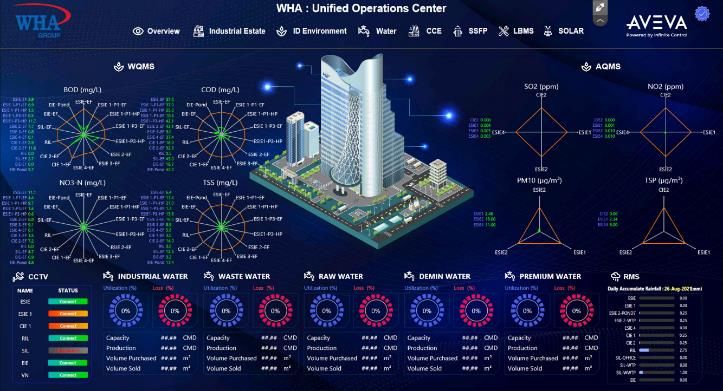
WHA Group Overview
2021 Achievements

 Awards and Recognitions in 2021
WHA Group “Rising Star Sustainability Award”

                               Sustainability
                               Excellence
                               category of SET
                               Awards 2021 and
                               listed in the 2021
                               Thailand
                               Sustainability                                      AMCHAM
                               Investment (THSI)”                               CSR Excellence
                                                                               Recognition Award
WHAUP “Outstanding Innovative Company Award”
                                                                                “Platinum Level”
                                                                                 (12 consecutive years)
                               For WHAUP’s          WHA Group & WHAUP
                               innovative            "Sustainable Stocks
                               “Demineralized            Company"
                               Reclaimed Water”      Remained in the 2021
                               project               Thailand Sustainability
                                                       Investment (THSI)

                                                                                                          7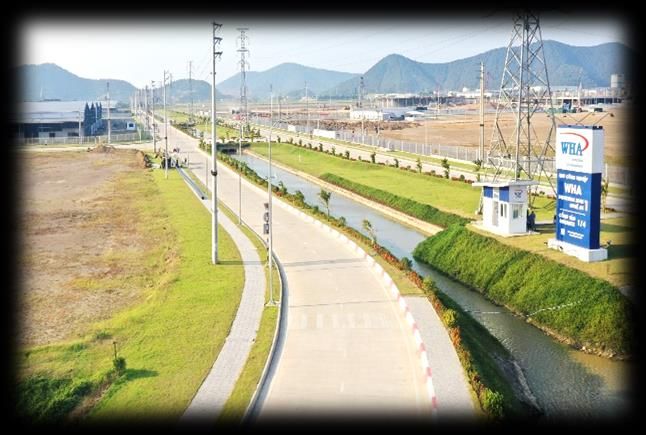
WHA Group Overview
2021 Achievements

   Delivering Our Growth Strategy
  Equity Investment in Giztix
    Series B THB 150 mm                                                                                                         Solar with ESS on Water
                                                                       New Products                                             Plant in ESIE

                                         New Investments

                                                     P2P Energy Platform
                                                                                                     Supply of Nitrogen
                                                      Developed & Ready
                                                                                                     by Pipeline to first
                                                             to Scale-up
                                                                                                            customers
      Equity Investment in
     Storage Asia (i-Store)

                                                                           Obtained IRC* for
                                                                           WHA Industrial Zone                                   New Partners
                            New Projects                                   Nghe An Phase 2
                                                                                                                            JV partnership with Asia
                                                                                                                            Industrial Estate to supply
                                                                                                                            Demineralized Water

                                                                                                 Successful development of
                                                                                                 WHA RY36
       Mega Logistics
                                                                                                 with total area of 1,280 Rai
  Project at Theparak
  with a total building
area of 400,000 Sq.m.

Note: *Investment Registration Certificate
                                                                                                                                          30 January82020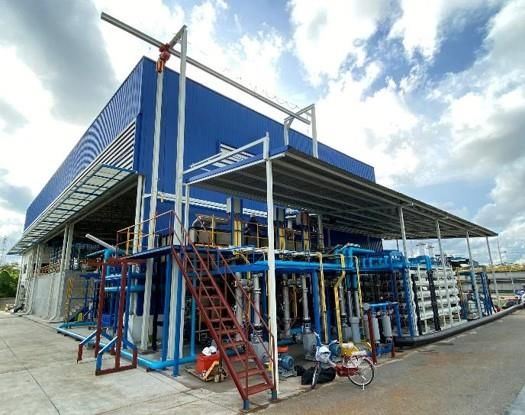
WHA Group Overview
Healthcare Support

 COVID-19 Support
                       Samut Prakan Ruamjai 5 (WHA)       Donation             Mobile X-Ray System
      Field Hospital
                       Warehouse Area: 10,000 sq.m.                            Donate to Pluak Daeng Field Hospital
                       Capacity: 1,300 Bed

     WHA in
  collaboration
  with WHART

     Offered
   “WHA Mega
 Logistics Center
   Chonlaharn                                         10 million baht                    Vaccination Center
  Phichit KM 4”        CP-WHA-CHG Field Hospital      To Ramathibodi
                       Warehouse Area: 15,000 sq.m.   Foundation and Siriraj
                       Capacity: Phase 1 – 400 Bed    Foundation to
   To become                     Phase 2 – 225 Bed    purchase ECMO heart
 A field hospital                                     and lung function aids
                                                      and medical equipment
 Help solving the                                     to treat COVID-19
                                                      patients.
     crisis of
 insufficient bed                                                                     Eastern Seaboard              WHA Saraburi
                                                                                       Industrial Estate           Industrial Land
    for COVID                                                                              (WHA ESIE)                (WHA SIL)
     patients.                                                                     Facilitate more than 2,600   Sino Farm vaccination
                                                                                     employees from 235          sites for customers
                                                                                            companies.

                                                                                                                                  9
WHA Group Overview
 Climate Change Management

    WHA Group Carbon Neutrality Landscape
                                                WHA Group provides solar power, with private PPA scheme,
                                creating Avoided CO2 Emission highly likely offsetting CO2 Emissions from our operation

     GHG                                                                    GHG Emission
     Emission                                                               Offset from Grid
     (Scope 1&2)                                                            Electricity               26,378
                                                                            Consumption               ton CO2e
                                                                            per year
                                  19,055                     To be          1,539
                                                17,456
                                  ton CO2e
                                                ton CO2e
                                                           announced
                                                               /1
                                                                            ton CO2e     10,589
                                                                                         ton CO2e
                                         2019      2020      2021              2019            2020    2021
                                                                                                                              Solar Rooftops
                                                                                                        Offset the Emission
                                                                                                                              All-in solar rooftop
                                                                                                        Tradeable
                                                                                                                              packages to
                                                                                                                              industrial customers

                                                                        Carbon
                                                                       Neutrality

Remark: /1 To be announced by Mar 2022
                                                                                                                                              10
Agenda
I. WHA Group Overview
II. 2021 Operating Performance
III. 2021 Financial Performance
IV. Appendix
112021 Financial Performance
2021 Financial Highlights
Normalized Revenue and Share of Profit
Q4 2021 12M 2021
THB 7,219 mm 61% THB 12,078 mm 29%
Rental Properties Business Land Business and Sale of Properties
Q4 2021 12M 2021 Q4 2021 12M 2021
THB 298 mm 1% THB 1,161 mm 0.5% THB 5,825 mm 90% THB 6,665 mm 57%
• Solid contribution throughout 2021. • Clear recovery of land transfer in 4Q21; on full year basis increase
• Slightly decrease in 4Q21 driven by asset monetization. 8%.
• Significant contribution from asset monetization.
Utilities Business Power Business
Q4 2021 12M 2021 Q4 2021 12M 2021
THB 484 mm 3% THB 2,148 mm 14% THB 291 mm 28% THB 1,193 mm 19%
• Solid contribution mainly driven from sale volume increase both • Strong contribution from IPP business in 4Q21 while contribution
domestic and Vietnam, more contribution from high-value from SPP continue to be solid.
products, and increase in water tariff. • Solar business continue to increase more contribution from
• Accounting adjustment of temporary tariff for SDWTP booked in additional projects in pipe-line started operation throughout 2021.
4Q21.
Normalized Net Profit
Q4 2021 12M 2021
THB 2,015 mm 45% THB 2,710 mm 8%
Note : % of growth represents Y-o-Y growth basis
122021 Operating Performance
Logistics Business
Logistics Business
132021 Operating Performance
Logistics Business
2021
#1 Built-to Suit (BTS)
166,310 sqm
Net Rent for Built-to-Suit,
Warehouse Farm and
Warehouse and RBF/RBW/1
Factories
World Class standard
176,595 sqm/2
Short-Term Contracts
warehouse and factories built to
specific client’s requirements
Assets under Owned
and Managed
2,550,092
200+ 45 2,493,980 sq.m.
Well‐known Strategic sq.m.
Tenants Profile Locations
2020 2021
Remark: The data is as of 31 December 2021
/1 Including New Rent and Net Rent Under Ready-Built Properties (Include asset of HPF and HREIT) and Built-to-suit Properties, /2 Gross rent which include asset of WHART
142020
30 January2021 Operating Performance
Logistics Business
2021 Major Deals
New Mega Project at
Theparak
Building Area:~400,000 sq.m.
Land Area:~400 Rai
Consumer Goods 3PL Logistics Center Express Industry
27,000 sq.m. 24,000 sq.m. 10,000 sq.m.
Express Industry Packaging Industry Healthcare Industry
9,000 sq.m. 8,000 sq.m. 6,000 sq.m.
152021 Operating Performance
Logistics Business – Operating Performance
Unit : sq.m.
Total Logistics Properties
2,550,092
Group-Owned assets and preleased
CAGR 19.4% (2012A – 2020A) 2,360,556 2,493,980 Area owned by
2,321,721 196,428 WHA and its
Asset Under Management 2,150,410 subsidiaries
2,115,293
1,975,361 1,823,148
Area sold to
1,626,720 WHART and
WHABT
CAGR 24.9% (2006A – 2020A) 1,108,740
891,286 Industrial Properties
Area owned by
505,051 196,195 WHA Industrial
Development
192,341 298,139 726,944 and its
169,433 subsidiaries
141,619 141,619
88,913 530,749 Area sold to
HPF and HREIT
2006 2007 2008 2009 2010 2011 2012 2013 2014 2015 2016 2017 2018 2019 2020 1Q2021
2021
Customer by Nationality Customer by Industry
Japan
Thai Auto&Parts
3PL
Europe
2% 2%
4%11%
Logistic
10% Japan
Asia(Exclu. 13%
7% 28% 22% Japan, China)
FMCG&Healthcare
25%
Europe 28% USA 40% Electronic
17% 21% Manufacturer
Asia(Exclu. 18% Australia 28%
17% Consumer
18% Japan, Thai) 6% China
20% 6% 18% 24%
E-Commerce
USA
Other 15% Industrial Service
Other
China Other
Logistics Properties Business Industrial Properties Business Logistics Properties Business Industrial Properties Business
Remark: Figures as of 31 Dec 2021
162021 Operating Performance
Logistics Business – Operating Performance
New Projects / Net Rent
Logistics Business Continued to Outperform from the Growing Demand of E-Commerce Segment
Unit: Sq.m.
300,000
258,900
250,000
45,243 209,794
200,000
166,310/1
150,000 115,382/1 42,422
135,777
109,858
293 12,426
100,000 213,657
110,133 123,888
50,000 109,565
74,017
-
2017 2018 2019 2020 2021
RBF/RBW BTS/Warehouse farm
Remarks /1 one project of 8,132 sq.m. is restated to be in 1Q21 instead of 4Q20 in prior version.
172022 Strategy and Business Plan
Logistics Business
Focusing on Higher Value Properties
Target Deliverables
UPCOMING High Value Projects in 2022 Target New Projects/New
Contracts in 2022
185,000 Sq.m.*
+ Short-Term Contracts
100,000 Sq.m.
Note: *Include BTS, RBF and RBW
Express Industry 3PL Consolidation Center Logistics Equipment
Assets under Owned
35,000 sq.m. 35,000 sq.m. 20,000 sq.m. and Managed
2,685,000
Sq.m.**
2,550,092
Sq.m.
Data Center Consumer Goods Express Industry
18,000 sq.m. 13,000 sq.m. 10,000 sq.m. 2021 2022F
Note: **Include newly-built RBF & RBW
182020
30 January2022 Strategy and Business Plan
Logistics Business
Assets Monetization to REITs
2021 2022 Target
Asset Type : Built-to-Suit Warehouse
Process completed and recognized General Warehouse
revenue in 4Q2021 WHART Total Area ~ 130,000-150,000 sq.m.
Total Value ~ THB 3,000-3,500 mm
Own Asset ~ 40%
WHART JV Asset ~ 60%
Asset Type : Ready-built Factory/Warehouse
Asset Type : Built-to-Suit Warehouse
General Warehouse HREIT Total Area ~ 40,000-50,000 sq.m.
Total Value ~ THB 1,000-1,300 mm
Total Area : 184,329 sq.m.
Own Asset
Own Asset 85%
100% JV Asset ~ 15%
192022 Strategy and Business Plan
Logistics Business
Continuing to Expand Domestically
Extend our Credentials to Capture New Demand in Strategic Logistics Location
Bangna-Trad and EEC Provinces: Chachoengsao, Chonburi, and Rayong
Expand to New Business
“WHA Office Solutions”
Create a comprehensive ecosystem for tenants,
BANGKOK including health and wellness offerings
CHACHOENGSAO
Target all businesses ie. established corporations
to early-stage start-ups
SAMUTPRAKAN CHONBURI Various prime locations to offer: across central
Bangkok and Samut Prakarn
Superior Design with full-facilities at competitive
pricing
RAYONG
Diversity Product Portfolio to Include Small Scale Facilities to be able to
Accommodate SMEs and MSMEs
Explore and Develop Freezone Project in Bangna-Trad and Chachoengsao Area
Capture Opportunity on Asset Acquisition and Sale and Leaseback
202020
30 January2022 Strategy and Business Plan
WHA Office Solutions
WHA Office Solutions
Offering 6 office locations with full facilities & flexibilities to support work life for all businesses
Readily Available for Rent Developing Project
Total Space >100K Sq.m.
Expected Completion by
Available for Rent in 2021 Q2’2023
with Over 52,000 Sq.m. with Over 9,900 Sq.m.
Available for Rent in 2014
Available for Rent in 2021 with Over 42,000 Sq.m.
with Over 1,000 Sq.m. SJ Infinite I
Vibhavadi Rangsit
Available for Rent in 2013
Available for Rent in 2010 with Over 9,800 Sq.m.
with Over 3,800 Sq.m.
WHA Tower
Bangna Trad KM.7
WHA KW
WHA Bangna Sukhumvit 25
TusPark WHA @ Premium Business Complex
Pathum Wan Theparak Road Bangna Trad KM.7
212022 Strategy and Business Plan
Logistics Business
Developing Win-Win Partnerships
Emphasize on Strategic Partnerships and High-Growth Industries
Focus on High-Growth Industries Establish & Extend Strategic Partnerships
Establish Long-term Extend
High Growth Opportunities from EEC Partnership with relationship with
Potential Industry and Other Government Global/ Regional E-commerce
Clusters Development Projects Players Giants
High Speed
Rail
EEC
Seaport Airport
222020
30 January2022 Strategy and Business Plan
Logistics Business
Embracing Smart Technologies and Innovations
Actively Exploring Smart Technologies & Collaborating with Startups to Deliver
Value-Added Services
Smart Warehouses Quantum Computing
Quantum computers are incredibly
fast and effective on solving complex
Warehouse Management calculations
System, Automated Guided
Vehicle, Robot Arm, Automated
Applications are Logistics
Storage and Retrieval System
Optimization
Cybersecurity,
Cryptography
Metaverse
Metaverse offers stronger overlap Green Transportation
between physical and digital lives
Core Technologies for Electric Vehicles i.e.
Metaverse: Blockchain, EV Cars and EV Trucks
Non-Fungible Token,
AI, Extended Reality
232022 Strategy and Business Plan
Logistics Business
Partnership with Startups
Via AI-powered Logistics Optimizer & Management Platform
A Digital Platform For E-logistics To Support Logistics
Operators In The Digital Era
On-demand Truck- Parcel/ E- Software Services
Sourcing Platform Commerce Solution
Providing on-demand delivery Delivery Service Offering software to automate
booking services with fast Facilitates demand of B2B operational transportation and
matching time clients warehouse processes i.e.
TMS, WMS
Advanced Route Smart Fleet Multi-optimizer EZ Management i-Store is a leading private storage service,
Planner Allocation Optimize based on Tool offering a wide range of high-quality and
Real-world tested route Optimally assign business needs from User-friendly platform reliable private storage solution
sequence with flexible resources for cost, workload, skillset, and app offer real-time
manual override to maximum output or a mixed balance tracking, process
ensure practicality confirmation, alerts Collaboration on Integrating Technologies to
Enhance Services
242020
30 January2021 Operating Performance
Industrial Estate Business
Industrial Estate Business
252021 Operating Performance
Industrial Estate Business
WHA Industrial Development
Extending Our No. 1 Position
11 /1
1 +2
Upcoming
Industrial
Estates
+3 Industrial
Industrial
Upcoming Zone
Industrial Zones
Estates Thanh Hoa
SARABURI Province
Nghệ An Province
CHONBURI
Total Project
RAYONG
11,550 Rai Total 2 Projects
(1,850 Hectare) 7,200 Rai
(1,150 Hectare)
WHA Smart Technology
Industrial Zone – Thanh Hoa
WHA Northern
Industrial Zone – Thanh Hoa
Note: /1 including WHA RY36
262020
30 January2021 Operating Performance
Industrial Estate Business
Industrial Estate Overview
Industrial Land Sale Outstanding LOI/MOU
605 Rai
386 Rai
149 Rai
96
133 Rai
112
601
253 4 37 96
Thailand
4Q20 4Q21 2020 2021
891 Rai Backlog
510 Rai
550 Rai
358 Rai
Vietnam 218 850 544
286
292 41 72 6
2020 2021 2020 2021
272020
30 January2021 Operating Performance
Industrial Estate Business
Land sale improved significantly from last year despite having travelling restriction due to COVID-19
Land Sales in Thailand Customer Breakdown*
1,200 Unit: rai Breakdown by Country
1,043
974 Overall Portfolio From 2019-2021
1,000 933
835 816 850
Japan 31% 8%
800
665 Thailand 17% 9%
601
600 Europe 11% 4%
USA 8% 4%
400 China 12% 60%
218 Taiwan 4% 9%
200
Korea 3% 4%
Others 14% 2%
0
2014 2015 2016 2017 2018 2019 2020 2021 4Q21 Total 100% 100%
No.1 Accumulated Domestic Industrial Breakdown by Industry
Market Share over 10 Years Overall Portfolio From 2019-2021
Auto 32% 23%
Consumer 16% 33%
Petrochemical 8% 3%
Steel/Metal 9% 8%
35% 53%
Electronics 9% 18%
Logistics 5% 0%
Others 21% 15%
10 Years 5 Years Total 100% 100%
Remark: * By number of contracts
282022 Strategy and Business Plan
Industrial Estate Business
Secure Our Position as Domestic Champion
Sustain growth in industrial land development and land sales
The Most READY Developer with LAND STOCK of 12,100 rai/1
including 4,160 rai AVAILABLE FOR SALE
Strategic Locations EEC Ready to Capture…
Don Mueang Production Relocation from CHINA
International
Airport • Land sales to Chinese customers/2 significantly increase
Ladkrabang Station > 50% of total land sales during 2019 – 2021
Almost 20 new Chinese customers/3 in 2021
Laem Chabang Port and more…
• Establish marketing office in CHINA
Sattahip
Commercial Port
Higher Value Industries
• S-curve industries
U-Tapao Airport • Opportunities in Consumer, Electronics, Food, Medical
Map Ta Phut Industrial Port
Comprehensive Infrastructure Expanding Projects in our IE
Prime Gateway to Asia In 2021, more than 55% are Repeat Customers
Investment Incentives
Promoted Zone for Targeted Industries and more…
Note: /1 including land available for sale, land bank and land reserve for RBF/commercial
292020
30 January
/2 including WHA RY36
/3 including Taiwanese customers2022 Strategy and Business Plan
Industrial Estate Business
Secure Our Position as Domestic Champion
Sustain growth in industrial land development and land sales
Continuously Develop NEW INDUSTRIAL ESTATE
Over the Next 5 Years
WHA IER Phase 2
NEW PROJECTS in pipeline 1,100 Rai/1
WHA RY36 WHA SIL 2
potential expansion of 400 rai/1 1,900 Rai/1 2026
WHA Industrial Rayong 3245 Target to Increase
300,000 sqm of RBF on 420 Rai/1
2025
LAND BANK
WHA IER Phase 1
1,100 Rai/1 For FUTURE industrial estates
WHA RY36 Phase 1 2024
• Attractive locations (e.g.
1200 Rai/1 EEC Area)
WHA ESIE4 Expansion 2023
580 Rai/1 • Access to Infrastructure
2022 • Sizable Plots
2021
Development Commencement Timeline
Note: /1 Gross Rai
302020
30 January2022 Strategy and Business Plan
Industrial Estate Business
Enlarge Our Product Offering
“Introduce NEW PRODUCTS & SERVICES Including PARTNERSHIPS With Industry Experts to Increase
Recurring Revenue And Reduce Reliance on Land Sales”
Utilities & Power BIG WHA Industrial Gas
RO, Demin
Nitrogen Gas
Nitrogen supply by pipeline
to industrial customers
Solar
Already in Operation in ESIE!
Liquified Natural Gas (LNG) ESIE
Industrial Building Additional Industrial Estates to
come
Ready Built Factory (RBF) Open
Digital Infrastructure
Solar Carpark at MG Manufacturing Plant
FTTx Higher-Value Projects &
5G Tower Specialized Estates Thailand’s largest solar carpark
Incubation Center Covering 31,000 sqm of rooftop
Sustainability / Net Zero space with a capacity of 4.88
Science and Technology Park megawatts in ESIE
Carbon Credit Trading Life Science Park
Energy Storage TusPark WHA Incubation Center
Smart Platform for Energy
Management Startups INNOVATION ECOSYSTEM for
startups
Functional Workplace, High-quality
Facilities, Global Networking
312020
30 January2022 Strategy and Business Plan
Industrial Estate Business
Our Industrial Zones in Vietnam
Vietnam will continue to be one of the most dynamic economies in the region with high GDP growth, large FDI inflows, and high
exports growth. With shortage of industrial land in Vietnam, both Nghe An and Thanh Hoa Provinces are very well positioned to
attract the flows of investments.
18,750 Rai Nghệ An Province
Total Project +2
Thanh Hoa Province
Total 2 Projects
(3,000 Hectare) 1
of Industrial Zones in Vietnam 11,550 Rai Industrial Upcoming 7,200 Rai
(1,850 Hectare) Zone Industrial (1,150 Hectare)
Zones
3,100
Rai WHA Smart Technology
Industrial Zone – Thanh Hoa
(500 Hectare)
Ready for Sale WHA Northern
Industrial Zone – Thanh Hoa
Signed MoU to develop 2
industrial zones in Thanh
Hoa Province, Vietnam.
Start of construction is
WHA Industrial Zone scheduled in 2023 and
1 – Nghe An 2024
Remark: 6.25 Rai = 1 Hectare
322020
30 January2022 Strategy and Business Plan
Industrial Estate Business
Build on Initial Success of Nghe An Project
WHA Industrial Zone 1 - Nghe An: International standard Industrial Zone equipped with the highest quality
infrastructure, utilities and environmental care
Flood Protection With increasing customer demand, WHA is
accelerating its expansion in Nghe An Province
to develop the remaining Phases.
Construction of Phase 2 to start
Dike at 4.30 m. high with drainage in 1H’ 2022
On-site Fire Station Electricity Supply pumping
Online
Monitoring System Collaborate with Nghe An province for
Phase 3 and subsequent expansions
4 lanes with
Reinforced Concrete
Pavement Water Distribution
& Wastewater Treatment
Completed Phase 1 1,000 Rai
Phase 2 2,100 Rai obtained IRC
Customer Breakdown /1
Overall Portfolio by Country and by Industry Subsequent expansions 8,400 Rai
18% China 22% Electronics 56% Total upon completion: 11,500 Rai
Vietnam Automotive Leased for
9% 45% Japan 45%
Consumer Phase 1
Others 22% Others
27% 11%
Remark: 6.25 Rai = 1 Hectare
/1 By number of contracts 332020
30 January2022 Strategy and Business Plan
Industrial Estate Business
Broaden Vietnam on National Basis
Ensure Success of KEY STRENGTHS OF
Thanh Hoa Projects THANH HOA PROVINCE
+2 3rd most populated
Total gross area
Upcoming province of Vietnam
7,200 Rai (1,150 Hectare) Industrial Hanoi
Proximity to Hanoi
Zones and Hai Phong
Thanh
Nghe
Hoa Established industrial
WHA Smart Technology Industrial Zone – Thanh Hoa
An base especially in
3,400 Rai (540 Ha) + 1,700 Rai (270 Ha) Potential Expansion petrochemical industry
Location Suitable for technology-based industries
Close to Thanh Hoa main city
Proximity to Hanoi, Haiphong, Deep Sea Lach Huyen port Danang
Thanh Hoa well positioned to attract high value FDI with
significant expansion of Northern Technology Corridor Explore Additional Projects in
Other Vietnam Provinces
WHA Northern Industrial Zone – Thanh Hoa
2,100 Rai (340 Ha) Secure greenfield Industrial zone
projects in targeted provinces
Location Suitable for intermediate and downstream
industries HCMC
Proximity to Nghi Son Petrochemical complex
Proximity to Hanoi, Haiphong, Deep Sea Lach Huyen port
Explore opportunities with new
industrial land to be made available
Significant expansion of Northern Industrial Corridor
Remark: 6.25 Rai = 1 Hectare
342020
30 January2022 Strategy and Business Plan
Industrial Estate Business
WHA Smart Eco Industrial Estates
Embrace new technologies and innovation to increase efficiency and redundancy of existing operations, and explore monetization of services
WHA Smart Eco Industrial Estate Building Blocks
Air (NOx, SO2, TSP) Air Emission On-Line for Environmentally Friendly and Digitalized Industrial Estates Jobs Center
Automated Billing ESG Commercial/ Residential/
TRAINING/
Industrial Estate Net Zero Distributed Data TECHNICAL/ Lifestyle
ENVIRONMENT
(IoT) Monitoring (EMC2) Carbon Credit Centers COMMERCIAL Vocational School
BIG
Wastewater On-Line 5G Cloud Back up Training Center
DATA
SECURITY &
Recycle East, North, Industry Cluster
WATER SAFETY (loT)
EEC Locations
Wastewater Treatment (BoD, COD, others) GRID SME Zone
Duty Free
Pre-Treatment at Customers Site CCTV
WASTE Zone
Commercial Zone
Wastewater to Energy Raw, Industrial, Alarms INDUSTRIAL
WATER Clarified, RO Water Logistics
Connection ESTATE
Demineralized EEC
Local/ Regional COMMUNICATIONS CUSTOMER
Sanitation Water 4.0
INTERFACIN
Collection ELECTRICITY/ Fire-Response- G
CUSTOMER
Peak Load Oxygen,Nitrogen
Incineration POWER 3 Levels INTERFACING
Management Fiber to Factory
Industrial Waste- Central Control Pipe Distribution
Off-peak Smart Telephone
SOLID to-Energy Power to Grid System Maintenance Remote Online
Management Internet INDUSTRIAL
WASTE Reclamation / Power to Customer Works Control Monitoring
Traffic Control Mobile GAS
Recycle / Reuse Solar Solution Major User
Drone Security FTTx
Land Fill Direct Customer (BAMS)
Flood Control Online Metering Logistics and
Distribution
Building NG Distribution
High Temperature Smart Grid Maintenance
NATURAL NG Station
HAZARDOUS Incineration Hydrogen Smart App
WASTE Steam Generation energy SMART Customer
GAS
DISTRIBUTION
Management
Inside Fence
storage
Energy
WATER Interfacing App Gas to Steam
Management SMART
Optimization
SECURITY SMART
SMART
SMART SERVICES
COMMUNICATION
POWER SMART
Smart Traffic Management and VMS MOBILITY Drone for Aerial Views Security,
Traffic, and Roof Inspections
352020
30 January2022 Strategy and Business Plan
Industrial Estate Business
Target Deliverables
Land Sales Target
+40% 1,250
Rai Land Sales
THANH HOA
300 Rai NGHE AN
VIETNAM
891
Rai Land Sales
41 Rai
SARABURI
CHONBURI
RAYONG
THAILAND
850/1 Rai 950/2 Rai
2021 2022F
Note: /1 including non-core land of 341 rai
/2 including non-core land of 100 rai 362020
30 January2021 Operating Performance
Utilities and Power Business
Utilities and Power Business
372021 Operating Performance
Utilities Business - Overview
Sole Provider of Utilities to Manufacturers/Factories in Leading Industrial Estates with a Concrete Plan to Capture
Increasing Demand from Heavy Users and Expand Outside i.e. Other IEs, Non-IE Area and International
Water Sales & Managed Volume
Water Product/Services & Capacity in Thailand and Vietnam
Industrial Water 112
million m3
2021
Wastewater Treatment 23
million m3
2021 135
Municipal Water million m3
Reclaimed & 2021
Demineralized Water
382021 Operating Performance
Power Business - Overview
Diverse Portfolio of Conventional and Renewable Energy
Conventional Power Plant
547 Equity MW of Existing
Conventional Power
607
Installed
Equity MW
590
Installed
Equity MW
Renewable Energy
Solar Rooftops
57 Equity MW COD
Industrial Waste to Energy
3 Equity MW COD
Natural Gas
Operating Projects – WHANGD 2 and WHANGD 4 2020 2021
Under Development – EIA Approved for WHANGD 3
392021 Operating Performance
Utilities and Power Business
UTILITIES BUSINESS POWER BUSINESS
Q1
Impressive growth in domestic utilities while SDWTP Solid performance from SPP business and growing
still contributed share of loss despite higher sale portfolio of solar energy business, despite a lower
volume YoY. normalized share of profits from IPP business due to
Gheco-One’s maintenance.
• The revenue from domestic utilities grew +15% YoY from
2020 mainly due to the sales volume growth in all • Total revenue of solar business in 2021 including EPC
product categories as a result of new demand from increased by 354% YoY while the revenue from private PPA
power and petro-chem customers, demand/production alone increased by 140% YoY as a results of higher MW
recovery from relieved covid-19 and no draught situation under operation (39.5 MW as of Q420 vs 57.1 MW as of
in 2021. Q421).
• For Vietnam utilities business, the sale volume of • Normalized share of profit from power business in 2021
SDWTP in 2021 increased by +22% YoY. However, the slightly decreased by 1% YoY mainly due to Gheco-One’s
share of loss in 2021 increased by 28% YoY due to an maintenance (In 2021, Gheco-One performed 37-day
accounting impact of accounts receivable allowance of - planned outage and 51.5-day unplanned outage).
64 MB. If the accounting allowance was excluded, the
share of loss from Vietnam utilities in 2021 would be - • SPPs still showed strong performance with rising demand
140.1 MB, decreased by 12% YoY from share of loss of - from EGAT and IU, providing an increase of normalized
159.7 MB in 2020. share of profit from SPPs by 17% YoY.
402021 Operating Performance
Utilities Business – Operating Performance
Utilities Portfolio Growth – Sale & Management Volume
Million m3/ year
150 135 Million m3 4Q20 4Q21 YoY (%) 2020 2021 YoY (%)
110 114 23
100 105 3 Raw Water 3.5 5.4 55% 15.1 22.4 48%
0.2 19 4
100 2 Industrial Water 11.7 12.3 -3% 47.0 49.6 8%
35 35 36
34 31 Wastewater
17 8.0 8.7 8% 31.1 36.1 20%
17 17
15 22 Treatment
50
Value Added Water 1.0 1.1 10% 2.7 4.4 62%
49 53 55 47 50 Total Thailand 24.2 26.5 9% 96.0 112.5 17%
0 SDWTP & Cua Lo 5.0 6.1 23% 18.5 22.5 22%
2017 2018 2019 2020 2021
Total 29.2 32.6 12% 114.5 135.0 18%
Industrial Water Raw Water Wastewater Value Added Water SDWTP & Cua Lo
Potential Demand from New Key Projects and Key Customers On Schedule
Water Consumption 2017 2018 2019 2020 2021 2022E
SPP COD 3,500 – 4,000 1SPP 1SPP (Jan 19)
4SPPs
m3/day
IPP COD 40,000 m3 / day Block 1 Block 2
Waste to Energy 1,000 m3 / day CCE (Q4’19)
+5,000 +2,000
Petrochemical
Power +4,000 +5,200 +4,400 +3,800
Nghe An - Vietnam +5,000
412022 Strategy and Business Plan
Utilities Business
Expanding Our Products with Horizontal and Vertical Integration
Existing Portfolio
Wastewater Reclamation Unit: Million m3 Innovative Product and Solutions On-going Projects
(Clarified +Premium Clarified)
Capacity: 3.7 million m3/yr
Value Expanding Value-added Utilities Solutions
Added
128 Increasing Conventional Water
112 Sales Volume in WHA Industrial
Diversify Water Resources
Estates
Gulf VTP, Gulf TS1, Gulf TS2
108
123
Develop & Secure Alternative Sales volume + 12.6 million m3/yr
Demineralized Water Raw Water Resources
Capacity: 4.4 million m3/yr
2021 2022F Partnering with ASIA Industrial
Estate
Capture Non-WHA Industrial Estates Reclamation & Demineralized Water Plant
Capacity > 1 million m3/yr
Partnering with other Industrial Estate
GPSC
Developers to provide utilities solutions
Wastewater Treatment Providing premium clarified water to
Current Capacity: 0.2 million m3/yr Gulf SPP
Max Capacity: 0.4 million m3/yr
Sustainability & Environmental Capacity 1.4 million m3/yr
Friendly
Developing Alternative Raw Water
Develop Wastewater Reclamation Project Projects to increase water reliability and
reduce raw water cost
EECi Total Capacity 9.6 million m3/yr
422020
30 January2022 Strategy and Business Plan
Utilities Business
Enhance Our Water Supply Capability in Vietnam
Duong River Surface Water Treatment Plant Hanoi, Bac Ninh, Hung Yen
34% Shareholding Equity
• To increase customers base and water supply coverage
areas to nearby provinces
Thanh Hoa
Nghe An
WHA Nghe An Industrial Zones
100% Shareholding Equity
• To increase water distribution volume Max 4.38 million m3/yr Unit: Million m3
• To increase utilization of wastewater treatment Max 2.19 million m3/yr
To Increase water supply 23 25
volume along with the growth
of WHA Industrial Estates
Vietnam such as WHA Thanh
Cua Lo Water Plant Hoa Industrial Zones 2021 2022F
47% Shareholding equity
• Plant’s Capacity Expansion completed in
2021 to 8.4 million m3/yr Actively exploring
greenfield utilities project
and M&A opportunities in
Vietnam
432020
30 January2022 Strategy and Business Plan
Utilities Business
Developing Smart Utilities Platform and Solution
SCADA System for Remote Monitoring Smart Water Solution
WHAUP Intelligence Platform
SCADA & UOC for WHAUP’s improvement (Phase 1) Already executed in
• Able to monitor and control all WHAUP’s utility plants through SCADA & UOC WHAEIE and will
• Able to report real-time key operational performance continue to implement in
other WHA Industrial
WHA
SERVER
Estates in 2022
E-Billing
AUTOMATIC
INVOICE
Example of the
Under implementation
screen at Unified
Operation Center 5G
(UOC) SCADA & UOC
5G
WATER 5G
PLANT CUSTOMER
SMART WATER METER
Incl. Processing Software
442020
30 January2021 Operating Performance
Power Business – Operating Performance
3M Y-o-Y
4Q20 4Q20
GWh IPP Energy Dispatch 4Q21 % AF IPP Availability 4Q21
94.0% 95.9% 90.0% 93.1%
1,378 1,408
67 81 148
0
Gheco-One HHPC Glow IPP Gheco-One Glow IPP
EGAT
GWh SPP Group Energy Dispatch IU % AF SPP Group Average Availability
1,636 1,642
99.3% 97.8%
409 405
1,227 1,237
2020
2020 2021
2021 2020
2020 2021
2021
452021 Operating Performance
Power Business – Operating Performance
12M Y-o-Y
2020 2020
GWh IPP Energy Dispatch 2021 % AF IPP Availability 2021
5,477 94.3% 97.5% 91.9%
4,372 74.9%
383 399 697
0
Gheco-One HHPC Glow IPP Gheco-One Glow IPP
EGAT
GWh SPP Group Energy Dispatch IU % AF SPP Group Average Availability
6,485 6,742
97.2% 98.0%
1,507 1,681
4,978 5,061
2020
2020 2021
2021 2020
2020 2021
2021
462021 Operating Performance
Power Business
Continuing to be Strong in Solar Rooftop for
Industrial Users
Selected Solar projects commissioning in 2021
9 projects COMMISSIONING in 2021 with a total Continental Tyres Takahata
WHA ESIE4 WHA ESIE1
capacity of 18 MW Capacity 4.2 MW Capacity 2.1 MW
(Total 57 Equity MW in operations as of 2021)
18 new projects SIGNED in 2021 with Industrial
Users with a total capacity of 41 MW
(Total 92 Equity MW Signed PPA as of 2021)
300 Honda Solar Projects BTF Solar Farm
MW Prachinburi Ratchaburi
150 2023F Capacity 2.5 MW Capacity 2.3 MW
MW
92 2022F
MW
51 2021
MW
2020
Cumulative Target Signed PPA
472020
30 January2022 Strategy and Business Plan
Power Business
Focusing on Renewable Energy
Increasing Capacity from Solar Rooftop and Waste to Energy Projects
Upcoming Solar Projects in 2022, Actively Explore WTE
with target signed PPA of 58 MW opportunity
Largest Solar Rooftop Project in ASEAN
WHA Chonburi
Industrial Estate 1
CUMULATIVE (WHA CIE 1)
Non-hazardous waste of
100,000 tons/ year
TARGET SIGNED PPA into Electricity output of
8.63 MW
OF SOLAR Prinx Chengshan
WHA ESIE3
Capacity 19.4 MW
92 150
2021 2022F Leverage knowledge from existing
CCE Project
Explore various sources of waste to
energy
BorgWarner Honglin Honda Engineering Asian Create synergy from collaboration
WHA ESIE Amata Rayong Amata Chonburi with network of partnership
Capacity 0.7 MW Capacity 1.0 MW Capacity 1.0 MW
482020
30 January2022 Strategy and Business Plan
Power Business
Embracing Smart Energy Solutions
Innovative Energy Solution for Increased Opportunities and Efficiency
P2P Energy Trading Smart Microgrid in Industrial Areas
Prosumer
Consumer Consumer
Scale up of Project
Energy cost saving to industrial users
Increase opportunity to invest in
renewable energy
Enhance reliability, efficiency and cost saving for
Pilot test with small group participants industrial users
Increase opportunity to Invest in distributed generation
• 5 Prosumers, 6.4 MWp solar
• 5 Consumers, Total demand 6.0 MW Study on ESS technology
• Test Period from 19 Aug – 14 Sep 2021
Opportunity for captive power within IEs
• Full commercial implementation expected in 2Q2022
492022 Strategy and Business Plan
Utilities and Power Business
Target Deliverables
Total Water Vietnam’s Value-added
Supply and Total Water Water Supply
Wastewater Supply and Volume
Management Wastewater (Demineralized
Volume Management Water, Premium
Volume Clarified Water)
502020
30 January2021 Operating Performance
Digital Business
Digital Business
512021 Operating Performance
Digital Business
Digital Business
Laying Digital Foundations
UNDERGROUND FIBER OPTIC (FTTx) TELECOM TOWER DATA CENTER
10
Industrial Estates
8
Telecom Tower
1
DATA
covered FTTx by Constructed
by 2022 CENTER
2022
Providing infrastructure for wireless telecom network Monetizing two data centers (Genesis and KM3
inside WHA’s industrial estates
100%
data center)
WHA SIL WHA ESIE 3
WHA RIL WHA ESIE 4 Telecom operators rent Equity
Available
& Utilized WHA ESIE 2 WHA CIE 2 space on telecom towers
built by WHA to place
Monetized Genesis
(33% Owned)
TIER III
51 Racks
Capacity
antennas and other Equity
telecom devices are Under
Under
Migration
WHA EIE WHA constructs the
KM3
Monetization (100% Owned)
TIER III
220 Racks
Capacity
tower and base station
Process
Remain with Tier IV data center called Supernap
Complete WHA CIE 1 ESIE KEY CUSTOMERS
Equity
Construction
In 2022 WHA ESIE 1 WHA RY 36
Supernap TIER IV
(15% owned) GOLD 102 Racks
Capacity
522020
30 January2022 Strategy and Business Plan
Digital Business
Venture Deeper into Digital World
WHA Digital is a newly established company with main objective to lead WHA Group in digital
transformations and implementation of digital innovations and technologies
Logistics Industrial Development
Auto Guided SMART Transportation Data SMART SMART Traffic Data
Vehicle (AGV) Storage Management Analytics Pole Surveillances Management Analytics
Utilities & Power STARTUP New Businesses
SMART SMART Water P2P Energy Data Digital Electric
Block chain
Grid Solutions Trading Analytics Healthcare Metaverse Vehicles
Partnering with Startups for
New Technologies and
Innovations
532020
30 JanuaryOur Digital Transformation Journey
Digital Transformation
WHA’ s Strategic Positioning of Innovation
2024 Turning to Technology Company
Build Digital-Ready Culture in Organization. Digital and innovation are now core value,
and continue optimizing best practices with AI and Data Insights.
Data Driven Organization
2023 Turn data asset into a competitive advantage. The whole organization has
driven all aspect with data insights through: Manage digital assets Innovate
with data Think data monetization
Innovative Workplace
2022
Build Innovation Culture, Workplace and Workforce to create new
revenue streams, innovative products and services to serve customer’s
demand, making WHA superior to competitors.
Digital Transformation
Utilize digital technology to leverage new levels of WHA
2021 business operations reliability and efficiency in order to
empower core business and lead to superiority over industrial
competitors.
542020
30 JanuaryOur Digital Transformation Journey
Digital Transformation
Change Management
WHA Digital Transformation
Change Management will play a vital role to groom key
characteristics of WHA People to be ready for digital transformation
ALLOW CAN DO
RESPECT TRUST ATTITUDE
AGILE COLLABORATE
FAILURE
Communication Alignment Skills Accountability
Measurement
How WHA will look like
to accommodate our aspiration to become Tech Company by 2024
PEOPLE CULTURE GROWTH & TECHNOLOGY NEW
MINDSET GLOBAL BUSINESS
REACH
WHA people with Transition towards Focus on developing a Develop and Design open
“CAN DO” attitude a younger and more comprehensive leverage strong space environment
and dare to more agile culture ecosystem to drive digital infrastructure and mechanism to
challenge mindset
exponential growth, to explore new accelerate new
covering beyond opportunities business
Thailand experimentation
552020
30 JanuaryAgenda
I. WHA Group Overview
II. 2021 Operating Performance
III. 2021 Financial Performance
IV. Appendix
562021 Financial Performance
Total Revenue and Share of Profit (3 Months)
Total Revenue and Share of Profit Unit: THB mm
Statutory (3 Months) Normalized Basis (3 Months)
59% Y-o-Y 61% Y-o-Y Normalized Basis(2)
(1)
7,239
20
X163
401% Q-o-Q 377% Q-o-Q
(1)
4,551 X X X
68
(1) 532 (2)
1,446 7,239 7,056 7,219
(2)
4,551 4,483 232
3,951 (2)
1,446 1,280 1,512
(66)
4Q2020 3Q2021 4Q2021 4Q2020 3Q2021 4Q2021
Total Revenue and Share of Profit Total Revenue Share of Profit Impact from FX
• Total Normalized Revenue and Share of Profit in 4Q2021 was THB 7,219 mm, increasing by 61% Y-o-Y and 377% Q-o-Q mainly due to higher revenue
contribution from asset monetization to WHART as well as increase in revenue from Sale of Industrial Land.
• The Statutory Revenue and Share of Profit in 4Q2021 stood at THB 7,239 mm which increased by 59% Y-o-Y and 401% Q-o-Q.
Remark: (1) Representing Total Revenue Inclusive Share of Profit (Financial Statement)
Remar (2) Representing Total Revenue Inclusive Share of Profit (Normalized) excluding FX impact 572021 Financial Performance
Total Revenue and Share of Profit (12 Months)
Total Revenue and Share of Profit Unit: THB mm
Statutory (12 Months) Normalized Basis (12 Months)
27% Normalized Basis(2)
(1)
11,964
760
(1)
9,407 29%
31
1,171
(2)
11,964 11,318 12,078
(2)
9,407
8,205
9,376
(114)
2020 2021 2020 2021
Total Revenue and Share of Profit Total Revenue Share of Profit Impact from FX
• The Total Normalized Revenue and Share of Profit of 2021 stood at THB 12,078 mm which increased by 29% Y-o-Y, due mainly to higher contribution from Land
Business and Sale of Properties from asset monetization to WHART as well as solid contribution from Utilities Business and Power Business.
• While the 2021 performance, the Statutory Revenue and Share of Profit was THB 11,964 mm which increased by 27% Y-o-Y.
Remark: (1) Representing Total Revenue Inclusive Share of Profit (Financial Statement)
Remar (2) Representing Total Revenue Inclusive Share of Profit (Normalized) excluding FX impact, Impact from TFRS and deferred revenue items 582021 Financial Performance
Net Profit (3 Months)
Net Profit Unit: THB mm
Statutory (3 Months) Normalized Basis (3 Months)
32%
Normalized Basis(2)
11% 28% 31%
15% 28%
40% Y-o-Y
45% Y-o-Y
1,172% Q-o-Q
780% Q-o-Q
(1)
(1)
1,454 2,035 20
X
65 (2)
(1)
160 2,035 2,015 2,015
1,454 1,389 1,389
(2)
160 229 229
(69)
4Q2020 3Q2021 4Q2021 4Q2020 3Q2021 4Q2021
Net Profit Net Profit Margin Normalized Net Profit Impact from FX(3)
• The Normalized Net Profit in 4Q2021 was THB 2,015 mm, increasing by 45% Y-o-Y and 780% Q-o-Q, respectively, due to increase in revenue from asset monetization of
WHART and lower financial expenses.
• The Reported Net Profit in 4Q2021 was THB 2,035 mm, increasing by by 40% Y-o-Y and 1,172 % Q-o-Q.
Remark: (1) Representing Net Profit (Financial Statement)
Rem ark:(2) Representing Net Profit (Normalized) excluding FX impact 59
(3) Impact from FX attributed to parent2021 Financial Performance
Net Profit (12 Months)
Net Profit Unit: THB mm
Statutory (12 Months) Normalized Basis (12 Months)
27% Normalized Basis(2)
22% 27% 22%
3%
(1)
(1)
2,590
2,524
20
8%
(2)
(2)
2,710 2,710
2,524 2,590 2,503
2,503
(120)
2020 2021 2020 2021
Net Profit Net Profit Margin Normalized Net Profit Impact from FX(3)
• Excluding the impact from FX, the Normalized Net Profit of 2021 increased by 8% Y‐o‐Y, mainly due to higher contribution from Land Business and Sale of Properties business
despite increase in administration expenses as well as higher financial cost.
• However, excluding the revenue recognition on right of way of THB 397 mm in 2020 and THB 125 mm in 2021 as well as excluding one-time other revenue recognition in
2020 of contract restructuring from 1 client amounting of THB 172 mm, Adjusted Normalized Net Profit of 2021 increased by 30% Y-o-Y.
• Reported Net Profit of 2021 increased by 3% Y-o-Y.
Remark: (1) Representing Net Profit (Financial Statement)
Rema rk:(2) Representing Net Profit (Normalized) excluding FX impact 60
(3) Impact from FX attributed to parent2021 Financial Performance
Financial Highlights (3M Y-o-Y)
3M (4Q2021 vs 4Q2020)
Y-o-Y Y-o-Y
Reported Revenue and Share of Profit : THB 7,239 mm 59% | Reported Net Profit : THB 2,035 mm 40%
Normalized Revenue and Share of Profit : THB 7,219 mm 61% | Normalized Net Profit : THB 2,015 mm 45%
Rental Properties Business THB 298 mm 1% • Slightly decrease in Rental Revenue due to asset monetization to WHART
Normalized Revenue even if strong occupancy rate on both existing the Company’s Built-to-Suit
project and RBF/RBW
Land Business and Sale of Properties THB 5,825 mm 90% Sale of Industrial Land: THB 903 mm
Normalized Revenue and Share of Profit • Mainly from higher number of land transfer in 4Q2021 compared to the
same period of previous year
Sale of Investment Properties: THB 4,922 mm
• Large asset monetization to WHART despite having no asset monetization
to HREIT in 4Q2021
Utilities Business THB 484 mm 3% • Mainly due to increase in share of loss from investment in utilities business in
Normalized Revenue and Share of Profit Vietnam in 4Q2021 as a result of accounting adjustments for SDWTP due to
the reduction of the temporary tariff sold to some clients of THB 64 mm
• Despite revenue from Utilities business increase from higher sale volume
Y-o-Y
Power Business THB 291 mm 28% • Mainly due to an increase in share of profit from solid contribution from IPP
Normalized Share of Profit and Revenue from Solar resulted from more favorable FX, despite higher gas price versus lower Ft
Business adjustment, affecting industrial users sale portion of SPP
Finance Cost THB 277 mm 4% • Due to decreasing in average 3M IBD from cash proceed received from
asset monetization to WHART and decrease in weighted average interest
rate during 4Q2021
Normalized Net Profit THB 2,015 mm 45% • Mainly due to gain from asset monetization to WHART and lower financial
expenses.
• Despite higher administration expenses from provision of one project
Note : % of growth represents Y-o-Y growth basis 612021 Financial Performance
Financial Highlights (3M Q-o-Q)
3M (4Q2021 vs 3Q2021)
Q-o-Q Q-o-Q
Reported Revenue and Share of Profit : THB 7,239 mm 401% | Reported Net Profit : THB 2,035 mm 1,172%
Normalized Revenue and Share of Profit : THB 7,219 mm 377% | Normalized Net Profit : THB 2,015 mm 780%
Rental Properties Business THB 298 mm 1% • Slightly decrease in Rental Revenue due to asset monetization to WHART
Normalized Revenue even if strong occupancy rate on both existing the Company’s Built-to-Suit
project and RBF/RBW
Land Business and Sale of Properties THB 5,825 mm 4,090% Sale of Industrial Land: THB 903 mm
Normalized Revenue and Share of Profit • Mainly from higher number of land transfer in 4Q2021 compared 3Q2021
Sale of Investment Properties: THB 4,922 mm
• Large asset monetization to WHART despite having no asset monetization
to HREIT in 4Q2021
Utilities Business THB 484 mm 13% • Mainly due to increase in share of loss from investment in utilities business in
Normalized Revenue and Share of Profit Vietnam in 4Q2021 as a result of accounting adjustments for SDWTP due to
the reduction of the temporary tariff sold to some clients of THB 64 mm
• Decrease in sale volume of Industrial water due to one major client
temporary shutdown for maintenance
Power Business THB 291 mm 0.3% • Mainly due to decrease in share of profit as lower contribution from SPP
Normalized Share of Profit and Revenue from Solar from higher gas price
Business
Finance Cost THB 277 mm 4% • Due to decrease in average 3M IBD from cash proceed received from asset
monetization to WHART and decrease in weighted average interest rate
during 4Q2021
Normalized Net Profit THB 2,015 mm 780% • Due to increase in revenue from Land Business and Sale of Properties
business and lower financial expenses.
• Despite higher administration expenses from provision of one project
Note : % of growth represents Q-o-Q growth basis 622021 Financial Performance
Financial Highlights (12M Y-o-Y)
12M
Y-o-Y Y-o-Y
Reported Revenue and Share of Profit : THB 11,964 mm 27% | Reported Net Profit : THB 2,590 mm 3%
Normalized Revenue and Share of Profit : THB 12,078 mm 29% | Normalized Net Profit : THB 2,710 mm 8%
Rental Properties Business THB 1,161 mm 0.5% • Strong occupancy rate on both Built-to-Suit project and RBF/RBW
Normalized Revenue
Land Business and Sale of Properties THB 6,665 mm 57% Sale of Industrial Land: THB 1,730 mm
Normalized Revenue and Share of Profit • Revenue recognition from Sale of Industrial Land excluding the revenue on
right of way increased 8% Y-o-Y
• However, if included the revenue on right of way, it decreased by 8% Y-o-Y
due to lower revenue on right of way in 2021 compared to the previous year
Sale of Investment Properties: THB 4,935 mm
• Mainly to large asset monetization to WHART despite having no asset
monetization to HREIT in 4Q2021
Utilities Business THB 2,148 mm 14% • Mainly due to increase in sale volume both domestic and Vietnam, increase
Normalized Revenue and Share of Profit in Water tariff, and contribution from high value products as well as drought
situation during 2020 which there were no such situation during 2021
Power Business THB 1,193 mm 19% • Mainly from significant increase from Solar business and solid contribution
Normalized Share of Profit and Revenue from Solar Business from SPP business, despite having schedule and forced shutdown of Gheco-
One during 2021
Finance Cost THB 1,146 mm 3% • Mainly due to decrease in capitalization of interest expense approx. THB 72 mm
Normalized Net Profit THB 2,710 mm 8% • Due to significant decrease in the revenue recognition on right of way Y-o-Y
as well as one-time other revenue recognition of contract restructuring
from 1 client in 2020 amounting of THB 172 mm while there were no such
revenue in 2021. Such revenue contributed fully to bottom line.
• Higher administration expenses
• However, excluding the revenue recognition on right of way as well as
excluding one-time other revenue recognition in 2020, Adjusted
Normalized Net Profit of 2021 increased by 30% Y-o-Y
Note : % of growth represents Y-o-Y growth basis 632021 Financial Performance
Performance by Business (3 Months)
RENTAL PROPERTY BUSINESS (NORMALIZED) LAND BUSINESS AND SALE OF PROPERTIES (NORMALIZED)
Unit: THB mm Real GPM before PPA of 4Q2021 : 47% Unit: THB mm
Real GPM before PPA of 4Q2021 : 64%
3M 3M
45%
72% 43%
69% 41%
32% 47% 43% 64%
14,163 32% 47% 43%
5,825
302 14,163
300
6,279 298
8,382
108 130 3,058 6,279 8,382
6,290 5,765 114 2,362
320 4,922
2,425 - 981 6,290 5,765 2,362
3,343 1,689 3,520 2,425 -
192 1,066 1,689
5,458 172 1,317 184 247 139 3,343 3,520
2,947 464
2,296 2,252 5,458 4 1,317 247
691 135 2,947 903
464
2,296 2,252
2016A 2017A 2018A 2018B
4 QLogistics
2020 3Q2021 4 Q 2from
Share of Profit 0 2 1JV's Asset Monetization 4Q2020 2016A 3 Q 2 0 2 12 0 1 7 A 42 0Q128 0A 2 1 2018B
Industrial Development Asset Monetization to HREIT Logistics Share of Profit from JV's Asset Mon
Logistics Revenue Industrial Revenue Normalized Margin
Margin Logistics Revenue Share of Profit from JV's Asset Monetization
Industrial Development Asset Monetization to HREIT
Industrial Revenue Asset Monetization to HREIT Margin
Normalized Margin
The GPM in 4Q2021 decreased due to change in product mix between The GPM from Revenue from Land Business and Sale of Properties in 4Q2021
BTS and RBF/RBW. increased to 45% from the same period of last year, according to higher margin
from asset monetization to WHART as well as higher margin from plot of land
transferred.
Note : Gross profit margin on consolidated financial statement is different from that on operating financial statement (genuine performance)
due to the effect of PPA adjustment after acquisition 642021 Financial Performance
Performance by Business (12 Months)
RENTAL PROPERTY BUSINESS (NORMALIZED) LAND BUSINESS AND SALE OF PROPERTIES (NORMALIZED)
Unit: THB mm Real GPM before PPA of 2021 : 59% Unit: THB mm
Real GPM before PPA of 2021 : 70%
(Only Land Sale excluded Other Land Business and Sale of Properties Incomes )
12M 12M
70% 70% 48%
46%
32% 47% 43% 45%
32% 47% 43%
14,163 42%
14,163
6,665
1,155 1,161
6,279 8,382
6,279 4,252 8,382
442 469
6,290 5,765 2,362
320 4,935
2,425 - 6,290 5,765 982 2,362
2,425 -
3,343 1,689 3,520 1,066
3,343 1,689 3,520
713
5,458
691
1,317 247
2,947 464 5,458 1,317 1,884 247 1,730
2,296 2,252 2,947 464
2,296 2,252
22 00 1260A 2017A 2 0 2210Share
18A 2018B 2020 2021
Logistics 2 0 1 6from
of Profit A JV's Asset Monetization
2017A 2018A 2018B
Logistics Share of Profit from JV's Asset Monetization
Industrial Development Asset Monetization to HREIT Logistics Revenue Industrial Revenue Share of Profit from JV's Asset Monetization
Logistics Revenue Industrial Revenue Industrial Development
Normalized Margin Asset Monetization to HREIT
Margin
Margin
Normalized Margin Asset Monetization to HREIT
Normalized Margin included Other Land Business and Sale of
Properties Incomes (1)
The GPM in 2021 stood at 70% as a result of increase in occupancy The GPM from Revenue from Land Business and Sale of Properties (excluded
rate of Built-to-Suit and RBF/RBW Y-o-Y. Other Land Business and Sale of Properties Incomes (1)) in 2021 increased to
45%, according to higher margin from plot of land transferred as well as lower
margin from Sale of Investment Properties from Logistics business.
There were revenue recognition of right of way amounting of THB 125 mm in
2021 which decreased from THB 397 mm in 2020.
Remark :(1) Other Land Business and Sale of Properties Incomes included Right of Way Compensation
Note : Gross profit margin on consolidated financial statement is different from that on operating financial statement (genuine performance)
due to the effect of PPA adjustment after acquisition 65You can also read