What Are the Reasons Behind the Economic Performance of the Hungarian Beer Industry? The Case of the Hungarian Microbreweries - MDPI
←
→
Page content transcription
If your browser does not render page correctly, please read the page content below
sustainability

Article
What Are the Reasons Behind the Economic Performance of the
Hungarian Beer Industry? The Case of the Hungarian
Microbreweries
Lili Jantyik, Jeremiás Máté Balogh                  and Áron Török *

                                          Department of Agribusiness, Corvinus University of Budapest, 1093 Budapest, Hungary;
                                          lili.jantyik@uni-corvinus.hu (L.J.); jeremias.balogh@uni-corvinus.hu (J.M.B.)
                                          * Correspondence: aron.torok@uni-corvinus.hu

                                          Abstract: In terms of absolute alcohol consumption and total quantity consumed, beer is the most
                                          consumed alcoholic beverage in Hungary. The Hungarian beer industry is highly concentrated,
                                          the three largest, foreign-owned companies ruled the market for almost 90% of total turnover in
                                          2009–2017. The study investigates the factors influencing the Hungarian beer industry’s economic
                                          performance, special attention given to the microbreweries. The analysis applied panel-data linear
                                          models for the period of 2009–2017. The financial performance of breweries is represented by
                                          companies’ turnover, Earnings Before Interest and Taxes (EBIT) and profit along with explanatory
                                          variables of the age of brewery, Social Media activity, geographical location, direct sales, and impact of
                                          tax reduction. Breweries with direct sales channels reached significantly higher sales, EBIT and profit.

                                   Breweries situated in or close to the capital are the most profitable due to the higher demand for high-
                                          quality beer, in contrast, the distance from the capital had a negative impact on the firms’ performance.
Citation: Jantyik, L.; Balogh, J.M.;
                                          The Social Media activity–often used as the only promotion channel for the microbrewery–positively
Török, Á. What Are the Reasons
                                          impacts the brewery’s profitability. Finally, tax reduction for small breweries introduced in 2012 had
Behind the Economic Performance of
the Hungarian Beer Industry? The
                                          the most significant positive influence on the industry.
Case of the
Hungarian Microbreweries.                 Keywords: beer; microbrewery; profitability; Social Media activity; direct sales; short food supply
Sustainability 2021, 13, 2829.            chain; panel regression; Hungary
https://doi.org/10.3390/su13052829

Academic Editor: Giuseppe
Antonio Di Vita                           1. Introduction
                                          1.1. Introduction
Received: 17 January 2021
                                               As the most popular alcoholic beverage globally, the beer industry is significant to
Accepted: 2 March 2021
                                          many countries’ economies. Breweries are producing worldwide, and beer is the most
Published: 5 March 2021
                                          popular alcoholic beverage for consumption in numerous countries. The beer industry
                                          has in annual revenues of 294.5 billion USD globally [1]. The top beer exporting country
Publisher’s Note: MDPI stays neutral
                                          in the world is Mexico, which accounted for 18% of the global export share, followed by
with regard to jurisdictional claims in
published maps and institutional affil-
                                          the Netherlands, Germany and Belgium. China and the United States lead global beer
iations.
                                          production with more than 35% share of the total output, followed by Brazil, Russia, and
                                          Germany in the row. Globally, the biggest importers are the USA (with more than 34%
                                          share of the total import), United Kingdom (5.82%), France (5.34%), Italy (5.13%) and
                                          Canada (4.74%). Between 2008 and 2017, Namibia had the best comparative advantages
                                          in beer trade, followed by Jamaica, Mexico, Kenya, Serbia, Portugal and the Netherlands.
Copyright: © 2021 by the authors.
                                          The biggest beer exporters (Mexico and Netherlands in particular) also had comparative
Licensee MDPI, Basel, Switzerland.
                                          advantages [1,2]. In 2018, the Czech Republic, Austria, Germany, Romania and Poland had
This article is an open access article
distributed under the terms and
                                          the highest per capita beer consumption rate globally [3].
conditions of the Creative Commons
                                               Microbreweries have their new renaissance worldwide in recent decades. As defined
Attribution (CC BY) license (https://
                                          by the Brewers Association [4], microbreweries produce less than 15,000 barrels of beer per
creativecommons.org/licenses/by/          year and sell 75 per cent or more of their beer off-site. The craft beer revolution began in
4.0/).                                    the United States, after the strict alcohol ban and, since 1978, the Federal Law has allowed

Sustainability 2021, 13, 2829. https://doi.org/10.3390/su13052829                                    https://www.mdpi.com/journal/sustainability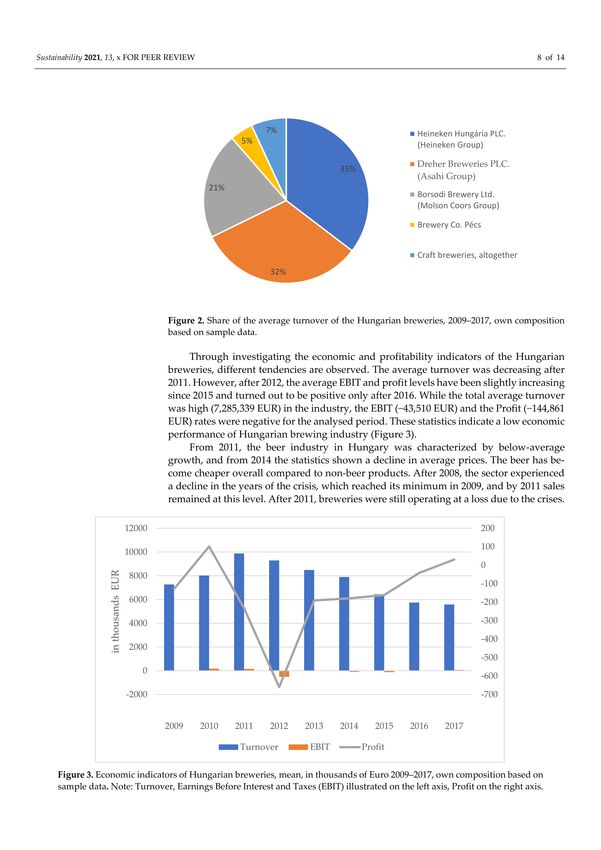
Sustainability 2021, 13, 2829                                                                                           2 of 14

                                home brewing. McCullough et al. [5] examined the relationship between home brewing
                                legislation and the beer industry in the United States and found that the new legislation
                                significantly impacted the industry’s structure and growth. Previous studies suggested
                                that craft beers have spread around the world for very different reasons. More and
                                more conscious consumers are looking for a special taste or a solution for ethical issues,
                                including sustainability. Such phenomena may have led to the emergence of breweries
                                that favour the long-term economic, environmental and social benefits associated with
                                sustainability [6]. In a certain way, microbreweries might be considered social innovations
                                as their development is heavily determined by the local conditions. Therefore, instead of the
                                scaling up mechanism, these start-up enterprises have to focus on the adaption to the local
                                context [7]. Microbreweries are low-volume, high-margin businesses that contribute to local
                                communities through job opportunities and skilled employment, however, some critical
                                issues may be the microbreweries’ longevity and stability, as well as their dependence
                                on customers’ preferences in terms of localism. Compared to large breweries, in terms of
                                environmental aspects, microbreweries may be more environmentally friendly in transport,
                                at least in the case of beer produced with local ingredients and delivered to local markets.
                                On the other hand, microbreweries might be less efficient in terms of production [8].
                                US examples also showed that close cooperation among nascent craft breweries is typical,
                                mainly in the field of process technology development, procurement, inbound logistics
                                and marketing. This also reinforces that these start-ups should consider each other not
                                only as competitors [9].
                                      Hart [10] used an experimental approach to measure consumers’ willingness to pay
                                for locally produced beer produced by an independent brewery. Results confirmed that
                                consumers prefer these beers and are willing to pay more for these products.
                                      The book by Garavaglia and Swinnen [11] gave a comprehensive overview of the
                                economic perspectives of the craft beer inside the global beer industry and explored the
                                craft beer market in different countries. Depenbusch et al. [12] found that the trend of craft
                                beers in Germany is less dynamic than in other countries. They argued that the German
                                beer market’s low concentration might explain why new entrants are less common than in
                                other countries. Weersink et al. [13] came to that conclusion that the beer sector has changed
                                dramatically in Canada, over the last 30 years per capita beer consumption has fallen by
                                about a third, and market share has shifted from light-bodied lager beer to craft beers
                                differentiated by several taste and process attributes. Sales of craft beer have increased
                                decuple in the last decade and now account for 6% of the market. The total number of
                                breweries now exceeds 640, and a clear majority of them are considered microbreweries.
                                      Other country-specific studies analyse the craft beer industry from different perspec-
                                tives. Fastigi et al. [14] focused on a particular group of agricultural breweries in Italy,
                                Corsini et al. [15] examined environmental performance in the craft beer industry, also
                                in Italy. The findings of Alfeo et al. [16] showed that the Sicilian craft beer industry is
                                characterised by an essential dependence on the imported malts, hops and yeasts and the
                                examined breweries use just limited amount of local raw materials. Furthermore, the char-
                                acteristics of the processing plants and the sales channels seem to influence the products’
                                diversification and the Sicilian craft breweries’ turnover levels. Koch and Sauerbronn [17]
                                analysed the craft beer consumption in Brazil and realised that “Drink less, drink better” is
                                the main motto of the Brazilian craft beer consumers, who show commitment to enjoyment
                                and responsibility while rejecting mass-produced beer and antisocial behaviours. Meyerd-
                                ing et al. [18] focused on consumer preferences for beer attributes in the German market.
                                The attributes “type,” “price,” and “origin” had the highest importance for the majority of
                                consumers.
                                      The beer revolution reached Hungary in the 2010s, with an increasing number of
                                breweries starting to brew new beer types (IPA, APA, stout, wild ale, session, gose). In 2017,
                                according to Molnár and Tátrai [19], 56 microbreweries operated in Hungary. According
                                to Hajdók et al. [20], the market for small-scale breweries in Hungary may seem satu-
                                rated. However, new entrants still represent a moderate threat for the existing companies,
Sustainability 2021, 13, 2829 3 of 14
which may be capital-intensive newly established innovative companies, subsidiaries of
domestic companies, or even foreign expanding breweries. This threat for older breweries
can be reduced if a brewery in a market already has a sufficient market share, and its brand
is one of the more well-known ones.
The econometric analyses of the Hungarian market showed that the company’s size
has no linear effect on the chances of survival among microbreweries. In contrast, other
company-specific feature, such as export, the age of the company does not affect the
likelihood of survival. Among the characteristics of the industry, the level of growth,
concentration, and intensity of entry play a significant role in the survival chances of
small-scale breweries [21,22].
Therefore, this paper aims to analyse the factors influencing the Hungarian beer
industry’s economic performance based on unbalanced panel data on active Hungarian
breweries between 2009 and 2017. The study applies panel data econometrics.
1.2. Global Beer Industry
The global beer industry has undergone a steady process of consolidation. Fifteen
years ago, the international beer industry was still fragmented but since then, various com-
panies have merged through acquisitions (e.g., the 60 billion U.S. dollar merger between
Anheuser-Busch (St. Louis, MO, USA) and InBev (Leuven, Belgium) in 2008; Heineken’s
(Amsterdam, The Netherlands) 24 billion U.S. dollar acquisition of Asia Pacific Brew-
eries (Singapore) in 2012). In 2016, Anheuser-Busch InBev (AB InBev (Leuven, Belgium))
controlled almost 30% of the global beer market. This international brewing company
with headquarters in Belgium and the USA was responsible for producing, importing,
and distributing many global brands such as Budweiser, Stella Artois, Beck’s, Corona, Leffe
and Hoegaarden. These statistics show that in 2019 AB InBev (Leuven, Belgium) was the
largest beer company globally, with sales amounting to approximately 54.6 billion U.S.
dollars [23].
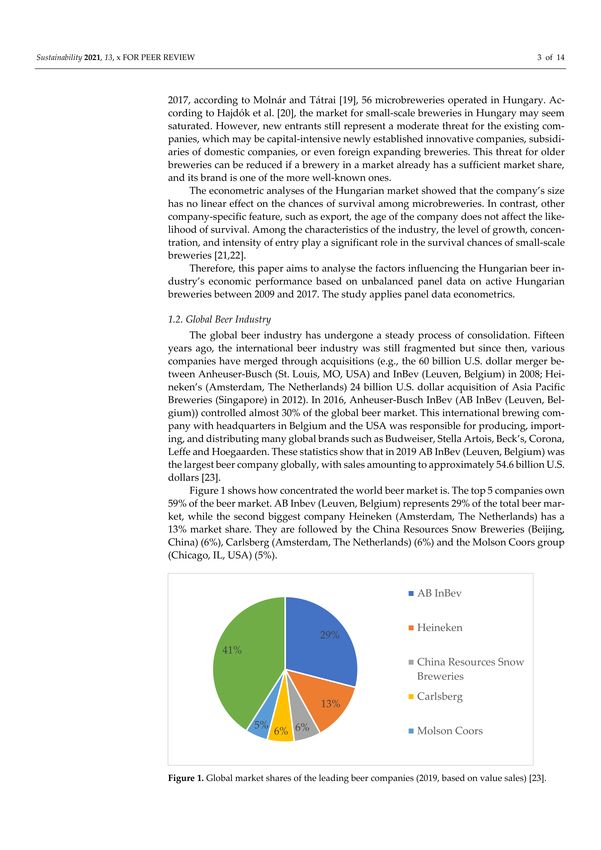
Figure 1 shows how concentrated the world beer market is. The top 5 companies
own 59% of the beer market. AB Inbev (Leuven, Belgium) represents 29% of the total beer
market, while the second biggest company Heineken (Amsterdam, The Netherlands) has
a 13% market share. They are followed by the China Resources Snow Breweries (Beijing,
China) (6%), Carlsberg (Amsterdam, The Netherlands) (6%) and the Molson Coors group
(Chicago, IL, USA) (5%).
Figure 1. Global market shares of the leading beer companies (2019, based on value sales) [23].
2. Materials and Methods
In our research, we attempt to identify the factors influencing the profitability of the
Hungarian microbreweries. We have analysed all the active players of the Hungarian beerSustainability 2021, 13, 2829 4 of 14
industry, using the financial data of the companies available in the M and A Research
Catalyst database (2018), from 2009 through 2017. We selected the companies according to
their NACE (Nomenclature of Economic Activities of the European statistical classification)
codes (1105-Manufacture of beer). We restricted our data to breweries with the main activity
of beer production and with an average turnover of less than 1 million EUR for 2009–2017.
We excluded from our calculation the four biggest breweries of Hungary and focused
on the microbreweries with this approach. The breweries’ economic performance was
measured on three levels—turnover, Earnings Before Interest and Taxes (EBIT), and profit
are used as dependent variables. The study examines five hypotheses, which are listed
below in addition to the previous related literature.
Hypothesis 1 (H1): Social Media activity has a positive impact on the microbrewery’s profitability.
The marketing budgets of small craft breweries are far behind those of large indus-
trial breweries. They are usually unable to do commercial campaigns, but still, need to
specifically target potential consumers with their products. In the USA, primary consumers
of craft brewers are millennials, who follow social media, and they are five times more
likely to be influenced by word-of-mouth than advertising [24]. Therefore, these companies
are mostly adverting on websites, social media, and the place of consumption. The result
of Rishika et al. [25] showed that customer engagement through social media increases
customers’ shopping visits. This effect is more significant in the case of a higher level of
activity on the firm’s social sites. Moreover, they found that the impact is more remarkable
for customers who have higher levels of spending and share of the premium and that these
results retain per customer profitability as well. Social media’s usefulness as a marketing
tool in the craft beer industry has already been explained in previous studies [26,27]. Kle-
ban and Nickerson [27] also highlighted that in the past, the financial resources used to be
a key factor for a company to be superior in its marketing efforts, but today the importance
of the social media has brought all kinds of breweries to a common battlefield.
Therefore, based on previous studies’ findings, we suggest that Social Media activity
positively influences Hungarian microbreweries’ economic performance.
Hypothesis 2 (H2): Participating in short food supply chains might increase breweries’ profitability.
In the literature, numerous studies exist (e.g., [28–30]) with a final understanding of
positive impacts of the short supply chains in the food industry. Among others, the paper of
Givens and Dunning [31], in which the authors examined short food supply chains, where
farmers deliver fresh produce directly to restaurants for potentially higher returns, omitting
the costs of intermediary distributors and it also gives a lower barrier to entry for small
and beginner farmers. However, fewer studies are examining the relationship between the
concept of short food supply chain and breweries. Alfeo, Todaro, Migliore, Borsellino and
Schimmenti [16] found that sales channels appear to influence the beers’ diversification and
the turnover levels of the Sicilian craft beer producers. Carter [32] examined the producer
dynamics and consumer politics in quality agricultural supply chains and several product
categories, including quality beers. She found that the emergence of primary food quality
is connected to local political organisation’s strength, and consumers have a greater role
in shaping quality in these markets. Relying on evidence from the United Kingdom (UK)
brewing industry, Mason and McNally [33] highlight distribution channels’ role as a major
barrier to growth in the small business sector. As in the food industry in general, compared
to traditional farm sale channels that sell products through wholesalers, direct-to-consumer
marketing channels have become increasingly outstanding, such as farmer’s markets or
community-supported agriculture [34]. Lee et al. [35] lists the reasons why direct marketing
and sales are better for both sides. The consumer’s benefits are that farm products sold in
the local food market are likely healthier and more fresh [36] [37]. Several buyers support
the local market for fairness, equity and food safety [38,39]. On the other hand, farmers
who sell their products directly can generate higher sales and income [40].Sustainability 2021, 13, 2829 5 of 14
Relying on these previous results, we suggest that breweries participating in short
food supply chains with direct sales channels—in our case, owning a pub—provide higher
profitability than those who sell their products only by third parties.
Hypothesis 3 (H3): Breweries situated in the capital (Budapest) are more profitable because it
provides a higher demand for craft beer.
The location of craft breweries is usually related to several factors. Wojtyra et al. [41]
summarise them, suggesting that these factors are different for large industrial breweries
and microbreweries. In both cases, the raw material base can be an essential question, such
as good-quality water, hops, or malt. However, small breweries are less dependent on
individual raw materials, because of the diversity of beer produced, the smaller scale, and
the limited time they are available. According to this study, other factors can be the market
cost; or in case of the craft breweries—which follows the socioeconomic development and
rising income—the proximity of urban centres. Beer, similar to other beverages, is a heavy
product, and production facilities are trying to be located as close to the final markets as
possible to reduce transportation costs [42]. It follows that craft breweries are established
in densely populated areas because demand is higher and transportation costs are lower
when the units are based near a larger number of purchasers. [43]. According to Baginski
and Bell [44], the number of craft breweries in the United States is strongly influenced by
the size of the population and craft breweries are expanding better in areas with a higher
cost of living, more health facilities, and greater social tolerance. The economic activity in
an area positively affects the establishment of breweries.
In Hungary, the capital city Budapest and her suburb (altogether 2.54 million con-
sumers of the total 10 million Hungarians [45]) matters in terms of sales and the size of the
market. Also, young consumers opened to craft beers and a significant share of university
students are also located in the capital. Nonetheless, most of the craft beer festivals are also
take place in Budapest.
Therefore, like the previous studies, we expect that breweries situated in (or close to)
Budapest are more profitable than breweries in other smaller settlements.
Hypothesis 4 (H4): The age of the brewery has a positive impact on profitability.
The connection between the age of the firm and its profitability had already been
investigated. Among others, Akben-Selcuk [46] found a negative and convex relationship
between firm age and profitability measured by return on assets, return on equity or gross
profit margin. It means that younger businesses experience a decline in their profitability
from the beginning, but they may become profitable again at an old age. Hopenhayn [47]
also concluded that older firms enjoy higher profits and value. In the Hungarian beer
industry, a company survives an average of 4 years, while the median value is 5.9 years;
however, the mean and median lifetimes of microbreweries are less than half that of
non-microbreweries [48].
From these results, we predict that the age of the brewery has a positive impact on
profitability.
Hypothesis 5 (H5): Tax reduction for small breweries introduced in 2012 by the Hungarian
government has a positive impact on industrial profitability.
From 2012 remarkable changes occurred in the excise duties in Hungary. First of
all, the new law made a distinction between breweries (independent producers with an
annual production of fewer than 8000 hectolitres) and beer factories (all the other, bigger
producers). Beside significantly lightened bureaucratic obligations, for the small-scale
producers (breweries) excise duty was reduced by 50 percent. These reductions in entry
barriers had a positive impact on companies and employment [48]. Also, home brewing
up to 1000 litres became tax-free, which could be a competition for craft breweries. In 2016,Sustainability 2021, 13, 2829 6 of 14
the regulation changed again, and the official term of microbreweries was introduced for
independent producers with an annual production of fewer than 20,000 hectolitres. These
companies still have to pay only half of the excise duty paid by the big beer factories.
According to these facts, we suspect that in our results, this tax reduction for small
breweries available from 2012 has a positive impact on the industry’s profitability.
Based on the hypotheses above, the following equations were estimated for the
Hungarian microbreweries:
lnturn = β0 + β1 FBlikeij + β2 OwnPubij + β3 lnDistanceBPij + β4 BreweryAgeij + β5 TaxReductionij + εij (1)
lnEBIT = β0 + β1 FBlikeij + β2 OwnPubij + β3 lnDistanceBPij + β4 BreweryAgeij + β5 TaxReductionij + εij (2)
lnProfit = β0 + β1 FBlikeij + β2 OwnPubij + β3 lnDistanceBPij + β4 BreweryAgeij + β5 TaxReductionij + εij (3)
where
β denotes the estimated coefficients,
β0 captures the constant term,
εij represents the error term.
We pretested the database for Wooldridge [49] autocorrelation and Fisher-type [50]
panel-data unit-root tests. We applied linear panel models using simple OLS, panel-
corrected standard error (xtpcse) and Driscoll and Kraay [46] standard errors estimations
to measure the beer industry’s performance.
To compute the estimates of the standard errors, panel-corrected standard error model
assumes that the disturbances are heteroskedastic and contemporaneously correlated across
panels. In the case of Driscoll and Kraay [51] estimation, the error structure is assumed to
be heteroskedastic, autocorrelated, and correlated between the panels.
The detailed explanation of the data and variables included in the model is sum-
marised in Table 1.
Table 1. Variables included in the panel regression.
Variable Description Data Source Expected Sign
Dependent
the logarithm of the
M and A Research
lnturn brewery0 s turn-over,
Catalyst (2018)
expressed in Euro
the logarithm of the
M and A Research
lnEBIT brewery0 s EBIT,
Catalyst (2018)
expressed in Euro
the logarithm of the
M and A Research
lnProfit brewery0 s EBIT,
Catalyst (2018)
expressed in Euro
Independent
number of the brewery0 s
own data collection from
FBlike Facebook likes (30 June +
the companies site
2020)
dummy variable, =1 if
OwnPub the brewery has its own own data collection +
pub, 0 otherwise
the distance of the
brewery head-quarters
lnDistanceBP own data collection -
from Budapest in
kilometre
the number of closed M and A Research
BreweryAge +
business years Catalyst (2018)
dummy variable, =1 if a
reduced tax applied for
TaxReduction own data collection +
microbreweries in the
given year, 0 otherwiseSustainability 2021, 13, 2829 7 of 14
3. Results
3.1. Performance of the Hungarian Brewing Industry
According to a report of the Brewers of Europe [52], in 2018, Hungary ranked 14th
in the European beer production list. Beer consumption has been on a declining trend in
recent decades. The last year when the country’s annual beer consumption was over 1
billion litres was 1991, while in 2018, Hungarians consumed only 688.9 million litres of
beer [53].
Figure 2 shows the average turnover of the Hungarians breweries between 2009
and 2017. To provide an overall view on the sector, here we also included the non-
microbreweries. On average, Heineken Hungária PLC. (Budapest, Hungary) represented
35% of the total turnover of the industry, followed by Dreher Breweries PLC ((Budapest,
Hungary) (32%) and the Borsodi Brewery Ltd. (Bőcs, Hungary) (21%)). The four biggest
companies together represented 93% of the total turnover. All the other breweries (98
firms) had only a 7% share, indicating that the Hungarian beer market is as concentrated
as the global beer market. Though the world biggest beer company, the AB Inbev (Leuven,
Belgium) currently has no share in the Hungarian market, the other three dominant inter-
national market players (Heineken Group (Amsterdam, The Netherlands), Asahi Group
(Tokyo, Japan) and the Molson Coors (Chicago, IL, USA)) own the biggest Hungarian
beer-producing capacities. The fourth biggest brewery in Hungary (Brewery Co. Pécs
(Pécs, Hungary)) has been owned by Hungarian investors since the change of ownership
in 2017 [54]. These top four brewing companies accounted for an average turnover of more
than 2 million EUR (per company) for the analysed period. The three largest industrial
beer companies are foreign-owned (Heineken—Heineken Group (Amsterdam, The Nether-
lands), Dreher—Asahi Group (Tokyo, Japan), and Borsodi—Molson Coors Group (Chicago,
IL, USA)) and produced nearly 90% of total turnover in 2009–2017.
Figure 2. Share of the average turnover of the Hungarian breweries, 2009–2017, own composition
based on sample data.
Through investigating the economic and profitability indicators of the Hungarian
breweries, different tendencies are observed. The average turnover was decreasing after
2011. However, after 2012, the average EBIT and profit levels have been slightly increas-
ing since 2015 and turned out to be positive only after 2016. While the total average
turnover was high (7,285,339 EUR) in the industry, the EBIT (−43,510 EUR) and the Profit
(−144,861 EUR) rates were negative for the analysed period. These statistics indicate a low
economic performance of Hungarian brewing industry (Figure 3).Sustainability 2021, 13, 2829 8 of 14
Figure 3. Economic indicators of Hungarian breweries, mean, in thousands of Euro 2009–2017,
own composition based on sample data. Note: Turnover, Earnings Before Interest and Taxes (EBIT)
illustrated on the left axis, Profit on the right axis.
From 2011, the beer industry in Hungary was characterized by below-average growth,
and from 2014 the statistics shown a decline in average prices. The beer has become cheaper
overall compared to non-beer products. After 2008, the sector experienced a decline in the
years of the crisis, which reached its minimum in 2009, and by 2011 sales remained at this
level. After 2011, breweries were still operating at a loss due to the crises.
3.2. Factors Influencing Breweries’ Turnover
Regression results have confirmed possible determinants of Hungarian microbrew-
eries’ economic performance and the estimations are valid for most of the profitability
indicators included (turnover, EBIT and profit). To ensure the robustness of the estimations,
three different estimation procedures were performed—ordinary least squares (OLS) with
robust standard error (1), linear regression with panel-corrected standard errors (2) and
regression with Driscoll-Kraay standard errors; and in most cases, the same results were
obtained. Wooldridge [49] test confirmed the existence of first-order autocorrelation; there-
fore, panel-corrected and Driscoll-Kraay standard errors are more appropriate. Fisher-type
panel-data unit-root tests with augmented Dickey-Fuller tests reject the hypothesis of all
panels contain unit roots for one or two lags.
Regression results are summarised in Tables 2–4 for the three profitability indicators
applied in logarithm form.Sustainability 2021, 13, 2829 9 of 14
Table 2. Results for brewery’s turnover.
(1) (2) (3)
Variables Simple OLS xtpcse xtscc
lnturn lnturn lnturn
FBlike 0.000112 ** 0.000112 *** 0.000112 *
(4.85 × 10−5 ) (3.92 × 10⁻⁵ ) (5.04 × 10⁻⁵ )
OwnPub 0.796 *** 0.796 *** 0.796 ***
(0.263) (0.220) (0.225)
lnDistanceBP −0.0219 −0.0219 −0.0219
(0.105) (0.0833) (0.115)
BreweryAge 0.0428 *** 0.0428 *** 0.0428 ***
(0.0150) (0.00892) (0.0104)
TaxReduction 0.713 ** 0.713 ** 0.713 **
(0.301) (0.296) (0.236)
Constant 8.483 *** 8.483 *** 8.483 ***
(0.566) (0.395) (0.342)
Observations 421 421 421
R-squared 0.070 0.070 0.070
Number of groups 79 79
Standard errors in parentheses. *** p < 0.01, ** p < 0.05, * p < 0.1.
Table 3. Results for brewery’s EBIT.
(1) (2) (3)
Variables Robust OLS xtpcse xtscc
lnEBIT lnEBIT lnEBIT
FBlike 0.000154 *** 0.000154 *** 0.000154 ***
(0.000) (0.000) (0.000)
OwnPub 0.527 ** 0.527 *** 0.527 ***
(0.255) (0.162) (0.162)
lnDistanceBP −0.170 * −0.170 ** −0.170 **
(0.0917) (0.0685) (0.0685)
BreweryAge 0.0256 * 0.0256 *** 0.0256 ***
(0.0149) (0.00765) (0.00765)
TaxReduction 0.758 ** 0.758 *** 0.758 ***
(0.365) (0.266) (0.266)
Constant 7.658 *** 7.658 *** 7.658 ***
(0.564) (0.344) (0.344)
Observations 259 259 259
R-squared 0.115 0.115 0.115
Number of TaxID 65 65
Standard errors in parentheses. *** p < 0.01, ** p < 0.05, * p < 0.1.Sustainability 2021, 13, 2829 10 of 14
Table 4. Results for brewery’s profit.
xtpcse (1) (2) (3)
simple OLS xtpcse xtscc
Variables
lnProfit lnProfit lnProfit
FBlike 0.000177 *** 0.000177 *** 0.000177 ***
(0.000) (0.000) (0.000)
OwnPub 0.439 0.439 ** 0.439
(0.284) (0.210) (0.252)
lnDistanceBP −0.162 −0.162 * −0.162
(0.110) (0.0897) (0.0914)
BreweryAge 0.0110 0.0110 0.0110
(0.0159) (0.0141) (0.0166)
TaxReduction 0.931 *** 0.931 *** 0.931 ***
(0.342) (0.228) (0.193)
Constant 7.394 *** 7.394 *** 7.394 ***
(0.599) (0.312) (0.265)
Observations 254 254 254
R-squared 0.124 0.124 0.124
Number of TaxID 65 65
Standard errors in parentheses. *** p < 0.01, ** p < 0.05, * p < 0.1.
Comparing the results, the estimation is the most robust for EBIT, followed by turnover
and profit.
Table 2 shows the factors that have an impact on the turnover of the examined
breweries. The direct sales channel and tax reduction have the most positive effect on
turnover. The distance from Budapest has a negative impact, although this result is not
significant in the case of the turnover. The number of Facebook likes, and the breweries’
age have a mild effect on the turnover.
3.3. Factors Influencing Breweries’ EBIT
Table 3 indicates the factors that have an impact on the EBIT of the examined compa-
nies. The direct sales channel and the tax reduction have the most positive effect also on
the firm’s EBIT. The distance from Budapest has a significant adverse effect. The number
of Facebook likes and the age of the breweries have a mild impact on the EBIT as well.
3.4. Factors Influencing Breweries’ Profit
Table 4 highlights the factors that have an impact on the profit of the examined
companies. The direct sales channel (only significant with the linear regression model
with panel-corrected standard errors method) and the tax reduction, in particular, have the
most positive effect on breweries’ profit level. The distance from Budapest again harms the
profit. Facebook (FB) likes also have a small but positive outcome.
4. Discussion
Regression results have justified the selected determinants of the economic perfor-
mance for Hungarian breweries, and the estimations were valid for all profitability indica-
tors included.
Our result suggests the benefits of short food supply chains (H2) are prevalent in the
beer industry, likewise the study of Givens and Dunning (2017). Breweries with direct sales
channels (such as own pubs) showed significantly higher sales, EBIT, and profit than those
selling their beer products by marketing channels. Lee, Liu and Chang [35] highlighted
several reasons why it is worth doing direct sales, such as the breweries can generate higher
sales and income in this way.
Breweries situated in Budapest (H3) are the most profitable since the capital city
provides a higher demand for high-quality beer; by contrast, the distance from the capitalSustainability 2021, 13, 2829 11 of 14
city hurts the company’s performance. Gatrell et al. (2014) explain it by the fact the beer is
a heavy product and production facilities are trying to locate as close to the final market
as possible to reduce costs. The Social Media activity (FB likes) (H1) and the age of the
breweries (H4) had a modest but positive impact on the industrial and micro brewery’s
profitability and turnover. Besides the Social Media platforms, cooperative marketing
(e.g., organizing and participating at beer festivals) among start-up breweries might also
result in cost-effective and targeted marketing activities [9] and can contribute to the general
start-up culture in the national food and beverage industry.
Finally, tax reduction (H5) for small breweries introduced in 2012 by the Hungarian
government had the most significant positive impact on industrial profitability. In con-
clusion, the government’s aim to support small scale beer production has been successful
because it helped the survival of the Hungarian microbreweries. In general, Hungarian
results also underline the importance of supportive governmental attitude, because similar
to other countries (e.g., in the USA [5]), microbreweries are highly dependent on regulation,
and on taxation in particular.
As the business environment for the food and beverage industry in Central and
Eastern-Europe is very similar [55], our results (except the country-specific taxation envi-
ronment) might be valid not only in Hungary but also in the wider region.
5. Conclusions
Breweries can be found worldwide, and beer is the most popular alcoholic beverage
in several countries in the world. Beer is the most consumed alcoholic drink in Hungary.
Nowadays, drinking craft beers has become more popular among Hungarian customers
than industrial beers, which is why their market analysis is also gradually becoming a
relevant research topic.
In this paper, we analysed the factors influencing the Hungarian craft beer market’s
economic performance for the period of 2009–2017. Although the craft breweries represent
only 7% of the Hungarian beer market, they are continually growing and several consumer
segments have heavily affected by this trend. To measure the industry’s performance, linear
panel models were applied by employing OLS, panel-corrected standard error and Driscoll
and Kraay standard errors estimations. The economic performance of the Hungarian
breweries was captured by companies’ turnover, EBIT and profit. Our hypothesis tested
the role of the age, Social Media activity, geographical location, direct sales and impact of
brewery’s tax reduction as the explanatory variables. The descriptive statistics indicate a
low economic performance of the Hungarian brewing industry associated with moderate
profitability, especially before introducing the tax allowance in 2012.
We concluded that, although social media has, right now, a minor impact on the
economic performance of microbreweries, by contrast, it is the cheapest way for micro-
breweries to promote their products and keep in contact with their consumers, which was
especially true during the lockdown caused by the COVID-19 pandemic. Therefore, using
the opportunities provided by social media is key for marketing strategies among the
Hungarian microbreweries as it might stimulate sales and popularity.
Short food supply chains, direct sales channels and the proximity to the capital city
(Budapest) have been proved to be essential factors in achieving higher profits in this
industry. Besides reducing their costs by eliminating shipping or intermediate traders,
keeping continuous personal contact with their consumers is also needed for Hungarian
brewery.
Tax reduction for small breweries introduced in 2012 by the Hungarian government
had the most significant positive impact on industrial profitability. Following the measure,
profitably curve of craft breweries started to rise significantly.
The results show that the personal relationship between companies and their cus-
tomers is significant in the craft beer industry. Furthermore, the supportive government
provisions also provided a stimulative effect on the market. The profitability of craft
breweries is heavily exposed to the legal environment and tax regulation.Sustainability 2021, 13, 2829 12 of 14
The study modelled the economic performance of Hungarian microbreweries, focus-
ing on external factors (tax reduction, distance from the capital, age, social media); however,
firm-related, operational factors (number of employees, assets, investments, innovation
and technology etc.) are also influencing the profitability of the Hungarian breweries that
are not considered by this study. This is certainly one of the limitations of the study, and
those factors not covered by our research might serve as the basis for another investigation.
Author Contributions: Conceptualisation, L.J. and Á.T.; methodology, J.M.B.; software, J.M.B.;
formal analysis, L.J., J.M.B. and Á.T.; investigation, L.J., J.M.B. and Á.T.; resources, L.J.; writing—
original draft preparation, L.J., J.M.B. and Á.T.; writing—review and editing, L.J., J.M.B. and Á.T.;
visualisation, L.J.; supervision, Á.T.; funding acquisition, Á.T. All authors have read and agreed to
the published version of the manuscript.
Funding: This paper was supported by the National Research, Development and Innovation Office
project FK124800 “Economical and Social Impacts of Food Quality Schemes and Short Food Supply
Chains in Hungary” and by the National Research, Development and Innovation Office Project No.
119669“Competitiveness of Agriculture in International Trade: A Global Perspective”.
Institutional Review Board Statement: Not applicable.
Informed Consent Statement: Not applicable.
Data Availability Statement: No new data were created or analyzed in this study. Data sharing is
not applicable to this article.
Conflicts of Interest: The authors declare no conflict of interest.
References
1. Feng, J. All About The Beer Industry. Worldatlas. 2017. Available online: https://www.worldatlas.com/articles/all-about-the-
beer-industry.html (accessed on 20 October 2020).
2. Török, Á.; Szerletics, Á.; Jantyik, L. Factors Influencing Competitiveness in the Global Beer Trade. Sustainability 2020, 12, 5057.
[CrossRef]
3. Kirin Beer University Report. Global Beer Consumption by Country in 2018; Kirin Holdings Company Limited. Available online:
https://www.kirinholdings.co.jp/english/news/2019/1224_01.html (accessed on 24 December 2019).
4. Brewers Association. 2020. Available online: https://www.brewersassociation.org/ (accessed on 10 January 2021).
5. McCullough, M.; Berning, J.; Hanson, J.L. Learning by Brewing: Homebrewing Legalization and the Brewing Industry. Contemp.
Econ. Policy 2019, 37, 25–39. [CrossRef]
6. Bertella, G.; Halland, H.; Reykdal, O.; Martin, P. Sustainable value: The perspective of microbreweries in peripheral northern
areas. In Case Studies in the Beer Sector; Capitello, R., Maehle, N., Eds.; Woodhead Publishing: Glossop, UK, 2021.
7. Deserti, A.; Rizzo, F. Context dependency of social innovation: In search of new sustainability models. Eur. Plan. Stud. 2020, 28,
864–880. [CrossRef]
8. Wells, P. Economies of Scale Versus Small Is Beautiful: A Business Model Approach Based on Architecture, Principles and
Components in the Beer Industry. Bus. Models Sustain. Entrep. Innov. Transform. 2016, 29, 36–52. [CrossRef]
9. Flanagan, D.J.; Lepisto, D.A.; Ofstein, L.F. Coopetition among nascent craft breweries: A value chain analysis. J. Small Bus. Enterp.
Dev. 2018, 25, 2–16. [CrossRef]
10. Hart, J. Drink Beer for Science: An Experiment on Consumer Preferences for Local Craft Beer. J. Wine Econ. 2018, 13, 429–441.
[CrossRef]
11. Garavaglia, C.; Swinnen, J. Economic Perspectives on Craft Beer; Springer Nature: Basel, Switzerland, 2018.
12. Depenbusch, L.; Ehrich, M.; Pfizenmaier, U. Craft Beer in Germany. New Entries in a Challenging Beer Market. In Economic
Perspectives on Craft Beer; Garavaglia, C., Swinnen, J., Eds.; Springer: Basel, Switzerland, 2018; pp. 183–210. [CrossRef]
13. Weersink, A.; Probyn-Smith, K.; Von Massow, M. The Canadian Craft Beer Sector. In Economic Perspectives on Craft Beer; Garavaglia,
C., Swinnen, J., Eds.; Springer: Basel, Switzerland, 2018; pp. 89–113. [CrossRef]
14. Fastigi, M.; Vigano, E.; Esposti, R. The italian microbrewing experience: Features and perspectives. Bio-Based Appl. Econ. 2018, 7,
59–86. [CrossRef]
15. Corsini, F.; Appio, F.P.; Frey, M. Exploring the antecedents and consequences of environmental performance in micro-enterprises:
The case of the Italian craft beer industry. Technol. Forecast. Soc. Chang. 2019, 138, 340–350. [CrossRef]
16. Alfeo, V.; Todaro, A.; Migliore, G.; Borsellino, V.; Schimmenti, E. Microbreweries, brewpubs and beerfirms in the Sicilian craft
beer industry. Int. J. Wine Bus. Res. 2019, 32, 122–138. [CrossRef]
17. Koch, E.S.; Sauerbronn, J.F.R. “To love beer above all things”: An analysis of Brazilian craft beer subculture of consumption. J.
Food Prod. Mark. 2019, 25, 1–25. [CrossRef]Sustainability 2021, 13, 2829 13 of 14
18. Meyerding, S.G.H.; Bauchrowitz, A.; Lehberger, M. Consumer preferences for beer attributes in Germany: A conjoint and latent
class approach. J. Retail. Consum. Serv. 2019, 47, 229–240. [CrossRef]
19. Molnár, L.; Tátrai, M. A kézműves sörpiac helyzete és lehetőségei Magyarországon. Gki Gazdaságkutató Zrt 2017, 5–25. Available
online: https://www.gki.hu/wp-content/uploads/2018/01/GKI-So%CC%88rtanulma%CC%81ny.pdf (accessed on 22 February
2021).
20. Hajdók, F.; Kelemen, B.; Turjánszki, B. Nemzetközi üzleti stratégia kidolgozása a MONYO Brewing Co. számára. Bp. Corvinus
Egy. 2020.
21. Bojnec, Š.; Ferto, I. European enlargement and agro-food trade. Can. J. Agric. Econ. 2008, 56, 563–579. [CrossRef]
22. Fertő, I.; Major, A.; Podruzsik, S.; Fogarasi, J. Be- és kilépés egy érett iparágban: A magyar kisüzemi sőrfőzdék esete. Hung. J.
Food Nutr. Mark. 2016, 11, 39–46.
23. Statista. Global Market Share of the Leading Beer Companies 2019, Based on Volume Sales. Available online: https://www.
statista.com/statistics/257677/global-market-share-of-the-leading-beer-companies-based-on-sales/ (accessed on 10 December
2020).
24. Moore, M.S.; Reid, N.; McLaughlin, R.B. The locational determinants of micro-breweries and brewpubs in the United States. In
Brewing, Beer and Pubs; Springer: Berlin/Heidelberg, Germany, 2016; pp. 182–204.
25. Rishika, R.; Kumar, A.; Janakiraman, R.; Bezawada, R. The Effect of Customers’ Social Media Participation on Customer Visit
Frequency and Profitability: An Empirical Investigation. Inf. Syst. Res. 2013, 24, 108–127. [CrossRef]
26. Cabras, I.; Bamforth, C. “From reviving tradition to fostering innovation and changing marketing: The evolution of microbrewing
in the UK and US, 1980–2012. Bus. Hist. 2015, 58, 625–646. [CrossRef]
27. Kleban, J.; Nickerson, I. To brew, or not to brew–that is the question: An analysis of competitive forces in the craft brew industry.
J. Int. Acad. Case Stud. Agric. Econ. 2012, 18, 59–81.
28. Török, Á.; Agárdi, I. Társadalmi vállalkozások gasztronómiai lehetőségei a rövid élelmiszerellátási láncok bevonásával Mag-
yarországon. Vez. Bp. Manag. Rev. 2020, 51, 74–84. [CrossRef]
29. Inwood, S.M.; Sharp, J.S.; Moore, R.H.; Stinner, D.H. Restaurants, chefs and local foods: Insights drawn from application of a
diffusion of innovation framework. Agric. Hum. Values 2008, 26, 177–191. [CrossRef]
30. Malak-Rawlikowska, A.; Majewski, E.; Was, ˛ A.; Borgen, S.O.; Csillag, P.; Donati, M.; Freeman, R.; Hoàng, V.; Lecoeur, J.-
L.; Mancini, M.C.; et al. Measuring the Economic, Environmental, and Social Sustainability of Short Food Supply Chains.
Sustainability 2019, 11, 4004. [CrossRef]
31. Givens, G.; Dunning, R. Distributor intermediation in the farm to food service value chain. Renew. Agric. Food Syst. 2018, 34,
268–270. [CrossRef]
32. Carter, E. Desperately seeking happy chickens: Producer dynamics and consumer politics in quality agricultural supply chains.
Int. J. Soc. Econ. 2020. ahead-of-print. [CrossRef]
33. Mason, C.M.; McNally, K.N. Market change, distribution, and new firm formation and growth: The case of real-ale breweries in
the United Kingdom. Environ. Plan. A 1997, 29, 405–417. [CrossRef]
34. Low, S.; Vogel, S. Direct and Intermediated Marketing of Local Foods in the United States. USDA-Ers Econ. Res. Rep. 2011,
128, 1–38. Available online: https://www.ers.usda.gov/webdocs/publications/44924/8276_err128_2_.pdf?v=0 (accessed on 13
February 2021). [CrossRef]
35. Lee, B.; Liu, J.Y.; Chang, H.H. The choice of marketing channel and farm profitability: Empirical evidence from small farmers.
Agribusiness 2020, 36, 402–421. [CrossRef]
36. Bond, J.; Thilmany, D.; Bond, C. What influences consumer choice of fresh produce purchase location? J. Agric. Appl. Econ. 2009,
41, 61–74. [CrossRef]
37. Gumirakiza, J.; Curtis, K.; Bosworth, R. Who attends farmers’ markets and why? Understanding consumers and their motivations.
Int. Food Agribus. Manag. Rev. 2014, 17, 65–82.
38. Maples, M.; Morgan, K.; Interis, M.; Harri, A. Who buys food directly from producers in the Southeastern United States? J. Agric.
Appl. Econ. 2013, 45, 509–518. [CrossRef]
39. Thilmany, D.; Bond, C.; Bond, J. Going local: Exploring consumer behavior and motivations for direct food purchases. Am. J.
Agric. Econ. 2008, 90, 1303–1309. [CrossRef]
40. Detre, J.; Mark, T.; Mishra, A.; Adhikari, A. Linkage between direct marketing and farm income: A double-hurdle approach.
Agribusiness 2011, 27, 19–33. [CrossRef]
41. Wojtyra, B.; Kossowski, T.M.; Březinová, M.; Savov, R.; Lančarič, D. Geography of craft breweries in Central Europe: Location
factors and the spatial dependence effect. Appl. Geogr. 2020, 124, 102325. [CrossRef]
42. Gatrell, J.D.; Nemeth, D.J.; Yeager, C.D. Sweetwater, mountain springs, and Great lakes: A hydro-geography of beer brands. In
The Geography of Beer, Regions, Environment, and Societies; Patterson, M., Hoalst-Pullen, N., Eds.; Springer: Berlin/Heidelberg,
Germany, 2014; pp. 89–98.
43. Elzinga, K.G.; Tremblay, C.H.; Tremblay, V.J. Craft beer in the United States: History, numbers, and geography. J. Wine Econ. 2015,
10, 242–274. [CrossRef]
44. Baginski, J.; Bell, T.L. Under-tapped?: An analysis of craft brewing in the southern United States. Southeast. Geogr. 2011, 51,
165–185. [CrossRef]Sustainability 2021, 13, 2829 14 of 14
45. Hungarian Central Statistical Office. Agglomerációk, Településegyüttesek. Available online: www.ksh.hu/docs/hun/xftp/
idoszaki/mo_telepuleshalozata/agglomeracio.pdf (accessed on 13 February 2021).
46. Akben-Selcuk, E. Does Firm Age Affect Profitability? Evidence from Turkey. Int. J. Econ. Sci. 2016, 3, 1–9. [CrossRef]
47. Hopenhayn, H.A. Entry, exit and firm dynamics in long run equilibrium. Econometrica 1992, 60, 1127–1150. [CrossRef]
48. Fertő, I.; Fogarasi, J.; Major, A.; Podruzsik, S. The Emergence and Survival of Microbreweries in Hungary. In Economic Perspectives
on Craft Beer; Palgrave Macmillan, 1st ed.; Palgrave Macmillan: Cham, Switzerland, 2018; pp. 211–228. [CrossRef]
49. Wooldridge, J.M. Econometric Analysis of Cross Section and Panel Data; MIT Press: Cambridge, MA, USA, 2002; Volume 108.
50. Choi, I. Unit root tests for panel data. J. Int. Money Financ. 2001, 20, 249–272. [CrossRef]
51. Driscoll, J.C.; Kraay, A.C. Consistent covariance matrix estimation with spatially dependent panel data. Rev. Econ. Stat. 1998, 80,
549–560. [CrossRef]
52. Brewers of Europe. European Beer Trends. Available online: https://brewersofeurope.org/uploads/mycms-files/documents/
publications/2019/european-beer-trends-2019-web.pdf (accessed on 11 December 2020).
53. Hungarian Central Statistical Office. Sörmérleg. Available online: https://www.ksh.hu/docs/hun/xstadat/xstadat_hosszu/
elm12.html (accessed on 22 December 2020).
54. Pécsi Sörfőzde Zrt. Available online: https://pecsisor.hu (accessed on 5 November 2020).
55. Belyaeva, Z.; Rudawska, E.D.; Lopatkova, Y. Sustainable business model in food and beverage industry-a case of Western and
Central and Eastern European countries. Br. Food J. 2020, 122, 1573–1592. [CrossRef]You can also read