Workforce Futures Working Adults And The Workplace Revolution - A Review of the Evidence - Innovation America
←
→
Page content transcription
If your browser does not render page correctly, please read the page content below
Workforce Futures
       Working Adults
            And
  The Workplace Revolution

         A Review of the Evidence
                     For
   Employers, Educators, and Employees

   (Illustrated with 32 Charts and Graphs)

              Occasional Paper # 3
       Garrison Moore and Robert Bowman
                February 2016
Preface

American employers face an unprecedented challenge in creating and keeping a highly
qualified adult workforce. Traditionally, employers have depended on outside groups –
educators, other employers, and the experience of working adults themselves – to educate
and train most of their staff. Our research indicates this will no longer work.
It is an oft-told story. An ongoing workplace revolution is transforming the nature of work
almost beyond recognition. Occupations requiring mostly heavy lifting, hand sorting and
other largely routine, and often mindless, tasks are disappearing in the face of the
unprecedented mechanization of work and digital disruption of every industry. Unfortunately,
too many Americans lack the skills needed to be productive contributors in a world economy
undergoing such a revolution.
In a mirror image of the fate of those in routine work, the number of jobs requiring more
knowledge, thinking, and flexibility continue unhindered growth, raising the prospect of
widespread skills shortages. Wages are high in the latter jobs and low in the former. The
changing workplace affects every employer and every working adult.
What is absent from the story is the stark fact that most of the workforce of the future is
already working and not going anywhere anytime soon. An estimated 84 percent of the
workforce now employed will still be working in 10 years and two-thirds will be there in 20
years. This emerging workforce crisis jeopardizes the entire economy. Employers across the
country are already reporting critical shortages of required skills – 38 percent in a recent
survey. However, employers and educators have been slow to recognize the danger. The
nation has the resources to address the challenge, if it has the will.
This paper lays out our findings on five major areas relating to the emerging shortages of
qualified working adults. We base the paper‘s text, statistics, and charts on openly available
sources including US Census, the Bureau of Labor Statistics (BLS), the National Center for
Education Statistics (NCES), the National Bureau of Economic Research (NBER), and numerous
peer reviewed academic papers and reports.
We realize that economists, statisticians, and other professionals in the field may wish for a
more detailed analysis. However, we researched and wrote the paper with a lay audience in
mind. We hope that the charts and graphs will help readers better understand the sometimes-
arcane world of workforce economics. We have also attempted to put to rest several myths
about the workforce and the economy.
The authors appreciate and thank the staffs of Bureau of Labor Statistics, National Center for
Education Statistics, and the US Bureau of the Census for their invaluable service to the nation
and patient assistance with the authors. We also acknowledge the contribution of the
Georgetown Center for Education and the Workforce, for its many helpful studies, especially
relating to college graduates in the workforce. Finally, we thank David Moore who provided
meticulous and much-needed editing.
All opinions are those of the authors and do not reflect the position of any of the sources. If
you find any errors or disagree with any of the findings, please let us know. Send comments
to gmoore8131@yahoo.com. Retrieve a PDF of this document at www.innovationamerica.us

                          Garrison Moore and Robert Bowman

                                               1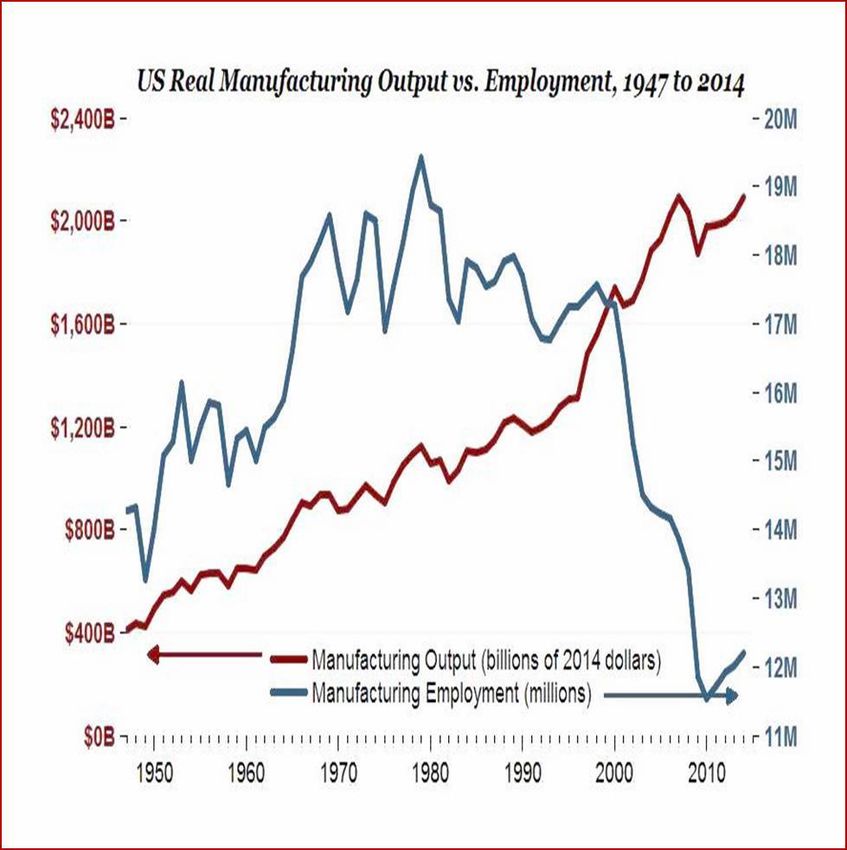
Table of Contents
                                                         Page
Preface                                                  1
Table of Contents                                        2
Summary                                                  4
Part I: Meet the Workforce of the Future                 5
Still There, Till Then                                   6
Figure 1: US Employment 1939-2014                        6
Part II: Revolution in the Nature of Work                7
Workplace Revolution Past and Present                    7
International Trade                                      9
The Great Recession                                      10
Figure 2: US Mfr. Output and Employment 1947-2014        11
Figure 3: Productivity and Workers Pay 1948-2014         12
Disrupted Routines                                       13
Figure 4: Routine Occupations’ Share of Workforce        14
Figure 5: Relative Growth of Occupations 1982-2014       15
Figure 6: Routine/Nonroutine Occupations 1982 – 2012     15
Figure 7: Number of Jobs in Major Occupations            17
Education and the New Workplace                          18
Figure 8: Earnings and Unemployment Rates by Education   19
Figure 9: Unemployment by Education: Adults 25 Plus      20
Figure 10: US Employment by Industry                     21
Working Adults: Dropping Out or Hanging in There         22
Figure 11: Workforce Participation by Age 1970-2014      24
Figure 12: Enrollment Goes Up Participation Goes Down    25
Part III: Skills                                         26
A Qualified Workforce                                    26
Why Trained Employees Stay                               26
Frontline Workers                                        27
Aim First, Shoot Later                                   29
Delving Deeper                                           30
Foundations                                              32
The Softer Side of Work                                  33

                                                2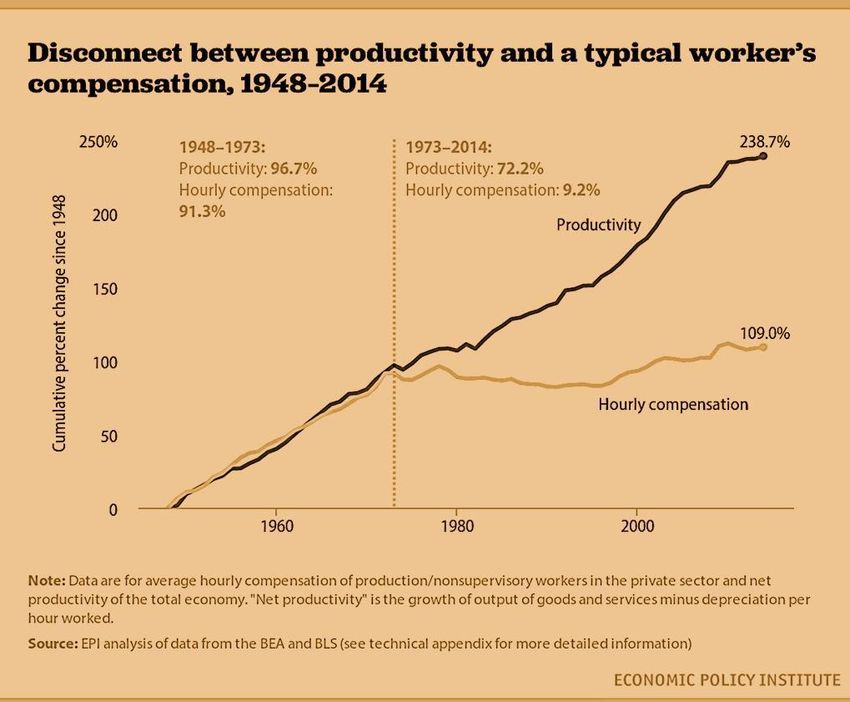
Figure 13: What Essential Skills are Hardest to Hire 34
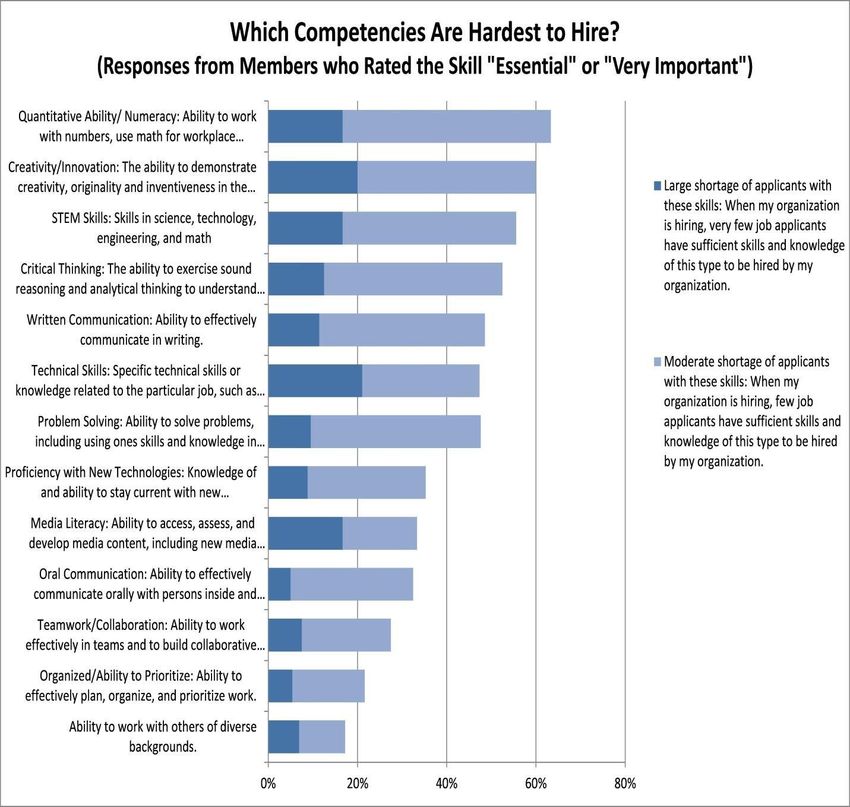
Figure 14: What Competencies are Hardest to Hire 35
Thinking and Problem Solving 36
Keeping Up With Technology 36
Part IV: State Of Learning for Working Adults 38
A Highly Educated Workforce 38
Workplace Learning 39
Figure 15: US Education Attainment 1940-2014 40
Figure 16: Total Private Employment by Size of Firm 41
Figure 17: Estimated Employer Spending on Training 42
The Higher Education System 44
Adult Basic Education 50
Workforce Development Programs 50
Figure 18: Adult Education Participants 2000-2011 51
Licensing and Certification 51
Figure 19: Certifications and Licenses 54
Figure 20: Occupational Certifications Awarded One Year or Less 54
Part V: An Active Workforce Policy 56
Supplemental Charts 58
Figure 21: Workforce Dynamics 59
Figure 22: Share of Workforce by Educational Attainment 60
Figure 23: US Median Household Income 2000-2014 61
Figure 24: Changing Routines 61
Figure 25: The Poor Get Poorer: Falling Wages 2000-2014 62
Figure 26: Change in Occupation Shares 1967-2013 63
Figure 27: Pay and Occupational Patterns 64
Figure 28: Median Wages of Largest Occupations 65
Figure 29: Growing: Occupations with the Largest Growth 66
Figure 30: Shrinking: Occupations with the Largest Losses 67
Figure 31: Pre-Baccalaureate Occupational Credentials 68
Figure 32: FT Workers Enrolled in Education -Training by Income 69
Bibliography 70
The Authors 78
3
Summary
In this paper, we review the facts about the workforce of the next 20 years. We look at the
ongoing revolution in the nature of work and its impact on the workforce.
I.   People Now Working Will Dominate the Future US Workforce An estimated 84
     percent of those now working will still be in the workforce 10 years from now. Today‘s
     working adults will comprise upwards of two thirds of those working in 2035. For
     employers, the current workforce is the primary source of future skilled workers.
II. Nature of Work Is Changing Almost Beyond Recognition Growth in the number of
     jobs in occupations requiring advanced knowledge, skills, and flexibility continues to far
     outpace the growth in the number of jobs in routine occupations largely requiring routine
     and repetitive tasks.
     Jobs in “Routine” Occupations are Fading Fast The economy produced a net 12
     million new jobs from late 2010 through 2015. Yet, the growth has not been equal. More
     than six million jobs lost in occupations involving mostly routine tasks have not returned.
     In 2000, routine occupations made up 35 percent of the workforce; by 2015, it had
     dropped to 25 percent.
     Demand Rising for Occupations with More Knowledge, Thinking, and Flexibility
     Official projections predict strong growth in the so-called non-routine occupations.
     Growth in these occupations has more than made up for the loss in routine occupations.
     Technology will almost certainly transform many now routine occupations into positions
     requiring much more knowledge, thinking, and flexibility.
     Growing Occupations Will Not Necessarily Require a College Education However,
     this will most often require education and training beyond high school as well as a set of
     ―soft‖ skills not usually required for routine occupations. This will be a challenge
     especially for the adults who do not have a high school degree. Even well-educated and
     highly skilled employees will need continuous education, training, and retraining.
III. A Comprehensive Understanding of Changing Skills Needed A few score occupations
     have a clearly defined set of required skills. Most occupations have few clearly defined
     skills. The modern workplace requires an objective understanding of the talent
     requirements of all work throughout any given organization and local labor market - a
     complex and nuanced challenge.
IV. US Has Many Resources, No System More than one third of working adults currently
     take some kind of work-related education or training. However, we know little about the
     type or duration of the learning involved or its relation to employers‘ needs. Similarly,
     community colleges, universities, and federal programs lack focus on incumbent worker
     learning. Sharp higher education funding cuts during the recession have not helped.
V. An Active Workforce Policy Offers Opportunity for Long-Term Success Resolution of
     the skills problem will take careful planning and execution with input from employers,
     employees, educators, and policy makers of all types. All players will need to
     continuously coordinate and adjust policies, provide accessible schedules, develop
     objective certification credentials, tailor financial aid to working adult needs, and offer
     rigorous work-based learning.

                                               4
Part I - Meet the Workforce of the Future
In recent years, there has been much public fretting about the future of the American
workforce and its potential lack of appropriate skills. While fretting is not new, this
time it feels real and concrete.
The revolution in the global economy and the mad rush of technological innovation
seem to be getting ahead of us and threatening our very livelihoods, not to mention
the long-term prospects for the economy and the nation‘s
position in the world. In response, US leaders urgently                      84%
demand general education reforms - the institution of special Estimated portion of the
programs for education in the so-called STEM subjects people working today
(Science, Technology, Engineering, and Math), creation of who will still be working
new skills training programs for young people, free in 10 years
community college for everyone, expansion of pre-school
programs, etc.
That so much is made of educating our children and young people for the future
                            workforce is laudable and needs to continue. As
                            worthwhile as these efforts are, young people entering
          67%               the workforce each year amount to only a small part of
  Estimated share of people the existing workforce. Government analysts expect
  working today who will    that new entrants into the workforce to be two percent
  still be working in 20    or less a year through 2022. Concentrating on the young
  years                     alone would leave us without the skilled workforce
                            needed for decades to come.

                            The Crux of the Problem
  In the simplest terms, over the next 20 years or so, too many poorly prepared working
  adults will be chasing a declining number of low-skilled jobs, potentially holding back
  wages for those jobs.
  At the same time, employers will be unable to find enough qualified applicants for more
  skilled and intellectually demanding work, driving up wages for some and preventing
  American employers from expanding their operations in the US for lack of qualified
  workers. The fact that fewer young people are available to enter the workforce and more
  people (baby boomers) will be exiting exacerbates the situation.
  Even highly educated working adults will struggle to keep up with the changing
  workplace; they will have to keep learning just to keep up with technology and changing
  consumer demand. Matters will continue to get worse unless employers can adopt a
  system of lifelong workforce education and training.
                               Something will have to give.

                                            5
Still There, Till Then
If the US wants to prepare for the economy of the future, society will have to attend to
upgrading the skills of adults already working. To demonstrate the nature of the
situation, we know that at least 84 percent of those who will be working in 2025 are
already in the workforce according to an analysis of US Bureau of Labor Statistics
(BLS) projections.
Furthermore, it is likely that two-thirds of today‘s workers will still be working in 2035,
twenty years from now. Such slow replacement of experienced workers by new
entrants has always been the case. Most of us have never noticed. Now is a good time
to notice.
                                               Figure 1

Fig. 1 shows the steady growth of the US workforce over the decades. The dips are recession years, the
largest of which was the 2009-2011 Great Recession. Even then, the workforce resumed growing so that by
2014 the number of employed Americans exceeded pre-recession levels and continued the robust growth
thereafter. However, the mix of occupations included in the workforce has changed significantly over time.

                                                    6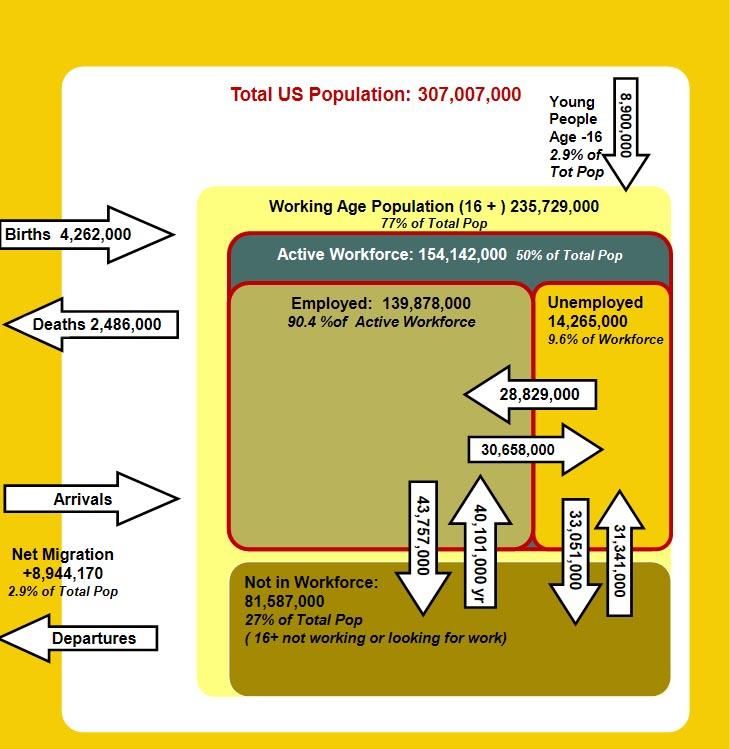
Part II - A Revolution in the Nature of Work
Given that most of the workforce for the near to medium term is already working; we
now turn to the impact of technological and economic changes that confront the
workforce and employers. In the larger scheme of things, not just the US, but the
entire world is in the midst of a global economic upheaval that affects every person on
the planet at light speed.
The triple whammy of the rush to new technology, the exponential expansion of
international trade and the worst recession since the Great Depression has left
ordinary working Americans wondering what will come next and how it will affect
their livelihoods. Even the economics journalists failed to see the jobs crisis coming in
their own profession.
Employees bring their skills, knowledge, interests, aptitudes, and habits to the job.
These, in varying degrees, are what employers value. Now it seems that demand for
these qualities has shifted so much and so fast that a large portion of the current
workforce may have little to offer employers in the near future.
Workplace Revolutions Past and Present
The current workplace revolution is the third in recent centuries. Each has built upon
the past and each has continued spreading into the next. Though often considered
―economic‖ or ―technological‖ revolutions, each has had a dramatic impact on the
work people do.
Dark Satanic Mills The first, the original Industrial Revolution, came with the advent
of the steam engine – steam driven factories, steamships, railroads – which engulfed
the world of the handmade, the fickle wind in the sails and the traveler‘s plodding
horse. Along with the telegraph, new transport shrank the world from months and
years to days and weeks.
Production from steam powered factories and mines grew exponentially sending
commodities and manufactured products across the globe in record quantities. The
creation of a sophisticated international banking system accompanied the revolution
in production.
Many occupations disappeared entirely while other often better paying livelihoods
eventually replaced them. In the meantime, it took 150 years and a great deal of
suffering, to sort out the balance of rights and responsibilities between capital and
labor in the new workplace.
Electrifying the World The second revolution, beginning in the 1880s gained full
effect by the mid-20th century. The harnessing of new forms of energy, primarily
petroleum and electricity, sparked the upheaval. The new technology brought
lighting for homes, offices and nightclubs, and power to drive factories and movie
projectors, radios and telephones; cheap petroleum derivatives opened the way for
automobiles, aircraft, and powerful diesel engines for railroads, mines, and farms.
As an example of the impact on the workforce, in the wake of massive mechanization
of agriculture, the share of farmers in the US workforce dropped from 40 percent in
1900 to less than one percent today. (The adoption of the mechanical cotton picker in

                                           7
the late 1940s alone sent hundreds of thousands off the farms of the South and into the
cities of the North.)
Other innovations simply replaced occupations entirely - dock workers by
containerization, telephone installers and operators by electronic switching, gangs of
ditch diggers with shovels by one woman with a backhoe, etc.
Productivity gains of the second revolution astounded those who lived through it;
second revolution innovations continue to provide ever-greater efficiencies. The
revolution blew away the world of the buggy whip, the manual clothes wringer, and
much of the muscle work requiring strong backs, endurance, and little else.
Still, there remained a great deal of routine manual work. By one estimate, routine
occupations made up as much as one-half of the workforce in 1950. Over time, new
jobs with better pay and working conditions replaced jobs in defunct occupations.
Apples and Apps Now, the third - the
digital - revolution surges across the           More Stuff - Fewer Jobs
globe creating unimaginably fast,
                                          The decline of manufacturing employment
clever and disruptive innovations.
                                          highlights    the   productivity   issue;
Like so many other social and             manufacturing now employs less than 10
economic disruptions, this one has        percent of the work force, down from 25
had a long gestation. Though              percent in 1990.
scientists and engineers invented the
                                          Of the remaining jobs, manufacturers report
computer in the 1940s, it didn‘t have
                                          that 80 percent are skilled or highly skilled.
much impact on the workplace until        Contrary to popular belief and our experience
the 1990s when the digital revolution     as shoppers, the US remains the second largest
seemed to hit everywhere at once          manufacturer in the world by value.
sweeping through every home,
                                          The value of US manufactured goods in real
factory, office, and shop. The            dollars soared from $800 billion in 1990 to
changes shrank occupations, melded        well over $2 trillion dollars in 2012. Only
tasks, and altered skill requirements     China, with four times the population, out-
in the blink of an eye.                   produces the US.
The ménage a trois of computers, the  There has been talk of “insourcing”
internet, and wireless technology has manufacturing       plants    from    overseas.
become the breeding ground for a      Unfortunately,  because   of productivity  gains,
seemingly     endless     stream   of not  many  jobs are  coming  with them. It looks
devices, digital apps, and software   as if manufacturing jobs have become rather
that continuously pour out their      like farm work. See Figure 2
largess of disruptive innovations at
breakneck speed. Very smart and dexterous machines have taken over routine tasks
once performed by automobile assemblers, drill press operators, and bookkeepers.
Personal computers, tablets, and smart phones have seamlessly melded with the
World Wide Web to devastate scores of occupations and industries. (Remember
paper?) The computer has allowed the integration of shipping, warehousing, air,
ground, and sea transportation thereby eliminating thousands of routine jobs and still
delivering the widescreen TV you bought online in time for the super bowl.
One has only to witness the spread of the smartphone to understand the
pervasiveness of the impact of the new technology. The smartphone burst on the

                                          8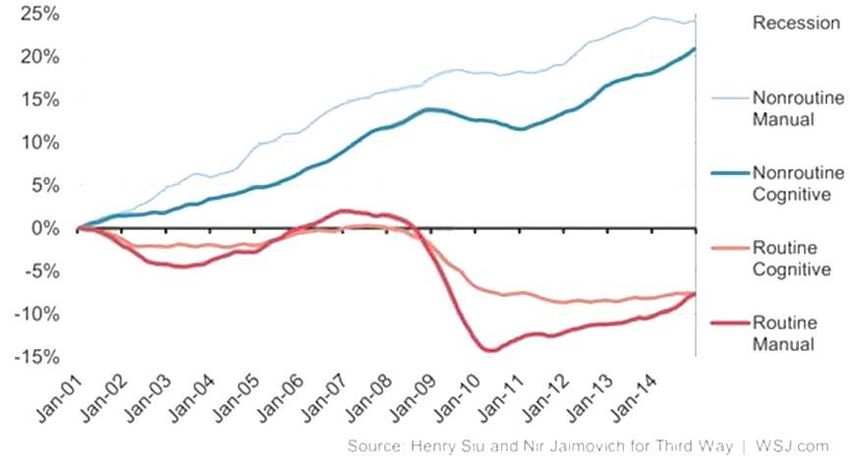
world in 2007. As of this writing in 2016, just nine years later, Americans pay for their
lattes, desperate Syrian refugees use GPS to make their way to safety, Congolese
rainforest farmers do their banking and buying without bank or store, and Indian
fishermen check prices in each port where they can sell their catch - all on
smartphones.
Like a thousand other innovations in the past few years, this single product has
profound workplace implications for many people, in many places - not to mention
the 700 million or so smartphone users in China helping to make the Chinese online
commerce site, Ali Baba, the world‘s largest company by some measures.
Behind the scenes, there is an equally robust stream of innovations in data
management and storage, digital automation of manufacturing, utilities, and
transportation, etc. Then come Apple, Google, Amazon, Uber, Facebook and their kin
proudly disrupting every home, shop, office, and vehicle.
One characteristic of this workplace revolution is that with digital technology routine
tasks have become much easier to ―rationalize‖ - that is, to break down work into
discrete steps from which engineers can then design ever more clever software for
new, more precise, and productive machines and processes.
International Trade
For many people, international trade is the great job-eating monster that looks ever
more likely to destroy the middle class and the American economy in general. It is
true that the dramatic shift in international trade patterns over the past 30-40 years has
disrupted many lives and businesses. The continuous movement of largely labor-
intensive industries from higher to lower wage areas has affected many jobs in
routine occupations while overall the workforce continued strong growth.
Economists often find it difficult to make the case that under free1 trade agreements
we are all better off. The fact that the many benefit while relatively few suffer is not
apparent to many people. Those who see only job losses – sometimes well-paying
middle class jobs - are vocal about the issue. The relatively few workers who lose
jobs, or think they may lose them, are far more active in opposing trade deals, and
often evoke more sympathy than the mass of consumers.
Despite this, free trade has made many consumer goods – from food to clothing -
much less expensive for millions of consumers than they would have been. This puts
more dollars in everyone‘s pockets; it helps to keep inflation low. The poor benefit
most as every dollar saved is a greater share of their income than for others and
becomes available for other necessities.
In addition, greater sales of US goods and services to treaty partners also ameliorate
the effect on US employment. In the early 1990s, alarmists raised the specter of free
trade having a massive negative effect on American jobs. Ross Perot, a 1992

1The inaptly named “free trade” agreements between countries only loosen up trade restrictions
not eliminate them. Free trade is when products move between Illinois and Wisconsin. The
agreement among the US states is one line in the US Constitution. The agreements are complex.
The relatively small Central American Free Trade Agreement is 500+ pages.

                                              9
presidential contender, predicted that we would hear a ―great sucking sound‖ of jobs
leaving for Mexico if the North American Free Trade Agreement (NAFTA) passed. It
passed and US jobs continued to grow. In fact, the 1990s saw the creation of more US
jobs than anytime in US history, including many from increased exports to Mexico.
The trade effect on jobs does not derive solely from trade agreements among nations.
Labor intensive textile manufacturing and the jobs that went with them, for instance,
were heavily concentrated in the US Northeast until the 1950s when the industry fled
to lower wage southern states, especially the Carolinas (amid great efforts in the
Northeast to prevent the moves) then to Mexico, and on to China and now to Vietnam
and Bangladesh.
Such labor-intensive – low-margin work is likely to continue to seek low wage havens
until people are willing to pay more for clothes or technology can improve
productivity enough to allow employers to pay better wages, or for governments to
enforce wage and hour laws - not that they necessarily will. 2
A recent study conducted for the Third Way organization found that: ―Of the 17 U.S.
trade agreements since 2000, the trade balance improved after implementation by an
average of $30.2 billion per year. Exports increased by 52 percent on an average
annual basis after implementation.‖ In other words, on balance, trade deals have
seemed to work out well for most Americans. 3
The Great Recession
In the 2009-2010 Great Recession, losses in routine occupations pushed
unemployment up while dragging overall employment and wages down. According
to Siu and Jaimovich, between 1990 and 2010 the number of jobs in routine
occupations lost 10 percentage points measured against the entire workforce - from
nearly 35 percent of all employment in 1990 to just above 25 percent in 2010.
In other words, nearly a third of 1990 routine jobs were gone by the end of 2010. (See
Figure 4.) The Great Recession had a particularly profound impact. The number of
routine occupational jobs fell by an estimated 6.1 million jobs from 2009-2010. As of
early 2016, these jobs seem lost forever. In the meantime, as indicated above
nonroutine jobs continued their steady growth.
In the past, routine jobs created in the recovery, replaced routine jobs following the
recession. Most new jobs required routine tasks. They may have involved different
tasks but still routine. This is no longer the case. Now, as old occupations fade, most
newly growing occupations involve nonroutine tasks requiring specialized
knowledge, skills, and behaviors. Instead of going from farm work to factory work,
less skilled working adults with routine jobs are now more likely to have to go from
assembly work to trained health care occupations.
2 Ironically, greater productivity may not be welcome when low-wage workers lose their jobs in
desperately poor places where the only alternative may be unemployment. Nor will the remaining workers
appreciate such changes if the benefits of increasing productivity go to executives and shareholders rather
than to the remaining workforce.
3 Chittooranmn, Jay, “What Opponents Have Wrong on Trade Deals,” Third Way, December 3, 2015
10Figure 2
Millions of Workers Output in
$Billions
Figure 2 illustrates that contrary to popular opinion America still manufactures a huge amount. Made in
America is alive and well, at least for the companies. Since 1990, the value of US manufactures has more
than doubled. Unfortunately, manufacturing employment has fallen off a cliff. More than one third of all
1990 manufacturing jobs were gone by 2011. The much-discussed return of manufacturing to the US –
sometimes-called “insourcing” -- has brought back plants but not as many new jobs as were outsourced.
Source: Mark J Perry, ―US Real Manufacturing Output Vs Employment,‖ American Enterprise Institute,
October 2015 from BLS data.
Workforce Transformation and Jobs Many fear the world‘s mindless rush toward
ever-greater technological innovation will leave working adults to pay the devil his
due in lost jobs and wages while others prosper. Is this necessarily so? Certainly,
great changes are afoot. How things look in retrospect is another question. It is
doubtful that individuals and institutions can do anything to avert a continual loss of
pay and jobs in occupations involving mostly routine tasks.
Economic transformations are painful. There is no question that many people lose
their jobs. Yet, past transformations have proved beneficial for most working people
in the end. Numerous new and often better paying jobs have always accompanied
economic transformations. It is happening today with the growth of tech jobs, new
kinds of health services, and a record number of entrepreneurs.
11It is doubtful that individuals and institutions can do anything to avert a continual loss
of pay and jobs in occupations involving mostly routine tasks. However, employers
and incumbent working people in combination with educational institutions and
trainers could build a system that allows working adults to continuously advance their
skills and knowledge to keep up with the workplace.
Figure 3
Figure 3 illustrates how the steady rise in productivity since 1980 has resulted in higher returns for
investors and a lack of growth in hourly compensation for wage earners. This tracks well with the breaking
of labor unions by corporations and anti-union policymakers. See also Figures 23 and 25 in the
Supplemental Charts section at the end of this paper.
12Disrupted Routines
The latest fundamental restructuring of the workplace has buffeted working people in
routine occupations over the past three recessions – 1991-1992, 2001-2002, and 2009-
2010. This stands in contrast to earlier post-war recessions when employment in most
such occupations moved quickly back to pre-recession levels. The 2009-2010
recession saw by far the worst losses in routine occupations. (See Figure 4.)
Some economists have called the aftermath of each of the past three recessions
―jobless recoveries.‖ In fact, the recoveries have not been jobless; the overall
number of jobs has shown healthy growth in succeeding years. (See Figure 1.)
Taking the recent great recession as an example, by January 2016 the overall size of
the working population reached a record high at 150 million working people up from
138 million in 2010 – a net increase of 12 million from the depth of the recession.
Furthermore, by 2016 the economy had added a net 3.5 million new jobs over the
previous high water mark in 2007 before the recession began.
Yet, it was a rocky recovery for millions of unemployed workers forced to change
occupations for lack of opportunities in their old fields. On average, they took much
longer than usual to find new work and too often circumstances forced them to take
lower pay due to the lack of skills needed for jobs more in demand.
The analysis of the effects of workplace change on occupations derives from the work
of economists David Autor, Henry Siu, Nir Jaimovich, and others. They have analyzed
the tasks required of occupational groups in the US Census list of occupations to try to
determine the dynamics of the new workforce. To do so, the researchers divided
occupations into four general categories.
The categories are quite broad and sometimes mix skill levels among the four groups.
While the data may lack detail, they prove useful in understanding the dynamics of
the labor market in recent decades. The occupational categories are:
Routine Manual Occupations (e.g. machine operators, assemblers, packers)
involve repetitive tasks that machines or computers could potentially do4. The
number of jobs in these occupations fell by nearly 10 percentage points in the
recession and most did not come back.
Routine Cognitive Occupations (e.g. bookkeepers, bank tellers, janitors, etc.)
involve more decision making and planning than strictly manual jobs. Nonetheless,
between 2000 and 2014 the number of jobs in these occupations fell nearly as fast as
routine manual jobs.
4 “Routine” and “unskilled” are not the same. Some jobs are skilled but routine. Any neophyte who has ever
harvested fruit alongside an experienced farmworker will recognize the difference. Listen to the song “John
Henry” for an example of skill against machine. Still, in many cases, the two are similar enough for
understanding the changes in the workplace.
13Figure 4
Routine Occupations Share of Working Age Population
Figure 4 shows the fate of routine occupations over nearly 50 years. It clearly demonstrates the dramatic
fall in the proportion of working age population in routine occupations especially in the latest recession.
Non-Routine Manual Occupations (e.g. skilled members of the construction trades,
pest control specialists, repairers, machinists, and maintainers of complex equipment,
and technicians of all types) require planning and decision-making, as well as manual
skills. Theses occupations don‘t face total automation in the near future. In fact,
between the years 2000 and 2014 growth in these jobs has far outpaced all others,
growing by about 25 percentage points. (See Figure 6.)
Non-Routine Cognitive Occupations (e.g. traditional professionals, academics,
executives, engineers, office professionals of all types, independent business owners,
etc.) usually require a college degree and sometimes-extensive postgraduate
preparation.
Nonroutine cognitive occupations require considerable knowledge of the field,
flexibility, and problem-solving skills. The skills required can change, sometimes
radically, over time, requiring more or less continuous skills upgrades. The Great
Recession barely touched working adults in these occupations and the occupations
resumed healthy growth more quickly than others did.
14Figure 5
Relative Growth of
Routine and Nonroutine Occupations
100,000 1982 and 1984
88,875
90,000
80,000
68,606
70,000 63,585
60,000
Millions of Workers
49,960
50,000
40,000
30,000
20,000
10,000
-
Routine Nonroutine
1982 63,585 49,960
2015 68,606 88,875
Figure 5 shows the growth of jobs in Routine and Nonroutine occupations over 33 years. These estimates
demonstrate that while the number of routine jobs grew slightly in that period, the much greater growth in
nonroutine jobs reduced the portion of working people with routine jobs.
Figure 6
Percent Change in Occupation Types 1982 – 2012
Figure 6 shows the relative changes in the share of routine and nonroutine occupations over the past three
decades. The acceleration of change shows itself most dramatically from 2002 through 2012. Note that the
fastest growth shows up in the non-routine manual category versus the non-routine cognitive fields (e.g.
Professional, managerial, engineering, etc.), which also showed healthy growth, Source: “Job Polarization
and Jobless Recoveries” Nir Jaimovich Duke University and National Bureau of Economic Research and
Henry Siu, University of British Columbia and NBER
15Decimation of the Routine In the middle decades of the 20th century, routine
occupations allowed hardworking, reliable, men and women without an advanced
education – blue-collar factory workers, telephone installers, receptionists – to lead
comfortable middle class lives. Now such occupations are slipping away. (For a more
detailed graph of the all categories, see Figure 26 at the back of this report.)
In addition to technology and trade, the dismantling of trade unions in the private
sector, especially in manufacturing, over the past 30 years has only accelerated the
loss of income and jobs in routine occupations. Without other skills, those routine
workers who lose jobs suffer in an economy that prizes higher skill levels will have a
difficult time maintaining their income and self-respect. (See Figure 2.)
Routine tasks are disappearing from the entire spectrum of work whether whole
occupations are threatened or not. Everyone from janitors to journalists and from
stockbrokers to steelworkers feel the impact of this new revolution. The skill
requirements of every occupation now change continuously, if sometimes as
imperceptively as the small hand on the clocks which used to hang on every wall. (So
much for the wall clock makers) However, occupations with the most routine tasks are
feeling the greatest impact.
A Long History of Concern Loss of jobs during workplace revolutions is not new.
Resistance to replacement of people by machines goes back to the English Luddites
smashing cotton-spinning machines in the early 19th century. Increasingly efficient
production equipment and methods have eliminated occupations ever since.
However, this time the change seems so much faster and more disruptive than in the
past. The challenges of keeping up seem much greater. This is not going from farm
worker to steel worker; it is going from hospital orderly to medical technician
requiring more education and a professional credential.
The question is not so much whether the jobs will be available but whether today‘s
workforce will be part of a system of lifelong learning as they proceed in their careers
or if they will end up by the wayside with great cost to workers, to their families, and
to the economy as a whole.
Many Jobs, Fewer Opportunities One point that often gets lost in any public
discussion of the shift in the makeup the workforce, is that while millions of routine
jobs are being lost, they still make up a very large part of the workforce, and many of
those jobs will not be going anywhere. In other words, the fastest growing
occupations are not those with the most jobs. (Figures 29 and 30 show the occupations
with the largest anticipated gains and losses.)
Figure 7 shows the number of employees in each of the ‗major‘ occupational clusters-
the highest level of aggregation - which disguises some skilled jobs but makes the
point. At least seven of the top 20 consist mainly of routine work. For example, routine
manufacturing production work remains the fourth largest major occupational group
despite the drastic decline in routine manufacturing employment.
Yet, many of the major occupational clusters offer fewer opportunities for the future.
The number of jobs in these routine occupations remains high as trade and
technology has affected them less. Nonetheless, they may experience lower wages
and less secure employment in the face of the larger supply of working age adults
with insufficient skills for nonroutine jobs.
16Figure 7
2015 Employment
by Major Occupational Groups
23,000,000
21,638,470
21,000,000
19,000,000
14,248,470
17,000,000
12,277,720
15,000,000
13,000,000
9,249,310
8,934,050
8,435,780
11,000,000
7,854,380
6,828,940
9,000,000
5,439,370
5,290,270
5,244,670
4,371,450
4,364,160
4,264,370
4,154,360
7,000,000
3,940,500
3,880,030
3,834,180
3,692,980
3,519,730
5,000,000
3,000,000
1,000,000
“Major Occupational Groups” is the highest level of aggregation of occupations designated by the BLS
Occupational Employment Statistics program. It subsumes all 1,000 or so detailed occupations. Figure 7
shows that many of the groups that rank high on the list include routine occupations. Though jobs in many
of these occupations continue to disappear, the numbers are still large enough that employers and
educators will have to address the training and retraining of these incumbent workers in order to develop
the more skilled workers they will need.
17Education and the New Workplace
“A college degree and a good job go hand in hand. Ninety seven percent of good jobs added in
the recovery from the Great Recession went to college graduates.” Tony Carnevale et al,
Georgetown Center for Education and the Workforce, November 20155
The quotation above is not particularly good news for the nearly 70 percent of
working adults who do not have a college degree - the 70 percent that employers will
have to work with over the near and medium term.
For the lack of more precise data on
routine occupations, researchers often Caveat:
use greater education as a proxy for
Education and Competence
greater skill, disregarding experience
and talent. For nonroutine occupations, employers often need a
complex cocktail of knowledge, experience, technical
We do this with some trepidation. (See and social skills, as well as the ability to learn and to
Box) Nonetheless, the workplace solve problems as they arise.
revolution has had significant benefits To find such people, by either recruitment or
for working adults with advanced promotion, employers often use education as an
education. informal proxy for these traits - education trumps
experience and training.
The US Census Bureau reports that
This practice can raise unnecessary barriers to
nearly 25 million US adults 25 years of advancement and deprives the employer of valuable
age and older who lack a high school human capital. This obviously has serious
diploma have dramatically fewer implications for upgrading skills and promotion of
opportunities in the labor market. They working adults without a college degree.
are much more likely to hold jobs in Some jobs genuinely require the knowledge and
routine occupations, run a higher risk of skills implied in a college degree. However, there has
unemployment and receive lower been a drift toward academic inflation in recent
decades. This precludes otherwise qualified high
wages (Figures 9 and 10 show the price school graduates from many jobs.
of not having a high school diploma.).
Competency driven credentials based on objective
During the Great Recession, the assessment, on the other hand, can offer greater
unemployment rate for adult high school value (if not used trivially). Information technology,
dropouts peaked at an unprecedented health care, and construction have shown the way in
this regard. Employers here tend to value
level of 14.7 percent. Those without a demonstrable competence over formal education
high school degree are likely to receive alone.
25 percent less pay than high school
It is worth remembering that up through the 1940s
graduates. The inverse is true of those most Americans did not have a high school diploma.
with more education, especially college (See Figure 15) A high school diploma was
graduates. The best opportunity for considered adequate for most occupations including
those with a ―routine‖ work history lies U.S. President. Like 95% of his fellow Americans,
Harry Truman managed without a college degree. In
with completing high school, if they
the 19th century, many prominent Americans were
haven‘t already done so, and getting at largely self-taught. After all, Abraham Lincoln, Henry
least some post-secondary education, Ford, and Thomas Edison never went past 3rd grade.
training or occupational certification; a
5By “good jobs” the authors mean – ones that pay at least $53,000 annually, usually with benefits compared to
the national median of roughly $47,000 often without benefits.
18university degree could help a lot more. This is an ideal situation where employers
can intervene to assist poorly educated employees and raise their potential
productivity.
Figure 8
Figure 8 clearly demonstrates the effect of education on income and employment. In 2014 a person with a
college degree was likely to earn more than twice as much as one without a high school degree and face
less than half the chance on being unemployed.
19Figure 9
Unemployment by Education
Experienced Workers Aged 25+
16.0
14.0
12.0
Unemployment Rate
10.0
8.0
6.0
4.0
2.0
0.0
2004
2005
2006
2007
1992
1993
1994
1995
1996
1997
1998
1999
2000
2001
2002
2003
2008
2009
2010
2011
2012
2013
2014
Less than HS HS Some college or AA College+ Total
Figure 9 shows the impact of educational attainment on unemployment. While college graduates have
unemployment rates well below the national average, those with less than high school education suffer the
pains of unemployment far higher than the national average.
20Figure 10
The Restructuring of the Industrial Landscape
US Employment by Industry
Figure 10 not only shows the relative decline of manufacturing with its multitude of routine jobs but a
compensating rise in service sector jobs. These are more than retail clerks and laundry workers as
traditionally portrayed by economists. Service occupations encompass a huge variety of occupations from
CEOs and physicists to kitchen helpers and house cleaners in a multitude of industries. They are
essentially every job outside of a factory, farm, or mine.
Mining employment, important as the industry is, does not show on the chart for lack of employees.
Agricultural employment has nearly disappeared from the chart. In 1900, 41 percent of Americans worked
on farms, most as owners. It turns out you really can’t keep them down on the farm. Government
employment has actually declined as a share of total employment in recent decades despite emotional
assertions to the contrary.
21Working Adults: Dropping Out or Hanging in There
The overall US labor force participation rate (the percent of the population 16 and
over working or looking for work) has fallen steadily since 1997. The participation
rate in early 2016 stood at 62.9 percent compared to a high of 67.1 in 1997 according
to the Bureau of Labor Statistics.
Commentators usually present this decline as a bad thing. The implication is that
working adults have dropped out of the workforce because they are too discouraged
to look for work. The unspoken assumption is that middle aged and older adults laid
off from routine occupations are discouraged make up the bulk of those dropping out.
This does not hold up to careful scrutiny. Before attending to the causes of the decline,
let us look at the data on discouraged workers - those who are not working or looking
for work because they don‘t think work is available for them. The US Bureau of Labor
Statistics (BLS) defines such people as ―discouraged workers‖ and ―out of the labor
force.‖
BLS tracks discouraged workers closely. It reports that in December 2015 the number
stood at 663,000 or only 0.4percent of the 150,000,000 employed people in the
workforce. The number of discouraged workers has actually fallen sharply recently,
not risen. The number peaked at 1.3 million in 2010 meaning that nearly half of the
previously discouraged workers joined those working or looking for work since then.
The argument that middle aged and older adults might have something to do with the
decline does not hold either. In fact, the participation bright spot has been the steady
participation of middle aged and older adults 45-65 years of age (AKA baby boomers)
falling from an unusually high of 83 percent in the early 2000s to 80 percent in 2015. In
fact, the participation rate for those 60-65 years old rose steadily from 1997 to 2015
going from 47 percent in 1997 to 55 percent in 2015 – an eight- point jump.
The retiree portion may grow in the next 20 years, as the bulk of baby boom
generation leaves the workforce. This depends on how long the healthier, longer-
lived generation wants to keep on working. In any event, Boomer withdrawal from the
labor force does not explain why participation rates have fallen since 1997.
A closer look at the age-related participation data also helps explain the bulk of the
decline in participation. The BLS workforce participation data by age shows by far the
largest drop in participation since the high in 1997 is among 18-19 year-olds. The
National Center for Education Statistics (NCES) school enrollment data shows a major
rise in young people staying in high school and enrolling in college in ever-greater
numbers over the past 20 years. (Again, students not working or looking for work do
not count as workforce participants.) Thus, an increase in school attendance in this
group lowers the participation rate.
Figure 11 shows that 18-19 year-olds (green line) experienced by far the greatest
decline in workforce participation in the past 30 some years. Young people aged 20-
24 also show a significant decline although not as steep. Figure12 shows that the labor
force participation drop among young people coincides with students staying out of
the workforce to continue their education. The chart does not include the increased
22number of 20-24 year old students in school. If it did, the rise in school attendance
would be greater.
We do know that the dropout rate for those between 16 and 24 years of age has fallen
by more than half since 1970. That is, 15 percent or 4.5 million dropouts to less than
seven percent or 2.5 million dropouts in 2013. Falling high school dropout rates and
rising college attendance appear to explain most of the decline in overall
participation. Thus, students are the main, but not the only; factor in declining overall
workforce participation.
Though students may be working or looking for work, many fewer have been doing
so. Between 2000 and 2014, the number of working students fell from more than 50
percent to less than 40 percent (NCES). While adult workers add a small amount to
the decline in labor force participation, they are not a major concern while the
increasing schooling of young people seems a good thing.
The New Workplace
And
Income Inequality
Is there a connection between loss of routine jobs and the widening gap
between in- comes of the rich and everyone else? Does the loss of jobs in these
occupations drag down the wages and household income? Affirmative answers
to these questions seem quite plausible though hard to document.
It is certainly true that that in addition to record unemployment, median
household in- come dropped during the Great Recession and as of late 2015
had not recovered. Individual wages recorded similar drops and the wage
losses between 2009 and 2015 hit lowest paid wage earners hardest. (See
Figures 23 and 25.)
Both of these indicators are consistent with the fall in the number of jobs in
routine occupations. As these jobs disappear, the supply of lower skilled
workers per job grows so there is little workforce supply pressure on
employers to raise wages.
Conversely, the high wages and low unemployment rate of college graduates
would seem to indicate relative shortages of such workers. Higher skills and
credentials for working adults now in routine occupations could raise their
wages and potentially relieve shortages in nonroutine fields. Could be.
23Figure 11
Labor Force Particpation Rates
National Rate 20-24 18-19 25-54 55-64
90
85
Workforce Particpation Rates
80
75
70
65
60
55
50
45
Source BLS
Figure 11 illustrates the differing participation rates by age over time. The most pronounced drop is
among those aged 18-19 and 20-24. While the fall of the rates for those over 25 are markedly smaller.Figure 12
School Enrollment Goes Up
Participation in Workforce Goes Down
Participation 18-19 Enrollment after HS
75.0
70.0
Percent of Population
65.0
60.0
55.0
50.0
45.0
Participation - 18-19 year olds - Source: BLS
College Enrollment - Semester After Graduation - Source: NCES
Falling HS dropout rates and rising college attendance appear to explain most of the decline in overall
participation. Figure12 shows that the decline in youth labor force participation rates matches a
corresponding rise in school attendance. The education line would rise more if the decline in the number
of high school dropouts – 4.5 million in 1970 down to 2.5 million in 2013 of those 16-24 –and college
students aged 20-24 could be included. However, the two sets of data use different age breakouts.
25Part III - Skills
A Qualified Workforce
The whole point of upskilling and reskilling – terms we hear a lot these days – in
addition to improving job prospects for adult workers - is to improve the productivity
and effectiveness of business operations. An unqualified or marginally competent
workforce is a dead weight on company profits and employees‘ pay.6
A highly qualified workforce increases the company‘s productivity, flexibility, and
profits. Learning is the essential ingredient for a continuously transforming
workplace, where brains are more important than brawn and employers require a
smart, flexible workforce with well-honed skills.
However, employers often fail to take into account the loss of efficiency and
productivity that results from a lack of training and continuing education. Employers
generally believe that schools should provide the needed education and employer
sponsored training should be limited to the very specific needs of the company
(company policies, orientation to new equipment, management training, etc.). Since
most occupations do not have mandatory continuing education requirements, adult
workers have to adjust their skills catch as catch can.
A 2015 Manpower Group Talent Shortages survey found only 28 percent of companies
were providing additional education or training current workers to meet their talent
shortages. Another 36 percent appoint workers to positions for which they lacked
appropriate skills apparently with the fond hope that the workers would learn the job
along the way.
Furthermore, employers usually leave the task of initial training to the informal
ministrations of the HR Department, supervisors, and colleagues. By using this
informal and inconsistent approach, employers deprive employees of much useful
information and valuable foundation skills. If workers want to advance in their
careers, it is usually up to them to get outside education (e.g. master‘s degree,
community college courses, etc.).
Why Trained Employees Stay
“If I train them, they will leave.‖ This common assertion does not hold up to careful
examination. ―It sounds like the people who say that only want people that no one
else wants – the least competent workers. Not such a good business plan when you
think about it. I prefer to have the best employees in the business,‖ a Hammond,
Indiana steel company director responded when asked about it.
Research backs up the steelmaker‘s argument. Scott Brum of the University of Rhode
Island conducted a review of the available academic research on training and its
effect on the employers and employees.
6This applies, as well, to government agencies and nonprofits trying to operate efficiently and effectively
meeting their mandate.
26Brun found that:
―. . . Organizations that train their employees consistently have better outcomes
than those that do not. When business environments change abruptly, it is
typically, the companies with the best-trained employees that adapt and adjust
most efficiently…Research (has) affirmed that training encourages ―spontaneous
cooperation‖ in many large companies. Even in fast moving and ever-evolving
industries, the cooperation achieved through training could lessen the need for
complicated company policies.
Organizational training can offer these employees an opportunity they may have
not been able to achieve elsewhere. The result is a more committed employee
that has a greater desire to remain (at his current job). . . From an employee
perspective, general training7 was found to be more valuable to employees than
(company) specific.
Since a great deal of research indicates that general and specific training are
many times enmeshed and intertwined in each other, it may best serve
organizations to promote and encourage participation in general training
programs.‖
Perhaps counterintuitively, the more the organization provides employees with
portable and valuable skills, the more loyal they will be to that organization.
The literature emphasizes five other points. The highly qualified worker model
succeeds best when it:
Is an integral part of an employer‘s business model;
Provides continuous learning opportunities, sometimes formal, sometimes
informal;
Takes into account that all employees have at least some valuable skills that can be
supplemented rather than ignored;
Includes general as well as specific education, especially where the employee can
qualify for an academic, occupational, or a formal alternative credential (license,
certification, etc.);
Includes all employees from frontline workers to executives.
Frontline Workers
It is our experience that frontline workers bring far more value to organizations than
most employers understand or are willing to admit. These employees have the first
(and often continuing) direct contact with customers and client both external and
internal.
Frontline workers provide the ―moment of truth‖ – when an organization has the first
direct contact with the customer or client - for the entire firm or organization. Most of
us judge a company not by how hard the executives work and how smart the people
in the back office may be, but by the service received from the frontline workers.
7 “General” training provides portable skills and credentials - certifications, licenses, degrees, etc.
27For the customer, an airline is the person behind the ticket counter, not the CEO,
mechanics, or pilots. If the sales person is polite and helpful on first contact, the
company is great. If the product is always what we ordered because the frontline
workers in the factory or shipping office did things right the first time, we will have a
good feeling about the firm. Of course, everyone makes mistakes, but if a company
frontline worker can fix the problem politely, contritely and efficiently, we will let the
mistake pass.
On the other hand, if the service is rude, if the product is late and inoperable, or the
employee can‘t fix our problem promptly, our opinion of the organization goes down
the tubes. Computers with fancy software can help avoid errors but they can‘t replace
competent helpful human contact.
Other frontline employees – administrative assistants, IT help desk workers, etc. -
serve internal customers. The quality of their interactions within the company can be
critical to the organization‘s smooth functioning. Frontline workers‘ skills are not
trivial even though the employees may not be paid as much as others.
A second imperative for educating frontline workers is that with fewer employees in
routine operations, and fewer skilled workers available from the outside, employers
now ask more of people on the frontline. Such employees need to know more about
the company, its products, and services. They need to be able to solve customer
problems, service equipment, and interact smoothly with the people around them.
In many organizations, the employer now expects employees who until recently held
routine jobs to broaden their skills, often quite quickly. Employers don‘t often give
much thought to this profound transformation in the workplace and consequently
provide little systematic training in the new skills required.
With the continuous education and training of frontline workers along with everyone
else, an organization can greatly improve its reputation, the quality of its products and
services, and overall effectiveness. Yet, according to a 2015 White House upskilling
report, frontline workers are least likely to receive employer-provided training. At
the same time, access for public training programs for less-educated adult workers
has steadily declined in recent years.
Today, one third of all adult workers have a bachelor‘s degree or higher. Employers
pay them considerably more than those with less education do and they have
dramatically lower unemployment rates. Workers in the skilled trades are similarly
blessed. Nonetheless, frontline college graduates and skilled workers are just as
likely to lack necessary skills as other working adults are.
Some occupations (teachers, nurses, physicians) have at least nominal continuing
education built into their licensure or contracts. Employees in other occupations have
little in the way of information as to how they can be most effective in their work and
keep their skills up-to-date. Finding what skills employees lack and how to provide
the education and training takes some work.
28You can also read