Workforce Projections to Support Battery Electric Vehicle Charging Infrastructure Installation
←
→
Page content transcription
If your browser does not render page correctly, please read the page content below
Expertise for a Shared Future®

Workforce Projections to Support Battery Electric Vehicle
 Charging Infrastructure Installation

Prepared for:

Eileen Wenger Tutt, Executive Director
Electric Transportation Community Development Corporation
1015 K Street, Suite 200
Sacramento, CA 95814

Prepared by:

Edward W. Carr, Ph.D.
James J. Winebrake, Ph.D.
Samuel G. Winebrake

Energy and Environmental Research Associates, LLC
5409 Edisto Drive
Wilmington, NC 28403
Ph: (585) 317-4465 / E: ecarr@energyandenvironmental.com

Final Report

June 8, 2021

Table of Contents
Table of Contents ............................................................................................................................................... 2
Table of Figures .................................................................................................................................................. 5
Table of Tables.................................................................................................................................................... 6
Acronyms and Abbreviations ........................................................................................................................... 7
Executive Summary ............................................................................................................................................ 9
1 Purpose and Introduction ......................................................................................................................10
2 Electric Vehicle Charging Infrastructure .............................................................................................11
 2.1 Electric Vehicle Charging Stations ..............................................................................................12
 2.2 Light, Medium, and Heavy Duty Electric Vehicles...................................................................14
 2.3 Technical Aspects of Charging Infrastructure ...........................................................................16
 2.3.1 Level 1..........................................................................................................................................16
 2.3.2 Level 2..........................................................................................................................................16
 2.3.3 DC Fast Charging ......................................................................................................................16
 2.3.4 Medium and Heavy-Duty Charging ........................................................................................17
 2.4 Grid Integration and Hardening ..................................................................................................17
 2.4.1 Grid Integration and Hardening: Challenges ........................................................................18
 2.4.2 Grid Integration and Hardening: Benefits .............................................................................18
3 Workforce Needs.....................................................................................................................................18
 3.1 Knowledge and Skills Training .....................................................................................................21
 3.2 Sales and Marketing Job Roles .....................................................................................................21
 3.3 Planning and Permitting Job Roles ..............................................................................................21
 3.4 Construction and Installation Job Roles .....................................................................................22
 3.5 Operations and Maintenance Job Roles .....................................................................................23
 3.6 Job Quality .......................................................................................................................................23
 3.7 Charging Infrastructure Workforce Wages ................................................................................23
 3.8 Current Employment Estimates ..................................................................................................24
4 Policies and Incentives ............................................................................................................................25
 4.1 California Policies Related to Battery Electric Vehicle Charging Infrastructure ..................25
 4.2 Financial Incentives, Credits, and Instruments Promoting Charging Infrastructure...........26
5 Issues Related to Battery Electric Vehicle Infrastructure and Equity .............................................26
 5.1 Affordability and Awareness ........................................................................................................26
 5.2 Education and Occupation ...........................................................................................................27
 5.3 EV Infrastructure and Electrification Funding in Priority Communities .............................28
 5.3.1 Efforts to Address Equity in California .................................................................................29

 Page 2 of 70
5.3.2 Policies Affecting Priority Communities Nationwide ..........................................................29
6 Electric Vehicle Infrastructure Workforce Estimation Analysis ......................................................29
 6.1 Survey Results Summary ...............................................................................................................29
 6.1.1 Organization Type .....................................................................................................................30
 6.1.2 Experience ..................................................................................................................................30
 6.1.3 Charging Station Installations ..................................................................................................31
 6.2 Level 2 Charging Stations..............................................................................................................32
 6.2.1 Characteristics of Typical Level 2 Charging Stations Installed by Respondents .............32
 6.2.2 Workforce Estimation: Level 2................................................................................................33
 6.2.3 Level 2: Planning and Design...................................................................................................34
 6.2.4 Level 2: General Contracting ...................................................................................................35
 6.2.5 Level 2: Electrical Contracting .................................................................................................35
 6.2.6 Level 2: Electricians ...................................................................................................................36
 6.2.7 Level 2: Administration.............................................................................................................38
 6.2.8 Level 2: Legal, Other, and Utility Linework ..........................................................................39
 6.3 DC Fast Charging Stations............................................................................................................39
 6.3.1 Characteristics of Typical DC Fast Charging Stations Installed by Respondents ...........40
 6.3.2 Workforce Estimation: DC Fast Charging ............................................................................41
 6.3.3 DC Fast: Planning and Design ................................................................................................41
 6.3.4 DC Fast: General Contracting .................................................................................................42
 6.3.5 DC Fast: Electrical Contracting...............................................................................................43
 6.3.6 DC Fast: Electricians .................................................................................................................44
 6.3.7 DC Fast: Administration...........................................................................................................45
 6.3.8 Level 2: Legal, Other, and Utility Linework ..........................................................................45
 6.4 Workforce Estimation Summary .................................................................................................45
 6.5 Workforce Projections ...................................................................................................................46
 6.5.1 NREL National Demand for Electric Vehicle Charging Infrastructure ...........................47
 6.5.2 Biden Administration Federal Electric Vehicle Charger Goal............................................48
 6.5.3 California Electric Vehicle Infrastructure Projections .........................................................48
 6.5.4 California: Medium and Heavy-Duty Infrastructure ............................................................51
 6.6 Survey Responses: Challenges and Policies Affecting Equity Communities ........................52
7 Social Impact Assessment ......................................................................................................................54
 7.1 Recommended Steps for Robust Social Impact Analysis ........................................................55
8 Conclusions ..............................................................................................................................................56
References ..........................................................................................................................................................58

 Page 3 of 70

Appendix A: California Policies Related to Battery Electric Vehicle Charging Infrastructure ............61
Appendix B: Federal Policies to Promote Charging Infrastructure ..........................................................62
Appendix C: State Policies to Promote Charging Infrastructure ..............................................................63
Appendix D: Policies Addressing Equity in California...............................................................................65
Appendix E: Policies Addressing Equity Nationwide ................................................................................69
Appendix F: Survey Questions .......................................................................................................................70

 Page 4 of 70

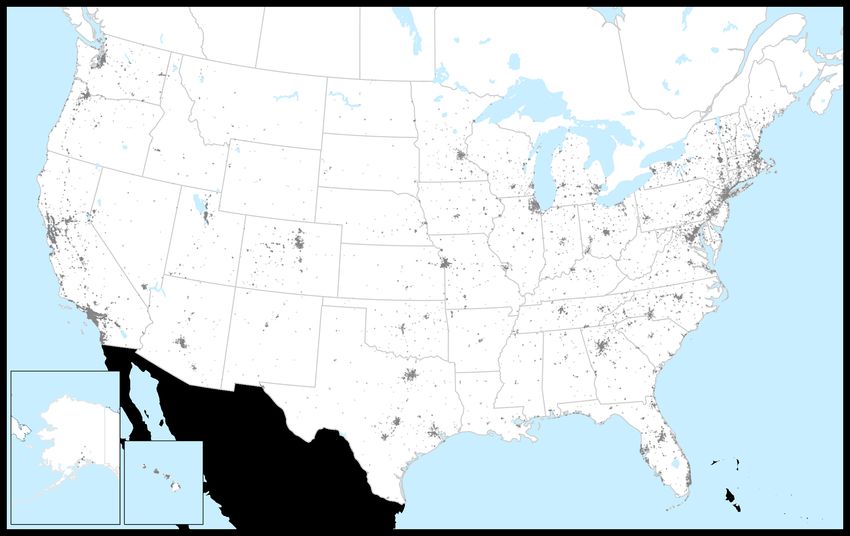
Table of Figures
Figure 1: Map of AFDC station locations in the United States. Each grey dot represents a charging
station. ................................................................................................................................................................12
Figure 2: Number of public electric vehicle stations (left) and chargers (right) by state as of May
2020 (Source: AFDC).......................................................................................................................................13
Figure 3: Projected growth in light-duty electric vehicles sales (EIA, 2020) ...........................................15
Figure 4: Vehicle types by classification ........................................................................................................15
Figure 5: Percent of employment in NAICS sector 238210 by occupation ............................................20
Figure 6: Amount of charging stations vs. high school graduation rate by census tract in California.
 .............................................................................................................................................................................28
Figure 7: Charging stations vs. unemployment rates by census tract (left) and charging stations vs.
employment rates within the construction sector by census tract in California (right). ........................29
Figure 8: Percent of survey respondents by organization type ..................................................................30
Figure 9: Direct experience of respondents with relation to planning, contracting, managing, or
installing EV infrastructure. ............................................................................................................................31
Figure 10: Experience levels of respondents with regards to various charging infrastructure aspects.
 .............................................................................................................................................................................31
Figure 11: Level 2, DC Fast, and combination DC Fast/Level 2 charging station installations by
survey respondents in the past three years(y-axis scales are consistent). .................................................32
Figure 12: Frequencies of typical number of Level 2 chargers per station installed by respondents. .32
Figure 13: Frequencies of locations of typical Level 2 station installations of respondents. ................33
Figure 14: Planning effort in person-days vs. the number of Level 2 chargers of a typical Level 2
station. ................................................................................................................................................................34
Figure 15: Electrical contracting effort in person-days vs. the number of Level 2 chargers in a typical
Level 2 charging station. ..................................................................................................................................36
Figure 16: Electrician effort in person-days vs. the number of Level 2 chargers of a typical Level 2
station. ................................................................................................................................................................37
Figure 17: Admin effort in person-days vs. the number of Level 2 chargers of a typical Level 2
station. ................................................................................................................................................................39
Figure 18: Frequencies of typical number of DC Fast chargers per station installed by respondents.
 .............................................................................................................................................................................40
Figure 19: Frequencies of locations of typical DC Fast station installations of respondents. ..............40
Figure 20: Planning effort in person-days vs. the number of DC Fast chargers of a typical DC Fast
station. ................................................................................................................................................................42
Figure 21: Electrical contracting effort in person-days vs. the number of DC Fast chargers in a
typical DC Fast charging station. ...................................................................................................................43
Figure 22: Electrician effort in person-days vs. the number of DC Fast chargers of a typical DC Fast
station. ................................................................................................................................................................44
Figure 23: Frequencies of respondents experiencing various restrictions and challenges during
charger installations. .........................................................................................................................................53
Figure 24: Frequencies of the biggest challenge/restriction faced during charger installations of
respondents. .......................................................................................................................................................53

 Page 5 of 70

Table of Tables
Table 1: EV ecosystem job sectors identified by LAEDC .........................................................................19
Table 2: National average median wage across states for selected occupations under NAICS sector
238210 ................................................................................................................................................................24
Table 3: Regression model of planning effort in person-days vs. the number of Level 2 chargers in a
typical Level 2 station. ......................................................................................................................................35
Table 4: Regression model of electrical contracting effort in person-days vs. the number of Level 2
chargers in a typical Level 2 charging station. ..............................................................................................36
Table 5: Regression model of electrician effort in person-days vs. the number of Level 2 chargers in
a typical Level 2 station. ...................................................................................................................................38
Table 6: Regression model of admin effort in person-days vs. the number of Level 2 chargers in a
typical Level 2 station. ......................................................................................................................................39
Table 7: Regression model of planning effort in person-days vs. the number of DC Fast chargers in
a typical DC Fast station. .................................................................................................................................42
Table 8: Regression model of Electrical contracting effort in person-days vs. the number of DC Fast
chargers in a typical DC Fast charging station. ............................................................................................44
Table 9: Regression model of electrician effort in person-days vs. the number of DC Fast chargers in
a typical DC Fast station. .................................................................................................................................45
Table 10: Estimated effort by job-role in person-days for Level 2 and DC Fast charger installation (2
d.p.). ....................................................................................................................................................................46
Table 11: Workforce estimates in job-years in order to meet 2030 charger demand estimated by
NREL. ................................................................................................................................................................47
Table 12: Workforce estimates in job-years in order to build 500,000 public DC Fast chargers from
2021 to 2030. .....................................................................................................................................................48
Table 13: Scenarios regarding projected vehicle uptake charger needs for 2030. Excerpted from
Table 6 (Crisostomo et al. 2021) ....................................................................................................................50
Table 14: Baseline scenario workforce estimates to meet light-duty electric vehicle infrastructure
demand in California from 2021 to 2030. .....................................................................................................51
Table 15: High scenario workforce estimates to meet light-duty electric vehicle infrastructure
demand in California from 2021 to 2030. .....................................................................................................51
Table 16: Workforce estimates to meet demand for buildout of medium- and heavy-duty electric
vehicle charging infrastructure in California from 2021 to 2030. .............................................................52

 Page 6 of 70
Acronyms and Abbreviations
Acronym Abbreviation
AC Alternating current
ADA Americans with Disabilities Act
AFDC Alternative Fuels Data Center
AFV Alternative Fuel Vehicle
BEV Battery electric vehicle
BLS Bureau of Labor Statistics
CalEPA California Environmental Protection Agency
CALeVIP California Electric Vehicle Infrastructure Project
CARB California Air Resources Board
CEC California Energy Commission
CO2 Carbon dioxide, also CO2e, carbon dioxide equivalent
CPUC California Public Utilities Commission
CRS Congressional Research Service
CVRP California Clean Vehicle Rebate Project
DAC Disadvantaged community
DC Direct current
DUNS Data Universal Numbering System
EACH Electric Access Charging Hub
ECS Electronic Charging Station
EV Electric Vehicle
EVITP Electric Vehicle Infrastructure Training Program
EVSE Electric Vehicle Supply Equipment
FCEV Fuel cell electric vehicle
FHWA Federal Highway Administration
GHG Greenhouse gas
GVWR Gross vehicular weight rating. Sometimes just GVW
HDV Heavy-Duty Vehicle
IOU Investor-owned utility
LAEDC Los Angeles Economic Development Corporation
LDV Light-Duty Vehicle
MDV Medium-Duty Vehicle
MPGe Miles per gallon equivalent
MUD Multi-unit dwelling
NAICS North American Industry Classification System
NAICS North American Industry Classification System
NEC National Electric Code
NFPA National Fire Protection Association
NOx Nitrogen oxides
NREL National Renewable Energy Laboratory
NRG NRG Energy, Inc

 Page 7 of 70
NVE Nevada Energy
O&M Operations and maintenance
OCVRP Oregon Clean Vehicle Rebate Program
OES Occupational Employment Statistics and Wages
PEV Plug-in Electric Vehicle
PEV Plug-in electric vehicles
PG&E Pacific Gas & Electric
PHEV Plug-in Hybrid Electric Vehicle
PM2.5 Particulate matter 2.5μm or smaller
RMI Rocky Mountain Institute
SB Senate Bill
SCE Southern California Edison
SDG&E San Diego Gas & Electric
SO2 Sulfur dioxide
USAID U.S. Agency for International Development
USEER U.S. Energy and Employment Report

 Page 8 of 70
Workforce Projections to Support Battery Electric Vehicle
 Charging Infrastructure Installation
Executive Summary
This report assesses the workforce needs associated with light-duty and medium/heavy-duty battery
electric vehicle charging infrastructure build-out and identifies equitable pathways towards “high
road” jobs for priority communities within the electric vehicle charging infrastructure landscape.
This work provides policymakers and interested stakeholders with an overview of the electric vehicle
landscape, discussion of the current state of the workforce, survey-derived bottom-up estimates of
workforce needs to support infrastructure buildout, and perspectives on potential pathways to
address issues of equity in the burgeoning electric vehicle infrastructure workforce.

Workforce estimates, derived from bottom-up survey elicitation from industry professionals show
that California’s statewide light-duty electric vehicle program goals, and the associated charging
infrastructure would generate workforce needs of ~38,200 to 62,400 job-years over the period from
2021 to 2031 in California, based on the baseline and high electric vehicle adoption scenarios. The
greatest workforce needs for light-duty infrastructure would be for electricians (21.3% of job-years),
general contractors (21% of job-years), planning and design (20% of job-years), and electrical
contractors (15% of job-years). From estimates of projected medium and heavy-duty electric vehicle
growth, this work estimates that the associated charging infrastructure in California would generate
~9,100 additional job-years from 2021 - 2030, in addition to the light-duty charging infrastructure
workforce needs. Nationwide buildout of 500,000 electric vehicle DC Fast chargers by 2030,
announced in 2021 under the Biden administration’s infrastructure goals, would generate workforce
needs of around 28,950 job-years from 2021 to 2030.

The skills and knowledge gained from charger installation share many common similarities with
other job sectors, meaning trained and skilled workers may find additional opportunities for career
advancement in other sectors of the economy. With deliberate policies that include job quality, state-
certified electrical apprenticeship and equity requirements, coupled with robust and engaged social
impact analysis, widespread electric vehicle infrastructure development and the associated creation
of high quality jobs can offer a pipeline for those in priority communities toward skilled, well-paying,
upwardly mobile jobs and careers.

 Page 9 of 70
Workforce Projections to Support Battery Electric Vehicle
 Charging Infrastructure Installation
1 Purpose and Introduction
This report assesses the workforce needs associated with light-duty and medium/heavy duty battery
electric vehicle charging infrastructure build-out and identifies equitable pathways towards “high
road” jobs for priority communities within the electric vehicle charging infrastructure landscape.
This work provides policymakers and interested stakeholders with an overview of the electric vehicle
landscape, discussion of the current state of the workforce, survey-derived bottom-up estimates of
workforce needs to support infrastructure buildout, and perspectives on potential pathways to
address issues of equity in the burgeoning electric vehicle infrastructure workforce.

Transportation tailpipe emissions make up 28% of total CO2e emissions in the United States (41%
in California), and highway vehicles contribute significant emissions of particulate matter (PM),
sulfur dioxide (SO2), and oxides of nitrogen (NOx), all of which contribute to poor air quality,
increased incidence of human health issues (including lung cancer, cardiovascular disease and
asthma), and environmental degradation. Decarbonizing the transportation sector promises large
climate and environmental health benefits and electrification is seen as one of the primary pathways
toward low- and zero- emission transportation fleets. Battery electric vehicles (BEV) reduce tailpipe
emissions down to zero, and when coupled with a clean renewable electricity grid BEVs can
significantly reduce total emissions of greenhouse gases and other pollutants.

Electric vehicles are highly efficient. Recently produced light-duty vehicle (LDV) BEVs available in
the U.S. have a median fuel consumption of ~110 miles per gallon gasoline equivalent (MPGe), and
a median all-electric range of ~240 miles1. Given efficiency of electric vehicles, lower fuel costs, and
lower overall maintenance costs, the overall cost savings of electric vehicle ownership can be
significant compared to non-electric vehicles.

There are a number of challenges facing widespread adoption of electric vehicles. Arguably two of
the most significant challenges are range and associated charging anxiety (Rauh, Franke, and Krems
2015), which are governed by drivers’ concerns over the ready availability of electric vehicle charging
infrastructure and charging cycle durations. Due to network effects, electric vehicle ownership and
access to reliable charging infrastructure go hand in hand as complementary goods (Green et al.,
2014; Skerlos and Winebrake, 2010; Meyer and Winebrake, 2009; Winebrake and Farrell, 1997).
Increased availability of public and workplace charging stations can increase trip lengths and
decrease range anxiety, while increasing access to charging, therefore supporting greater uptake of
electric vehicles. Increased depot, workplace, and public charging can also support the adoption of
electric fleet vehicles, including light, medium, and heavy-duty vehicles.

The development of widespread electric vehicle charging infrastructure is likely to generate
thousands of new jobs. With the right policies in place to ensure job quality and equity, these new
jobs can support pathways into skilled training and careers and can benefit workers in priority
communities. Priority communities include those that disproportionately suffer from historic health,

1
 https://afdc.energy.gov/vehicles/search/

 Page 10 of 70
environmental, and other social burdens, including, among others, poverty, high unemployment,
inadequate access to education and training, air and water pollution, and chronic diseases. Priority
communities often include high levels of residents and households with low-income status, seniors,
people with disabilities, non-English speakers, and those with limited awareness of or access to clean
transportation and mobility. Priority communities include those that may otherwise be referred to as
disadvantaged communities (DACs) or low-income communities.

This report begins with a discussion of the current state of knowledge of the electric vehicle
charging infrastructure demands, followed by a discussion of the state of the electric vehicle
charging workforce. Next, this report discusses available policies, incentives, and programs that
support electric vehicle charging infrastructure development, including in the context of
employment opportunities for priority communities. The report concludes with an assessment of
workforce needs to meet projected infrastructure demand and metrics of success to measure
workforce engagement with priority communities.

2 Electric Vehicle Charging Infrastructure
The impacts of electrifying the U.S. transportation sector and associated infrastructure (e.g., truck
stops, additional chargers) could have a transformative effect on our nation’s economy, with the
potential to generate skilled, resilient, and long-term employment opportunities. With proper
development of charging infrastructure, electrification of vehicles may proliferate, potentially leading
to lower pollution levels, more resilient electricity grids, and growth in employment. However,
growth in employment needs to consider potential benefits to priority communities.

The California Energy Commission (CEC) forecasts that by 2025 there will be between 1.5 million
and 2.4 million zero-emission vehicles on the roads in California, with the majority being BEVs2
(Zabin et al. 2020). Though currently less than 10% of the total vehicles on the road in California,
alternatively fueled vehicle market penetration on the scale necessary to decarbonize the
transportation sector will require significant education, outreach, and supporting infrastructure.

The need for construction and fueling infrastructure is great, as widespread deployment of electric
vehicles cannot rely on the conventional network of refueling infrastructure. Supporting electric
vehicle adoption across all customer segments requires charging infrastructure across a range of
accessible locations including at home, the workplace, along transit corridors, and in urban centers.

The charging needs of LDVs can differ significantly to those of medium and heavy-duty vehicles
(M/HDVs). Medium- and heavy-duty vehicle charging infrastructure must be designed and built to
handle larger vehicles and electricity loads, with associated safety technology, all of which lead to
greater charging station complexity. Additionally, due to the operational characteristics of M/HDVs,
their charging cycles may be less flexible than LDVs, thereby introducing grid load-balancing
challenges.

2
 Fuel cell electric vehicles (FCEV) are also available, though not currently as widely distributed as BEVs. FCEVs derive
electrical energy from on board fuel cells, including hydrogen, to drive the vehicle’s propulsion system. FCEV fueling
infrastructure is not covered in this report. This report focuses on workforce needs for installing battery electric charging
infrastructure.

 Page 11 of 70
2.1 Electric Vehicle Charging Stations
The Alternative Fuels Data Center (AFDC) reports that there are around 42,000 public electric
vehicle charging stations in the U.S. with a total of ~102,000 Level 2 and DC Fast charging outlets,
as of May 2021 (Figure 1).3 California leads the way with about 13,000 public charging stations,
followed by New York State with ~2,500, Florida with ~2,200, Texas with ~2,000, Massachusetts
with ~1,700, and Washington state with ~1,500 charging stations.

Figure 1: Map of AFDC station locations in the United States. Each grey dot represents a charging station.

The majority of electric vehicle chargers installed in the U.S. at public charging stations are Level 2
type chargers (81.7%), most commonly with SAE J1772 connectors, with DC Fast chargers making
up 17.5% of the total.4 DC Fast chargers are also referred to as DC Level 2 chargers if delivering less
than 400kW of power but are typically reported and discussed separately. California also leads the
way in the number of public chargers installed in the U.S. with ~27,200 Level 2 chargers, and
~5,500 DC Fast chargers (Figure 2). Data from the California Energy Commission (CEC) show that
there are an additional ~40,000 Level 2 and ~620 DC Fast chargers at shared private5 charging
stations in California.6 New York, the next highest state, has ~5,300 Level 2 chargers and ~630 DC
Fast chargers. State totals of electric vehicle charging stations and chargers by type are shown in
Figure 2.
3
 https://afdc.energy.gov/fuels/electricity_locations.html#/find/nearest?fuel=ELEC
4
 Percentages do not sum to 100%. The remaining stations are identified by AFDC as public Level 1 charging stations
most commonly with SAE J1772 connectors .
5
 Shared private chargers include those that are located at workplaces or multi-unit dwellings and are accessible to
property owners, employees, visitors and residents of the property.
6
 California Energy Commission Zero Emission Vehicle and Infrastructure Statistics. Data last updated April 30, 2021.
Retrieved May 20, 2021 from https://www.energy.ca.gov/zevstats

 Page 12 of 70
California has a goal of 250,000 charging stations by 2025 (California Governor Brown EO B-48-
18),7 a ~7.6 times increase over May 2021 charging station counts. The National Renewable Energy
Laboratory’s (NREL) 2017 report “National Plug-In Electric Vehicle Infrastructure Analysis”
(Wood et al. 2017) estimates that with 15 million light-duty plug-in electric vehicles (PEV) on the
road in 2030, there would need to be 27,500 DC Fast charger plugs and 601,000 Level 2 plugs at
public and workplace stations across the U.S. to meet demand for charging. Taking the simple ratio
of these estimates, NREL (2017) estimates a need of one public Level 2 plug per 25 light-duty PEVs
on the road (40 Level 2 plugs per thousand LDV PEVs), and one DC Fast charger plug per 545
light-duty PEVs (1.8 DC Fast charger EVSE per thousand LDV PEVs). Of course, the demand for
Level 2 and DC Fast charging hinges on the purchasing patterns of electric vehicles, and these
estimated ratios of needed chargers to electric vehicles should only be taken as indicative, not
prescriptive.

Figure 2: Number of public electric vehicle stations (left) and chargers (right) by state as of May 2020 (Source: AFDC).

The current status of charger installations is equivalent to 12.7% of the NREL projected demand for
public Level 2 chargers, and 61.2% of the DC Fast charger demand. Importantly, however, the
current mix of DC Fast charging stations listed in the AFDC database (based on the “EV Network
Web” field) shows that 25.9% of stations are Tesla Supercharger stations, meaning around a quarter

7
 https://www.ca.gov/archive/gov39/2018/01/26/governor-brown-takes-action-to-increase-zero-emission-vehicles-
fund-new-climate-investments/index.html

 Page 13 of 70
of the current DC Fast charger infrastructure is unavailable to drivers of vehicles that are not Teslas.
DC Fast charging stations that are limited to one particular automaker may also be limiting to the
needs of the used vehicle market.

EVgo, a public electric vehicle fast charging network, reported that demand for DC Fast charging
may be as high as 45,000 DC Fast chargers by 2025 (Levy, Riu, and Zoi 2020). EVgo notes that the
number of DC Fast chargers necessary to meet demand is both a function of the total number of
DC Fast charger capable vehicles, and the manner in which those vehicles are driven. Rideshare and
delivery drivers, who drive more miles per day than the average driver, need access to fast charging,
so as to maximize their profitable operations, whereas office workers may be better able to use Level
2 charging more effectively as their vehicles sit dormant for long periods. Additionally, those
without access to home or workplace charging may benefit from better availability of DC Fast
chargers. The importance of readily available DC Fast charging towards widespread electric vehicle
adoption is also cited by Electrify America (Electrify America, 2021)

2.2 Light, Medium, and Heavy Duty Electric Vehicles
Battery electric vehicles is a collective term for vehicles that are fully battery powered (BEVs or
electric vehicles) and vehicles that are plug-in hybrid electric vehicles (PHEVs). These vehicles all
connect to the electrical grid to charge the onboard battery, which is then used to drive electric
motors. Battery electric vehicles do not have an internal combustion engine (ICE) and rely entirely
on energy stored in the battery to drive the motors. Plug-in hybrid electric vehicles have an ICE
which can either directly drive the propulsion systems, or be used to charge the battery, which then
drives the propulsion system.

The U.S. Energy Information Administration Annual Energy Outlook8 (AEO, Table 38) projects
rapidly rising demand for 200- and 300-mile range light-duty electric vehicles, rising ~7x from total
sales (including 100-mile range vehicles) of around 240,000 vehicles in 2019 to 1.7 million light-duty
electric vehicles in 2050 (Figure 3). Demand growth is driven by projected demand for 200-mile and
300-mile electric vehicles, with very low, and flat, projected demand for 100-mile electric vehicles.

Light-duty vehicles are defined by the Federal Highway Administration (FHWA) as Class 1 and
Class 2 vehicles (Figure 4), with gross vehicular weight ratings (GVWR) less than 10,000 lbs. Light-
duty vehicles include conventional family vehicles, including sport utility vehicles (SUVs) as well as
full size pickups. The LDV sector accounts for 91% of U.S. vehicles by transportation mode,9 and
most available electric vehicles on the market in the U.S. are in the light-duty sector.

8
 https://www.eia.gov/outlooks/aeo/data/browser/#/?id=48-AEO2021&cases=ref2021&sourcekey=0
9
 https://www.bts.gov/content/number-us-aircraft-vehicles-vessels-and-other-conveyances

 Page 14 of 70
Figure 3: Projected growth in light-duty electric vehicles sales (EIA, 2020)

Figure 4: Vehicle types by classification10

10
 https://afdc.energy.gov/data/10381

 Page 15 of 70
Medium-duty vehicles (MDVs) are those with GVWRs between 10,001 and 26,000 lbs. Medium-
duty vehicles include classes 3-6, encompassing a range of vehicle types including delivery and utility
services vehicles. Class 6 vehicles include school buses as well as larger delivery vehicles (Figure 4).
Heavy-duty vehicles (HDVs) are those with GVWRs greater than 26,001 lbs., including Class 7 and
Class 8 vehicles. Heavy-duty vehicles include tractor-trailers, heavy-duty utility vehicles, including
refuse trucks, fire trucks, and fuel tankers, as well as transit buses and coaches.

2.3 Technical Aspects of Charging Infrastructure
Charging stations vary in their applications of three types of chargers: Level 1, Level 2 and DC Fast
chargers. DC Fast chargers are sometimes termed DC Level 2 chargers if they deliver less than
400kW of power but are typically referred to as DC Fast chargers and considered separately from
AC Level 2 chargers as they utilize direct current. Medium- and heavy-duty electric vehicles are
expected to utilize either 50 kW chargers when able to charge more slowly, or 350 kW DC Fast
chargers for rapid charging using the SAE J3068 standard.11

Since electrical outlets use alternating current (AC) and batteries use direct current (DC), AC power
must be converted to DC either within the charger or onboard the electric vehicle. Level 1 and 2
chargers use AC, which is converted into DC by the electric vehicle’s power management system.
DC Fast chargers convert AC into DC within the charger itself, without using the vehicle’s on-board
power management system, and directly charge the battery, allowing for a faster and more powerful
charge of the vehicle.

2.3.1 Level 1
Level 1 chargers are rarely found publicly and compose less than 2% of U.S. public charging outlets
as of 2020,12 but are common in households. This is because most electric vehicles include Level 1
cords with their purchase. They use a 120V AC plug that can be plugged into a standard outlet and
charges at a rate of 2-5 miles per hour, using an SAE J1772 charge port. Level 1 chargers can use
existing circuits, but in some cases additional electrical work is required to ensure that the existing
circuit can safely handle the load.

2.3.2 Level 2
Level 2 chargers are currently the most common charging ports publicly available. They make up
about 80% of all U.S. public charging outlets as of 2020.13 These outlets use either 208V or 240V
alternating current (AC) electrical output that typically charges at a rate of 10-20 miles per hour. The
same connector and charge port used in Level 1 charging is employed here (SAE J1772), which
allows for a more universal acceptance of stations by most electric vehicles. An individual Level 2
charging port typically falls in the range of $380-$690 for residential chargers, and $2,500-$4,900 for
commercial chargers (Nelder and Rogers 2019).

2.3.3 DC Fast Charging
DC Fast chargers, sometimes also termed DC Level 2 and also sometimes incorrectly referred to as
Level 3 chargers, charge at a rate of 60-80 miles per 20 minutes. DC Level 2 chargers provide up to
400kW of maximum power. This type of charger has more variation in plug type used, with three

11
 https://www.sae.org/standards/content/j3068_201804/
12
 https://afdc.energy.gov/fuels/electricity_locations.html#/find/nearest?fuel=ELEC
13
 https://afdc.energy.gov/fuels/electricity_infrastructure.html

 Page 16 of 70
different common connecting ports: the Combined Charging System (CCS) connector (or J1772
combo), which is the most common in the U.S., and which can also be used in Level 1 and 2
charging; the CHAdeMO connector; and the Tesla connector which is unique to Teslas. Currently,
about 18% of U.S. public charging outlets are DC Fast chargers.14 DC Fast chargers are more
expensive than Level 2 chargers, and prices vary with power outputs. The Rocky Mountain Institute
(RMI) estimates that equipment costs range from $20,000-$35,000 for a 50kW DC Fast charger,
$75,600-$100,000 for a 150kW charger, and $128,000-$150,000 for a 350kW charger. Estimates
reported by Nicholas (2019) indicate that labor costs to install a 350kW DC Fast charger are around
45% greater than for a 50kW DC Fast charger.

Typically the electric utility installs the connection to the grid where new connections are necessary,
and electricians and electrical contractors install the charger and associated electrical infrastructure.
The need for new grid connections is becoming increasingly common, due to growth of higher
powered charging infrastructure. Notable differences exist between installations of different types,
with DC Fast chargers requiring more work on the grid side of the meter than Level 2 chargers
before the charger can be connected to the system.

2.3.4 Medium and Heavy-Duty Charging
As with light-duty charging, medium- and heavy-duty charging connectors have specific
requirements. In addition to the connections used for DC Fast charging (most commonly CCS),
three emerging connectors for this sector are the SAE J3068, J3105, and J2954/2. The SAE J3068
connector has been deployed on heavy-duty trucks; the SAE J3105 connector is designed primarily
for transit buses and is capable of providing 350 kW DC charging; and the SAE J2954/2 is designed
for wireless power transfer for heavy-duty vehicles.

2.4 Grid Integration and Hardening
Electric vehicles draw significant power while charging the vehicle batteries, especially when
connected to DC Fast Charging stations, where single charging units may draw up to 350kW,
depending on the battery capabilities of the vehicle. However, while connected to smart grids,
electric vehicles may behave like a distributed energy resource (DER) (Das et al. 2020), offering
vehicle grid integration (VGI) responses and energy transfers that can improve grid resiliency and
facilitate bidirectional and smart charging. Grid reliability is a challenge for many priority
communities (Federico et al. 2019); as such, increasing deployment of electric vehicles could deliver
significant benefits for the grid and communities, but also present challenges.15

Grid hardening is a term for increasing the resiliency and security of electrical grids. Shea (2018)
identifies a set of subcategories for grid hardening. These include: resilience against extreme events,
reliability through grid modernization, protection against malicious attacks, and regulatory and
government preparedness for these scenarios. Electric vehicle grid integration has the potential to
support grid hardening, by providing a distributed network of batteries with the potential to connect
to and support the grid in times of stress, and charge in a manner responsive to grid conditions.

14
 See footnote 10
15
 This and the following sections section on challenges and benefits benefit greatly from the detailed electric vehicle
overview of electric vehicle grid integration provided by Das et al. (2020)

 Page 17 of 70
Prior to connecting to the utility grid, the grid on the utility side of the meter needs to be made ready
to handle the additional loads of electric vehicle chargers. Make-ready work needs to be completed
before the charging station can be connected to the grid and may include line and transformer
upgrades as well as additional safety measures. The amount of make-ready work required is a
function of the existing local grid parameters and the anticipated needs of charging infrastructure.
Make-ready work is an especially important consideration for larger DC Fast charging stations and
medium- and heavy-duty fleet charging, where power demands are likely to be large, and could
potentially be upwards of a few megawatts.

2.4.1 Grid Integration and Hardening: Challenges
Uncontrolled or unanticipated increases in load during peak electric vehicle charging periods can
strain local and regional grids, overload components and reduce the lifespan of the grid management
system (Hadley and Tsvetkova 2009; Yong et al. 2015; Yan and Kezunovic 2012). Furthermore,
significant increases in power consumption by electric vehicles in one part of the grid may lead to
imbalances and power losses in the distribution system, which has real and significant effects on
electrical delivery to other grid users if demand remains unbalanced (Pieltain Fernández et al. 2011).
Chargers convert grid power to battery power, which can alter voltage and current and cause
imbalances with the grid power.

2.4.2 Grid Integration and Hardening: Benefits
Though it comes with a set of challenges, electric vehicle grid integration also has potential benefits
to the grid. When electric vehicles are connected to the grid in VGI configurations, they collectively
act as a distributed energy resource, essentially acting as a distributed grid of batteries, which happen
to also be connected to cars. Electric vehicles can utilize smart charging programs and provide
power management when connected in VGI configurations, smoothing surges and flickers, and
potentially rapidly providing energy back to the grid in times of high demand. They can also offer
low charging demand and act as extra grid storage during periods of excess energy production
(Kempton and Tomić 2005). Vehicles providing “vehicle-to-grid” (V2G) services can engage in
contracts with the electrical utility to receive compensation for the grid services they provide,
offsetting the cost of ownership of the vehicle (Shirazi, Carr, and Knapp 2015). Additionally, public
charging often takes place during the day, which aligns with the load profile of solar generation in
California.

3 Workforce Needs
Workforce needs associated with BEV charging infrastructure vary across four phases. These phases
are (1) knowledge and skills training, including apprenticeships, training programs, and capacity
building, (2) planning, (3) construction and installation, and (4) operations and maintenance – and
different industries are engaged during different phases of the process.

The electric vehicle industry ecosystem has no set definition, instead falling across a set of existing
industries. The Los Angeles Economic Development Corporation (LAEDC) identified the set of
industries and their associated North American Industry Classification System (NAICS) codes
through a review of a suite of electric vehicle-related companies and their Data Universal
Numbering System (DUNS) registrations. LAEDC identified 17 subsectors, identified in Table 1.

 Page 18 of 70
Table 1: EV ecosystem job sectors identified by LAEDC

 NAICS Code Description
 221 Utilities
 238 Specialty Trade Contractors
 335 Electrical Equipment, Appliance, and Component
 336 Transportation Equipment Manufacturing
 423 Merchant Wholesalers, Durable Goods
 441 Motor Vehicle and Parts Dealers
 485 Transit and Ground Transportation
 511 Software Publishers
 523 Securities, Commodities Contracts and Other Financial Instruments
 524 Insurance Carriers and Related Activities
 541 Professional, Scientific and Technical Services
 551 Management of Companies and Enterprises
 561 Administrative and Support Services
 611 Educational Services (Vocational Training)
 624 Vocational Rehabilitation
 811 Repair and Maintenance
 999 Unclassified

The list in Table 1 considers the entire ecosystem associated with the electric vehicle industry, from
research and development, vehicle and battery manufacturing, sales, ownership and maintenance,
and infrastructure. This list is not limited solely to the charger installation phase, which most likely
falls under NAICS sector 238. While there are likely significant workforce benefits to onshoring
manufacturing of charging devices and supporting equipment, his report focuses on workforces
associated with the installation of charging infrastructure.

As noted by E2 in their 2020 Clean Jobs Better Jobs report, most clean energy jobs, including charger
installations, are extensions of existing employment sectors, albeit with skills, training, and
certification specific to the sector. Many of the essential skills are transferable between similar clean
energy and non-clean energy jobs, allowing for robust, “high-road” careers.16 The work of EVSE
installers requires additional training and certification. In the case of charger installation, the
foundational skill sets and training required are those already established in the electrical industry.

16
 This report defined “high-road” careers per the California Workforce Development Board but acknowledges that
there may be differences between states: “High-road jobs are jobs created within a high-road economy, which not only
centers job quality, but also sustainability and equity. In a “high-road” economy, firms compete by capturing the value of
innovation, quality, and worker skill, rather than pursuing a “low-road” race to the bottom based on low wages and
environmental externalities. The result is family-supporting jobs, with better wages and benefits, opportunities for entry
and advancement, and respect for worker voice. “High-road jobs” is a broader term than “high-quality jobs.” ”
“High-quality jobs: The ideal job pays a family-sustaining wage, offers comprehensive employer-provided benefits,
values worker voice, and provides security, fair scheduling, a safe and healthy work environment, and pathways for
career advancement. There is no single standard for a quality job across regions and industries. A key element of the
broader term “high-road jobs.”” Additional discussion may be found at https://cwdb.ca.gov/wp-
content/uploads/sites/43/2019/09/High-Road-ECJ-Brief_UPDATED-BRANDING.pdf

 Page 19 of 70
California law requires that electrical construction work – including the installation, maintenance and
repair of EVSE infrastructure – be performed by state-certified general electricians. California
Assembly Bill 841 (AB 841, 2020) additionally requires charging infrastructure to be installed by a
licensed contractor and at least one electrician who holds Electric Vehicle Infrastructure Training
Program certification (EVITP) certification for charger installations funded or authorized by certain
state agencies beginning January 1, 2022.

The majority of jobs associated with expanded electric vehicle infrastructure, while supporting green
growth, will likely fall into traditional professional, and technical sectors associated with energy
production, transmission and distribution, as well as engineering, planning and construction, and
inspection and certification. These jobs fall broadly under the NAICS sector 238, Specialty Trade
Contractors. As electric vehicle infrastructure build-out requires state-certified general electricians,
electric vehicle infrastructure jobs fall more specifically under NAICS sector 238210 “Electrical
Contractors and Other Wiring Installation Contractors.” While this sector is not specific to the
electric vehicle infrastructure industry, at this time new industry sectors aren’t being defined around
electric vehicle infrastructure installation, as many of the baseline electrical contracting and
electrician skills are transferable from other applications, but instead are enhanced by the addition of
jobs and skills related to installing electric vehicle charging.

The Bureau of Labor Statistics (BLS) Occupational Employment Statistics estimate that the
“Electrical Contractors and Other Wiring Installation Contractors” sector (NAICS code 238210)
employs 950,680 workers in the 50 U.S. states plus the District of Columbia.17 These jobs are
concentrated in the “Construction and Extraction Occupations” with national statistics showing
69.0% of jobs in NAICS sector 238210 falling in this occupational category (Figure 5), with around
60% of those jobs being electrical. The next most common category by occupation under NAICS
code 238210 is installation, maintenance, and repair (9.6%), followed by office and administrative
support (8.5%), management (4.6%), and business and financial operations (3.0%). Taken together,
these top 5 occupational categories account for 94.7% of total employment in the Electrical
Contractors and Other Wiring Installation Contractors sector (Figure 5).

Figure 5: Percent of employment in NAICS sector 238210 by occupation

17
 https://www.bls.gov/oes/current/oes_research_estimates.htm

 Page 20 of 70
3.1 Knowledge and Skills Training
Charging infrastructure draws a significant amount of energy from the grid. Therefore, safety
measures are of paramount importance for installers, maintenance staff, operators, and customers of
electric vehicle charging stations. While local building, fire, and municipal codes may vary, charger
safety measures are standardized under the National Fire Protection Association (NFPA) and
National Electric Code (NEC) standards, among others. NFPA 7018 covers instructions on wiring
and installing electrical conductors, while NEC 625 provides standards for charger installation,
including connections to circuitry. The set of standards applicable to charger installation requires
detailed understanding by installation professionals to ensure the safe install and function of
charging devices. Discussion of the whole set of standards falls outside the scope of this work, but
merits attention (Das et al. 2020).

In addition to national, state, and local standards, separate training programs are available for
installers of electric vehicle infrastructure. For example, the Electric Vehicle Infrastructure Training
Program (EVITP) is a national program that provides certification and skill upgrades that enhance
electricians’ foundational skills (Zabin et al. 2020). State licensure for electricians requires 8,000
hours of training as an apprentice before sitting for certification. The EVITP is an 18-hour
continuing education training course and the examination is not overseen or administered by the
state. The EVITP provides education that complements electricians’ existing skills to better enable
them to install charging infrastructure, and its curriculum was designed and developed to address
issues of workplace safety during the installation and maintenance of charging equipment (Zabin et
al. 2020). To date the EVITP has certified over 4,000 electricians in the U.S. and Canada.19 California
Assembly Bill 841 specifies that projects funded by California state entities have at least 25% of the
electricians on the crew be EVITP certified.

3.2 Sales and Marketing Job Roles
The electric vehicle landscape is rapidly changing, with a range of legacy and developing electric
vehicle and charging technologies on the market, with varying feature sets and capabilities.
Conversations with charger installers (Personal communication, Mike Moser, 2020) identified the
sales and marketing phase of charger installation as integral to the overall success of the charging
site. Specialized skills and training on charger features, vehicle capabilities, and site host needs and
expectations are necessary for sales and marketing professionals to effectively meet the needs of site
hosts. Additionally, given that charging needs and vehicle sales are closely linked, automobile
salespeople should be trained and knowledgeable about the parameters of the vehicle models they
sell, including used vehicles, in order to increase access and exposure to the technology for all
potential purchasers (De Rubens, Noel, and Sovacool 2018). Furthermore, sales professionals
should be knowledgeable of available incentives and funding opportunities for electric vehicles and
charging infrastructure, and how they apply to the specific charging station models they are selling,
as public funding opportunities may stipulate that only certain charger types or models are eligible
for funding.

3.3 Planning and Permitting Job Roles
Non-residential charging stations often require extensive planning and permitting. First, if the
preferred site is not owned by the site host, real estate professionals are involved in drawing up the

18
 Association NFP. Nfpa 70: national electrical code. National Fire Protection Assoc; 2017.
19
 https://evitp.org/

 Page 21 of 70
You can also read