Preparing New Zealand for rising seas: Certainty and Uncertainty November 2015 - Parliamentary ...
←
→
Page content transcription
If your browser does not render page correctly, please read the page content below
Preparing New Zealand for rising seas:
Certainty and Uncertainty
November 2015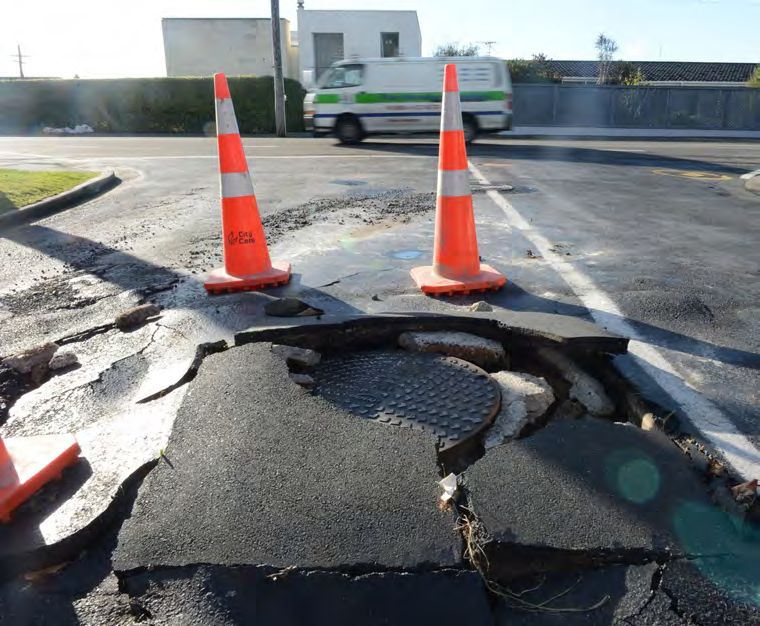
2

    Acknowledgements
    The Parliamentary Commissioner for the Environment would like to express her
    gratitude to those who assisted with the research and preparation of this report,
    with special thanks to her staff who worked so tirelessly to bring it to completion.

    Photography
    Cover photo: Rock armouring at Cooks Beach, Coromandel.
    Source: Parliamentary Commissioner for the Environment archives

    This document may be copied provided that the source is acknowledged.

    This report and other publications by the Parliamentary Commissioner for the
    Environment are available at: www.pce.parliament.nz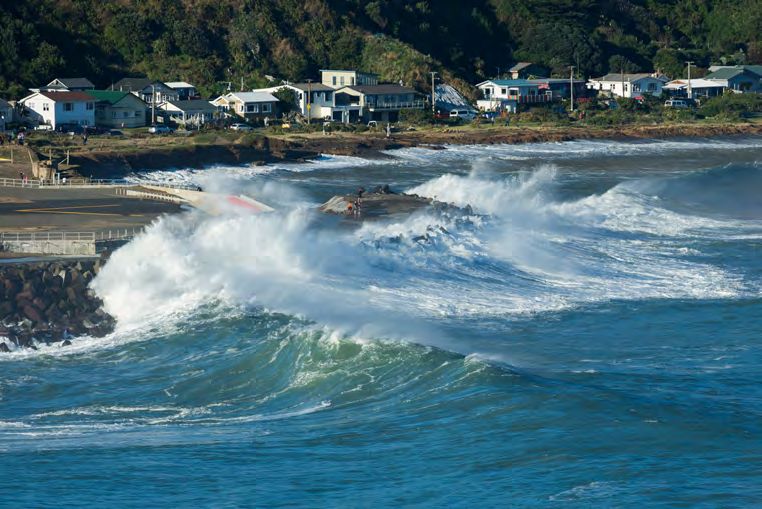
3

Contents

    Contents			                                              3

    Overview			                                              5
                                                                  3

    1   Introduction		                                       9

        1.1    The purpose of this report                    10

        1.2    Rising sea level                              11

        1.3    Adapting to sea level rise                    12

        1.4    What this report does not cover               14

        1.5    What comes next                               15

    2   What lies ahead?		                                   17

        2.1    How fast will the sea rise?                   18

        2.2    Natural variation in the height of the sea    20

        2.3    Changing rainfall, wind, and storms           22

        2.4    Three types of coastal hazard                 23

    3   Coastal flooding		                                   25

        3.1    Vulnerability to coastal flooding             26

        3.2    A rising sea will increase coastal flooding   28

        3.3    In conclusion		                               31

    4   Coastal erosion		                                    33

        4.1    Vulnerability to coastal erosion              34

        4.2    A rising sea will increase coastal erosion    36

        4.3    In conclusion		                               38

    5   Coastal groundwater                                  39

        5.1    High groundwater                              40

        5.2    Saltwater intrusion                           42

        5.3    In conclusion		                               43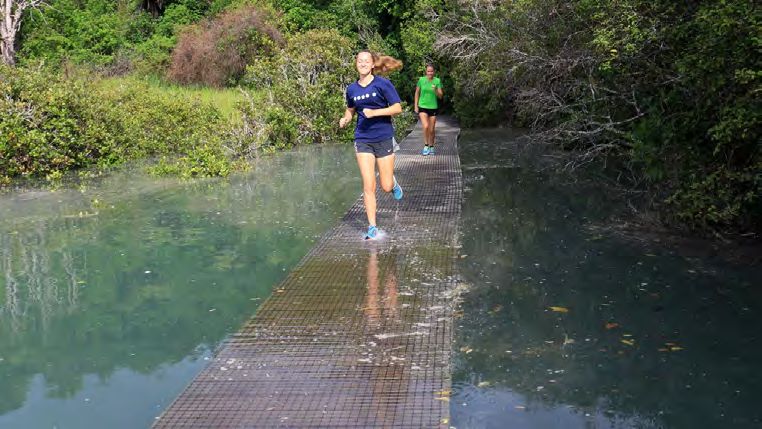
6   Low-lying and close to the coast                             45

        6.1     Elevation maps and RiskScape                         46
4       6.2     Four coastal cities                                  48

    		          Auckland		                                           48
    		          Wellington		                                         50
    		          Christchurch		                                       52
    		          Dunedin		                                            54

        6.3     Other coastal towns and cities                       56

        6.4     In conclusion 		                                     58

    7   Dealing with coastal hazards in New Zealand                  59

        7.1     Erosion – a long-familiar coastal hazard             60

        7.2     Sea level rise – amplifying coastal hazards          61

        7.3     Auckland and Coromandel                              63

        7.4     Wellington and Kapiti                                65

        7.5     Christchurch		                                       67

        7.6     Dunedin		                                            69

        7.7     In conclusion		                                      70

    8   Conclusions and recommendations                              71

        8.1     National direction and guidance                      73

        8.2     Measuring land elevation                             74

        8.3     Projections of sea level rise                        75

        8.4     Time horizons – how far ahead to look?               76

        8.5     Separating scientific assessment and decision-making		77

        8.6     Engaging with communities		78

        8.7     Strategies for coastlines                            79

        8.8     Fiscal risk associated with sea level rise           80

    Notes				                                                        82

    References				90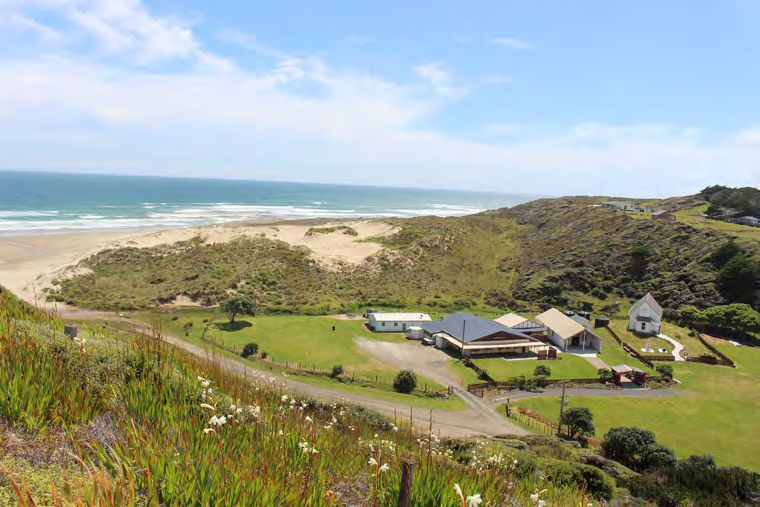
5

Overview

    Sunday 14th June this year was a beautiful windless day in Wellington. On such rare
    days the sea is usually like glass. But looking down on Lyall Bay, I was surprised to
    see huge rolling waves washing up the beach and across the road, scattering rocks
    the size of basketballs across a car park. A great storm in the Southern Ocean had
                                                                                                 5
    generated giant waves that had travelled, weakening but unimpeded over hundreds
    of kilometres of sea, to be lifted on top of a king tide as they finally broke on
    Wellington’s south coast.

    The sea level rise that has already occurred played only a small part in what happened
    in Lyall Bay that day, but as the sea continues to rise, there will be more and more
    such ‘flood events’ as the scientists call them.

    The subtitle of this report is ‘Certainty and Uncertainty’. It is certain that the sea is
    rising and will continue to do so for centuries to come. But much is uncertain – how
    rapidly it will rise, how different coastal areas will be affected, and how we should
    prepare. And we do need to prepare. After all, as an article in the New York Times
    put it this year: “Human civilization is built on the premise that the level of the sea is
    stable, as indeed it has been for several thousand years”.

    The rising sea will lead to flooding on low-lying land near the coast, erosion of many
    beaches and ‘soft’ cliffs, and higher and possibly saltier coastal groundwater.

      •   Flooding of coastal areas will become more frequent, more severe, and more
          extensive.

      •   Erosion – a long-familiar problem around some of our coasts – will become
          more widespread.

      •   Groundwater linked to the sea will rise and possibly become brackish.

    However, care must be taken with generalisations. Local features matter a great deal.

    For instance, open unsheltered coasts experience the full force of the sea, so are
    more vulnerable to flooding than enclosed bays. Beaches regularly replenished with
    sediment are less prone to erosion. Groundwater problems are most likely to occur in
    land that has been reclaimed from the sea.

    Natural hazards like earthquakes, volcanic eruptions, and river floods can happen at
    any time. In contrast, sea level rise is incremental and inexorable – its effects on our
    coast will unfold slowly for a period before accelerating. We must start planning, but
    there is enough time to plan and do it well.

    Certainly the world, including New Zealand, needs to act urgently to reduce carbon
    dioxide and other greenhouse gas emissions. However, during this investigation, I
    have realised that the same urgency does not apply to much of the planning we need
    to do for sea level rise. Indeed, haste can be counter-productive.

    Central government has provided some direction and guidance for councils, but it
    is time for a major review. Councils that have begun to plan for sea level rise have
    sometimes found themselves between ‘a rock and a hard place’.

    In a number of locations around the country, the setting of coastal hazard zones
    based on projections of future flooding and erosion has been challenged by affected
    homeowners. Receiving a letter saying that your property has been zoned as
    susceptible to flooding or erosion can come as a shock.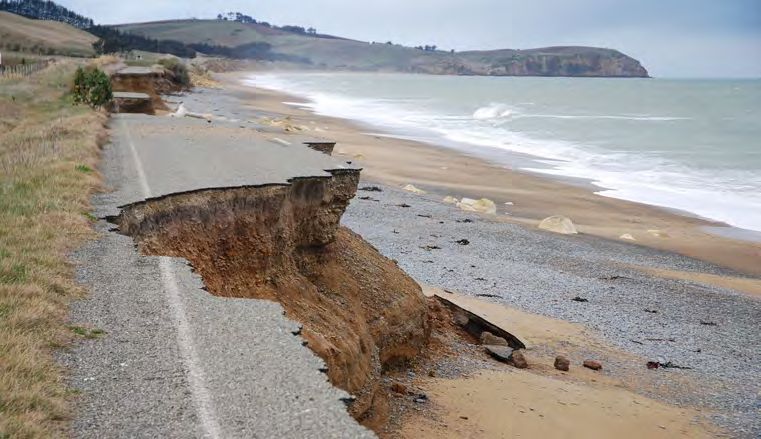
Homes are much more than financial equity. Such zoning and any regulations that
    follow must be based on a fair process and technical assessments that are both
    rigorous and transparent.

    While these principles should hold for planning for any hazards under the Resource
    Management Act, planning for sea level rise is outside our experience – it is terra
    incognita.
6   Part of making such a process fairer is simply to slow it down into a number of steps.
    It is for this reason that I decided to include the four elevation maps in this report
    with more available on our website.

    This was not an easy decision because I do not want to alarm people unnecessarily.
    But the first stage in a step by step process should be the provision of information,
    beginning with accurate elevation maps of coastal land. Note that the coloured
    areas on these maps in this report are not coastal hazard zones; they simply denote
    elevation above spring high tide levels.

    The analysis used to generate the information for these maps shows that at least
    nine thousand homes lie less than 50 centimetres above spring high tide levels.
    This is more than the number of homes that were red zoned after the Christchurch
    earthquakes.

    Also needed is a clear distinction between the role of technical analysts who
    undertake coastal risk assessments and the role of the decision-makers who sit
    around council tables.

    Because current government policy on sea level rise emphasises the need to take a
    ‘precautionary approach’, technical analysts have been embedding ‘precaution’ into
    coastal risk assessments to varying degrees. This takes various forms such as assuming
    ‘high end’ amounts of sea level rise.

    But undertaking a coastal risk assessment is very different from designing a building
    or a bridge where redundancy and safety factors are intrinsic to the design. Technical
    assessments of coastal risk should be based on best estimates of all the parameters
    and assumptions that are fed into the modelling. Decision-makers should then take
    the modelling outputs including estimates of uncertainty, and then openly and
    transparently decide how cautious to be in delineating hazard zones.

    Clear communication is another vital component of a good process – there is a
    need to develop a lingua franca – a language that will bridge the gap between the
    experts and the rest of us. In one report, I was amused to discover a heavy downpour
    described as a ‘subdaily precipitation extreme’.

    One particular need is to avoid referring to ‘one-in-50 year’ or ‘one-in-100 year’
    events. Not only is it difficult to understand, it is not a stable measure over time.
    The ‘high water’ caused by a storm surge riding on top of a king tide that is now
    expected to occur once every 100 years will occur more and more often as the sea
    rises.

    There are aspects of planning for sea level rise that should be done with some
    urgency. One is concerned with the granting of consents for greenfields
    development. New suburbs and the expensive infrastructure they require should
    be viewed as long-term investments. We now see building new suburbs on land
    prone to liquefaction in much of the country as foolish. We should see allowing new
    subdivisions on vulnerable coastal land as equally foolish.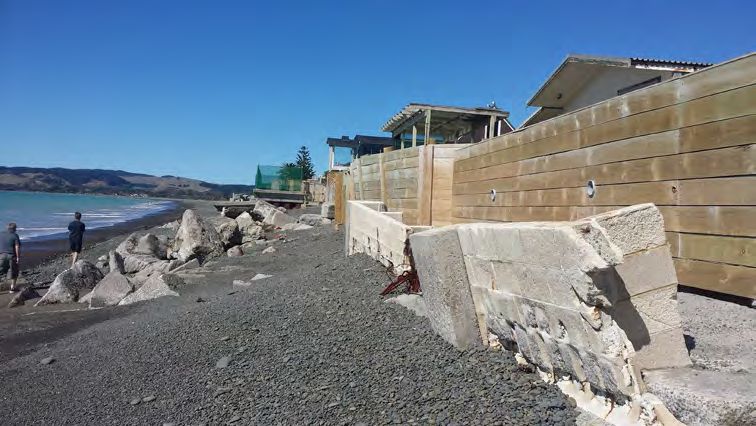
7

Another is the need to establish much more extensive monitoring systems. This is
required before we can develop better models of shoreline erosion and accretion.
Such monitoring is also needed for adaptive management, which will be the
appropriate strategy in many cases. Adaptive management involves staging
interventions over time as trigger points are reached.

Unusually, one of my recommendations in this report is to the Minister of Finance.
It is not too soon to begin to consider the fiscal implications of sea level rise. Both   7
central and local government will face increasing pleas for financial assistance –
whether it be for building a seawall, maintaining an eroding coastal road, or, as will
eventually happen, moving entire communities further inland.

As I write this, delegates from hundreds of countries are about to meet in Paris to
try to hammer out a new agreement to slow the rate of climate change. I remain
optimistic. What the world, including our small country, does now will affect how
fast and how high the sea rises.

Dr Jan Wright

Parliamentary Commissioner for the Environment
8
1
Introduction

Over many millennia, the Earth’s climate has cycled between ice ages and warm
‘interglacial’ periods. Over the last seven thousand years the climate has been
relatively stable, but this is now changing. Increasing concentrations of carbon
dioxide and other greenhouse gases in the atmosphere are trapping heat and the
climate has begun to respond. One of the major and certain consequences is rising
sea level.

Nowhere in our island nation is far from the sea, and most of us live within a few
kilometres of the coast. Houses, roads, wastewater systems, and other infrastructure
have been built in coastal areas with an understanding of the reach of the tides
and the recognition that storms will occasionally combine with high tides to cause
flooding.

However, with rising seas, tides, waves and storm surges will reach further inland
than before, resulting in more frequent and extensive flooding. Along some coasts,
erosion will increase and shorelines will recede. In some areas, the water table will
rise.

The vulnerability of different coastal areas to the rising sea depends on many factors.
Elevation – height above the sea – is the first factor that comes to mind when
considering the potential impacts of sea level rise, but it is far from the only one. The
shape of the coastline, the topography of the land and the seabed, the proximity to
the sea, the presence of barriers such as sand dunes, and other local characteristics
will affect what happens in different coastal areas.

Other consequences of climate change, such as changing wind and rainfall patterns,
will also come into play, increasing or reducing the impacts of rising seas. For
instance, more intense rainfall coinciding with storm surges will exacerbate coastal
flooding.
Chapter 1 – Introduction

              Like other countries, New Zealand needs to prepare for rising seas.

              Under New Zealand law, the enormously challenging task of planning for sea level
              rise is the responsibility of local government. It is challenging on many levels. For
              a start, it is technically complex, and the size and timing of impacts are uncertain.
              Perhaps the most difficult aspect is the impact on people’s homes, which for many are
10            not just their homes, but also their financial security.

     1.1 Purpose of this report

              The Parliamentary Commissioner for the Environment is an Officer of Parliament, with
              functions and powers granted by the Environment Act 1986. She provides Members
              of Parliament with independent advice in their consideration of matters that have
              impacts on the quality of the environment.

              In 2014, the Commissioner released a report titled ‘Changing climate and rising seas:
              Understanding the science’. This report was written with the intent of making the
              science of climate change, and specifically sea level rise, accessible and relevant for
              New Zealanders.

              This report follows on from the 2014 report. Its purpose is to:

                •    increase understanding of how sea level rise will affect New Zealand

                •    show how low-lying coastal areas around the country can be accurately
                     mapped in a standardised way

                •    describe how some councils have begun to plan for sea level rise

                •    identify problems with, and gaps in, the direction and guidance provided by
                     central government.

              This report has been produced pursuant to s16 of the Environment Act 1986.
11
1.2 Rising sea level
Global average sea level has risen about 20 centimetres since the beginning of the
20th century.
Records collated from tide gauges at ports around the world show that average sea
level began rising around 1900. In the last twenty-five years, satellites have enabled
11
more precise measurement and greater global coverage (Figure 1.1).
This rise in global average sea level does not mean that the sea has risen by the same
amount everywhere around the world. Changes in sea level at particular locations
vary due to a number of factors. So far the seas around New Zealand have risen
largely in line with the global average.
25
20 Satellite altimetry data
Sea level rise (cm)
15
Tide gauge data
10
5
0
-5
1880 1900 1920 1940 1960 1980 2000
Year
Data: Church and White, 2011.
Figure 1.1 Global mean sea level rise relative to 1880.
There are three main ways in which warming air temperatures are causing sea level to
rise.
• Water in the sea is becoming warmer and expanding.
• Mountain glaciers are retreating.
• Polar ice sheets on Greenland and Antarctica are shrinking.Chapter 1 – Introduction
1.3 Adapting to sea level rise
Some countries, such as Bangladesh and Kiribati, will be greatly affected by sea level
rise. But every country bordered by the sea will be affected in some way, and many
are taking actions of various kinds to prepare for higher sea levels.
This section contains two examples of adaptation to sea level rise. The first
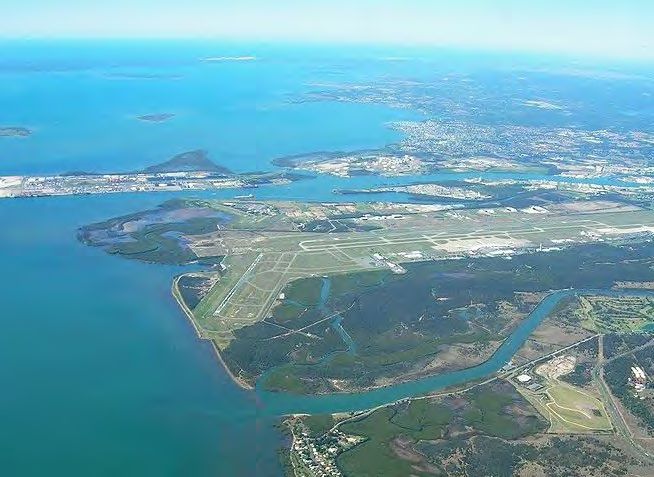
12 is concerned with future-proofing an airport development. The second is the
development of a strategy to protect a large city from flooding.
Building a new runway in Australia
A new runway at Brisbane Airport is currently under construction. The airport is
situated on low-lying land close to the coast. Frequent tropical cyclones and other
factors make the Queensland coast very vulnerable to coastal flooding, so in the
planning it was critically important that the new runway be protected from flooding
as the sea rises.
Several assessments were done to help decide what the height of the new runway
should be, beginning with the then state guideline applicable to airports. The first
step in such assessments is to use the most recent Intergovernmental Panel on
Climate Change (IPCC) projections as the best guide available of future rates of sea
level rise. Then other factors enter the calculations of design height – the height of
storm surges and waves, the frequency of tropical cyclones, rainfall in the catchment,
and so on.
Finally, a judgement must be made about the acceptable level of risk. Should the
runway be high enough so that it never floods, or is a flood once a month tolerable?
In the end, the decision was made to build the runway at a height described as
“strongly precautionary”.1 Airports are critical infrastructure. If a runway floods and
aeroplanes cannot land, the financial consequences can be very large.
Source: J Brew, Wikimedia Commons (CC BY-SA 2.0)
Figure 1.2 Brisbane airport is situated on low-lying coastal land.13
Protecting London
The Thames Barrier is a series of giant rotating gates spanning the River Thames that
began operation in 1984. It is a major part of the system of defences designed to 13
protect the city from flooding.
Flood risk in the Thames Estuary has increased over time. Half of the closures of the
barrier have been to protect against tidal flooding and half to protect against river
flooding. Both kinds of flood risk are expected to increase as the climate changes –
tidal flooding because of sea level rise and river flooding because of more intense
rainfall.
In 2002, a project called Thames Estuary 2100 was established to develop a strategy
to protect the city through to 2100. Ten years later, the TE2100 Plan was adopted.
Because the Thames Barrier was built to a high design standard, it is expected that it
will not need to be modified until about 2070.
In the TE2100 Plan, a ‘managed adaptive’ approach has been adopted. This involves
making several interventions over time to manage risk, in contrast with making
“a single, major investment in flood defence infrastructure or activity to achieve a
reduction in risk which lasts until the end of the century”.2
Source: James Campbell, Flickr (CC BY-ND 2.0)
Figure 1.3 The Thames Barrier protects London from tidal and river
flooding.Chapter 1 – Introduction
In the first example, the elevation of a new runway at Brisbane Airport, a ‘strongly
precautionary’ approach was taken. In the second example, the plan for protecting
London against flooding, an ‘adaptive management’ approach was taken.
Both make sense. In the first case, the consequences of flooding on the runway
would be so serious that the extra height was warranted. In the second case, the
14 analysis showed that what was termed a precautionary approach would be expensive
and environmentally damaging, and “… run the risk of creating an expensive ‘white
elephant’ should flood risk rise at a slower level than predicted”.
These two examples illustrate that adaption to sea level rise needs a ‘horses for
courses’ approach. In particular, different stances on risk will be appropriate for
different situations. This, and other aspects of decision-making pertinent to sea level
rise, are discussed in this report.
1.4 What this report does not cover
This report does not include any detailed discussion or analysis of the following:
• Climate change mitigation – reducing greenhouse gas emissions
• Other effects of climate change such as changing rainfall patterns, increased
river flooding, and acidification of the oceans
• Impacts of sea level rise on coastal ecosystems and landscapes
• Ownership of the foreshore and seabed or any unresolved Treaty of Waitangi
claims involving coastal land.
In particular, the report does not contain numerical estimates of the impacts of sea
level rise in particular coastal areas around the country. Although some elevation
bands are presented in maps, they do not denote coastal hazard zones, so are not
suitable for including on Land Information Memoranda (LIMs).15
1.5 What comes next?
The remainder of this report is structured as follows:
Chapter 2 contains a general description of some changes that lie ahead, beginning
with the latest IPCC projections of sea level rise. It includes an explanation of why 15
natural factors like storms change the level of the sea, and a brief description of how
climate change is expected to affect rainfall, winds, and storms in New Zealand.
Chapter 3 is an explanation of how sea level rise will increase the frequency,
severity, and extent of coastal flooding. It contains the results of modelling showing
how extreme water levels will occur increasingly often. This modelling is based on
the longest historic records of sea level in New Zealand, measured at the ports of
Auckland, Wellington, Christchurch, and Dunedin.
Chapter 4 is an explanation of how sea level rise will increase the erosion of sandy
beaches and ‘soft’ cliffs.
Chapter 5 is an explanation of the potential impacts of sea level rise on coastal
aquifers. In some places the water table will rise as the sea rises. Another
consequence may be saltwater intrusion.
Chapter 6 begins by explaining how the elevation of land above sea level can be
measured accurately using a system called LiDAR. It contains maps showing low-
lying coastal land in Auckland, Wellington, Christchurch, and Dunedin. More maps
are available at www.pce.parliament.nz. The chapter also contains the results of
running a software programme called RiskScape, showing numbers of homes and
businesses, and lengths of roads at low elevations.
Chapter 7 begins with a look back into the past, describing how governments have
dealt with the long-familiar coastal hazard of erosion. It then describes the two
government documents that currently guide and direct councils in their planning for
sea level rise. This is followed by four sections describing some of the problems that
have arisen as some councils have begun to plan for sea level rise.
Chapter 8 contains conclusions and recommendations from the Commissioner.
Three modelling exercises were commissioned to provide information for this
investigation – two from the National Institute of Water and Atmospheric Research
(NIWA) and one from Dr John Hunter of the University of Tasmania. The methodology
and results from this modelling are detailed in technical reports available at
www.pce.parliament.nz.316
2
What lies ahead?

The level of the sea has already risen significantly due to the impact of humans on the
climate, and will continue to do so for the foreseeable future.

The first section of this chapter contains the most up-to-date projections of the
increase in sea level by the Intergovernmental Panel on Climate Change (IPCC).

While climate change is raising the level of the sea, there are a number of natural
factors that influence the level of the sea at any given time. The second section is a
brief description of these factors, ranging from exceptionally high tides through to
long-term weather patterns.

Climate change is expected to affect the weather in a number of ways – described
in the third section. Some of these will have impacts on coastal areas and need to be
thought about in conjunction with sea level rise.

The final section introduces the three types of coastal hazards that will be
exacerbated by sea level rise – flooding, erosion, and groundwater that rises too high
or becomes saline.
Chapter 2 – What lies ahead?

     2.1 How fast will the sea rise?

              As air temperatures have risen around the world, water in the sea has warmed and
              expanded, and alpine glaciers have retreated. These two processes have driven most
              of the global sea level rise observed over the last hundred years or so. In the future,
18
              a third process – loss of ice from the huge ice sheets that cover Greenland and
              Antarctica – is expected to become increasingly significant. ‘Ice sheet dynamics’ is
              now the focus of much climate change research.

              The IPCC undertakes regular assessments of the current state of knowledge about
              climate change. These include projections of global sea level rise.

              In its most recent report in 2013, the projections were based on four scenarios. Each
              scenario is based on a different Representative Concentration Pathway (RCP) – a
              trajectory over time of greenhouse gas concentrations in the atmosphere.

              The projected rises in sea level that the IPCC assessed as ‘likely’ under the lowest and
              highest of these scenarios are shown in the three graphs in Figure 2.1.4

                •    The first graph shows the projected rise in sea level under the ‘Stringent
                     mitigation’ scenario (RCP2.6).

                •    The second graph shows the projected rise in sea level under the ‘Very high
                     greenhouse gas emissions’ scenario (RCP8.5).

                •    The third graph shows the projected rise in sea level under both scenarios.5

              An examination of Figure 2.1 reveals three important aspects of sea level rise.

                •    The projections for the end of the century are much more uncertain than those
                     for the middle of the century. Uncertainty grows over time.

                •    Action taken to reduce greenhouse gas emissions will make little difference to
                     the rate of sea level rise for several decades.6

                •    The two scenarios increasingly diverge in the latter half of the century. The
                     sooner emissions are curbed, the greater the effect will be in the longer term.

              Around New Zealand, the sea has so far risen at about the same rate as the global
              average, but may rise a little faster than the global average in the future.7 How fast
              the sea will rise in different places around the country also depends on whether the
              land is rising or falling; this can occur slowly over time or rapidly in an earthquake.

              The scenarios in Figure 2.1 are projections of sea level rise up to the year 2100.8 This
              does not mean that the sea will stop rising at the end of the century – it will continue
              to rise for many centuries to come.9
19
100
Stringent mitigation (RCP2.6)
80
Sea level rise (cm)
60
19
40
20
0
10
20
30
40
50
60
70
80
90
00
20
20
20
20
20
20
20
20
20
21
100
Very high greenhouse gas emissions (RCP8.5)
80
Sea level rise (cm)
60
40
20
0
10
20
30
40
50
60
70
80
90
00
20
20
20
20
20
20
20
20
20
21
100
Stringent mitigation (RCP2.6) and
Very high greenhouse gas emissions (RCP8.5)
80 RCP8.5
Sea level rise (cm)
60
RCP2.6
40
20
0
90
00
0
20
30
40
50
60
70
80
1
20
20
21
20
20
20
20
20
20
20
Data: IPCC, 2013
Figure 2.1 The most recent projections of global mean sea level rise by the
IPCC relative to 1986–2005. The green band represents the range for the
RCP2.6 scenario, and the purple band represents the range for the RCP8.5
scenario. In the top two graphs, the lines represent the median of the range.Chapter 2 – What lies ahead?
2.2 Natural variation in the height of the sea
The height of the sea around the coast naturally falls and rises as the tides ebb and
flow, and the weather changes.
20 High astronomical tides
Tides are controlled by the gravitational forces of the Moon and the Sun pulling
the Earth’s water towards them. How high the tide reaches varies over time, with
relatively high ‘spring tides’ occurring about every two weeks when the Earth, the
Sun, and the Moon are aligned.
King tides are particularly high spring tides that occur about twice a year when the
Earth, the Sun, and the Moon are aligned, and the Moon is closest to the Earth.
Storm surges
During a storm, high winds and low air pressure can combine to create a bulge in the
level of the sea that is driven on to the coast. Such storm surges can be thought of as
very long, slow waves.
In April 1968, Cyclone Giselle formed in the Coral Sea and began tracking toward
New Zealand where it was reinforced by a storm from the south. A storm surge of
88 centimetres was measured on the tide gauge in Tauranga Harbour – the largest
ever recorded in New Zealand. The waves reached 12 metres in Cook Strait and the
Wahine sank in Wellington Harbour (Figure 2.3).10
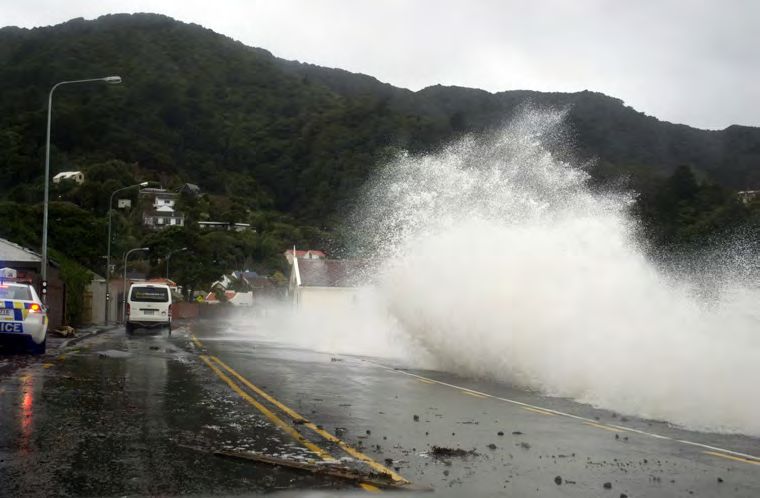
Waves
Winds travelling over the surface of the sea create waves. How high waves get
depends on the strength and duration of the wind, as well as the depth of the sea
and how far the waves have travelled. If unimpeded by land, a wave can travel
thousands of kilometres. Wellington’s south coast is sometimes pummelled by huge
swells that are generated by storms as far away as Antarctica (Figure 2.2).
As waves approach the land, they usually become smaller before they break and run
up the shore. During storms, waves can reach several metres above the high tide
mark along some coasts.
Long-term weather patterns
Long-term weather patterns can change the level of the sea over many years or
even decades. During an El Niño phase of the Southern Oscillation, the level of
the sea around New Zealand falls, and during a La Niña phase, it rises. Over longer
timescales, the Interdecadal Pacific Oscillation also affects sea levels around New
Zealand.11
Combined effect on sea levels
These natural causes of high sea levels can occur together, increasing their impact on
coasts. In January 2011, a storm surge and a high astronomical tide overwhelmed
stormwater systems and flooded parts of coastal Auckland.21
21
Source: Erik Winquist
Figure 2.2 Waves breaking on the south coast of Wellington near the
airport.
Source: New Zealand Herald
Figure 2.3 Air pressures over New Zealand on the day the Wahine
sank in April 1968.Chapter 2 – What lies ahead?
2.3 Changing rainfall, wind, and storms
In coming decades, weather patterns will continue to alter as the climate changes.
Some changes in weather will affect coastal areas and need to be thought about in
conjunction with sea level rise.
22
Rainfall
As the atmosphere warms, it can hold more moisture – about 7% for every 1°C
increase in temperature.12 As the climate changes, both the distribution of rainfall
across New Zealand and its intensity are projected to change.
Rainfall is projected to increase in the west of both islands and in the south of the
South Island. Northland and eastern regions of both islands are projected to become
drier.13 It is also projected that heavy downpours will become more extreme.14
Increases in the amount and intensity of rainfall in some catchments raise the risk of
river flooding. Areas close to river mouths can experience the ‘double whammy’ of
river flooding coinciding with the sea pushing its way upriver at high tide. As high
tides become higher because of sea level rise, such floods will become more likely.15
Winds
The duration and intensity of winds drives the power of waves. As circulation
patterns in the atmosphere change, westerly winds are projected to become more
prolonged and more intense in New Zealand, especially in winter.16
Increased winds would lead to larger waves breaking on the shores of the west coasts
of both islands.17
Storms
As the atmosphere becomes warmer, storm patterns are likely to change. Storm
surges ride on top of the sea and can be driven on to land by wind – their impact will
be increased by sea level rise.
It is projected that cyclones that form south of New Zealand in winter will become
more intense, leading to stronger winds and larger waves on shores exposed to the
south. It is also projected that the intensity of cyclones elsewhere in the country will
decrease.1823
2.4 Three types of coastal hazard
There are three types of coastal hazard in New Zealand that will be directly affected
by rising sea level.
Flooding occurs along coasts when the sea flows over low-lying land.
Erosion occurs when waves and currents eat away at ‘soft’ shorelines.
23
Groundwater can be affected in two ways – water tables can rise and freshwater can
become saline.
The next three chapters deal with each of these in turn.
There is another type of coastal hazard that will be affected by rising sea level –
tsunamis. A tsunami is formed when an earthquake or landslide under the sea
creates waves. The height of a tsunami when it reaches a shore can range from a
few centimetres to tens of metres, and largely depends on the size of the event that
caused it and the distance from its origin. Sea level rise will increase the height of
tsunamis. Tsunamis are rare and unpredictable. They are not discussed further in this
report.
Source: Anne Te Wake
Figure 2.4 Many marae and historical sites are located near the coast
on low-lying land. This photo shows Mātihetihe marae on the coast
north of Hokianga harbour. The hapū of Te Tao Mauī from Mitimiti
are working with NIWA to understand how sea level rise might affect
their marae.24
3
Coastal flooding

Coastal floods occur when the sea rises above the normal high tide level and flows
on to low-lying land.

Such floods range from ‘nuisance events’ to widespread costly inundation. Seawater
may flow on to a waterfront promenade relatively frequently, but only cause traffic
delays and inconvenience. Much more rarely, powerful storm surges can flood
homes, damage roads, and close businesses.

The first section of this chapter describes the factors that make particular areas of the
coastline vulnerable to flooding.

A rising sea will increase the frequency, the duration, and the extent of coastal
flooding in New Zealand. The second section contains the results of modelling that
shows how the frequency of extreme water levels will increase at four locations
around New Zealand.
Chapter 3 – Coastal flooding

     3.1 Vulnerability to coastal flooding

              Different factors affect how vulnerable a coastal area is to being flooded by the sea.19

              3
              Elevation and distance from the coast
26            Areas that are low-lying and close to the coast are generally most vulnerable to
              flooding.

              As floodwater spreads inland from the coast, it loses momentum. However, in some
              situations, storm surges can carry seawater a considerable distance inland.20

              Shape of the coast

              Open unsheltered coasts experience the full force of waves from storms, making
              them generally more vulnerable to flooding than enclosed bays and estuaries.

              However, water carried by a storm surge can be funnelled by the shoreline of a
              narrowing harbour or estuary. This happened during the January 2011 coastal flood
              in Auckland, when the sea rose another 30 centimetres as the storm surge flowed
              through the Waitemata Harbour.21

              Natural and built defences

              Defences against the power of the sea can be natural like sand dunes, gravel banks,
              wetlands, and cliffs, or built like seawalls, earthen dikes, and tidal barriers. These
              defences may themselves be undermined by high seas and storms – natural defences
              can erode and built defences can collapse.

              Natural defences can accrete as well as erode. The gravel bank on the beach along
              Marine Parade in Napier has grown over time as gravel carried down from the hills by
              the Tukituki River is carried by longshore currents and deposited on the beach.

              Stormwater pipes

              Stormwater pipes are designed to carry rainwater out to sea. However, if the sea is
              high enough to cover the pipe outlets, the rainwater can struggle to drain away. In
              some instances, seawater can run back up the pipes.

              Stormwater pipes can be fitted with flap valves to prevent seawater from entering the
              system. Maintenance is also important – sediment sometimes settles into pipes after
              storms, and flushing is required to clear them.

              Coastal floods often occur during storms, and stormwater systems sometimes cannot
              cope with both rainwater and seawater.
27
27
Source: Craig Thomson
Figure 3.1 In February 2015 a king tide caused minor flooding on
boardwalks in Howick, Auckland. As the sea rises such nuisance
flooding will occur every high tide in some places.
Source: Sam Gorham
Figure 3.2 Lowry Bay during the June 21st 2013 storm that saw many
roads flooded around Wellington Harbour. On this day the tide gauge
at the port recorded the highest sea level since records began in 1944.Chapter 3 – Coastal flooding
3.2 A rising sea will increase coastal flooding
The rise in sea level that has already occurred means that king tides, storm surges,
and waves now reach higher up shores than they used to. As the sea continues to rise
the frequency, duration, and extent of coastal flooding will increase.
3
In some cases, the rising sea will increase the duration and extent of river floods, like
28
the one that occurred in Whanganui in 2015. If such river floods peak at high tide,
they will become more damaging as high tides become higher.
Some projections of the increased frequency of extreme water levels were
commissioned for this report from NIWA and from an international expert, Dr John
Hunter from the Antarctic Climate & Ecosystems Cooperative Research Centre at the
University of Tasmania.22 These projections are based on the longest historic records
of sea levels in New Zealand, measured on tide gauges at the ports of Auckland,
Wellington, Christchurch (Lyttelton), and Dunedin.23
Table 3.1 shows when hourly recording of sea level began at each of the four ports
and on which days the sea reached its greatest heights – in relatively recent years.
Many Aucklanders will readily recall what happened in January 2011, and many
Wellingtonians will readily recall what happened in June 2013.24
Table 3.1 Sea level records at four New Zealand ports.
Year recording began Date of highest recorded level
Auckland 1903 23 January, 2011
Wellington 1944 21 June, 2013
Christchurch 1924 17 April, 1999
Dunedin 1899 15 June,1999
The results of the modelling are presented in Table 3.2 and Figure 3.3.25
For this report, it was decided to express these results in terms of exceedances of
high water levels that are currently expected to occur only once every hundred years
– today’s ‘100 year event’.26 As time goes on, such extreme levels will occur more and
more often.
In New Zealand, sea level is projected to rise by about 30 centimetres between 2015
and 2065.27
For a rise in sea level of 30 centimetres, such extreme high water levels would be
expected to occur about:
• Every 4 years at the port of Auckland
• Once a year at the port of Wellington
• Once a year at the port of Christchurch
• Every 2 years at the port of Dunedin.29
Table 3.2 Exceedances of today’s ‘100 year events’ occur more and
more often as the sea level rises.
29
SLR Auckland SLR Wellington
0cm Every 100 years 0cm Every 100 years
10cm Every 35 years 10cm Every 20 years
20cm Every 12 years 20cm Every 4 years
30cm Every 4 years 30cm Once a year
40cm Every 2 years 40cm Every 2 months
50cm Every 6 months 50cm Twice a month
60cm Every 2 months 60cm 3 times a week
70cm Every month 70cm Every tide
80cm Every week 80cm Every tide
90cm Twice a week 90cm Every tide
100cm Every day 100cm Every tide
SLR Christchurch SLR Dunedin
0cm Every 100 years 0cm Every 100 years
10cm Every 22 years 10cm Every 29 years
20cm Every 5 years 20cm Every 9 years
30cm Once a year 30cm Every two years
40cm Every 3 months 40cm Every 9 months
50cm Twice a month 50cm Every 3 months
60cm Twice a week 60cm Once a month
70cm Every day 70cm Once a week
80cm Every tide 80cm 4 times a week
90cm Every tide 90cm Every tide
100cm Every tide 100cm Every tideChapter 3 – Coastal flooding
Every year
Frequency of exceedance
30
Every two years
Every five years
Every 10 years
0 10 20 30 40
Sea level rise (cm)
Auckland Wellington Christchurch Dunedin
Data: Hunter, 2015
Figure 3.3 In the future, the tide gauges at the four ports will record
exceedances of today’s ‘100 year events’ more and more often.
The shape of all four lines in Figure 3.3 is critically important for understanding how
the frequency of coastal flooding will change in the future. All of the lines begin with
a relatively flat section and then rise increasingly steeply. There is a period of time
for each location before exceedances become common. But after this ‘grace period’,
exceedances rise very rapidly.28
As with all modelling, careful interpretation is essential. Some important points
include:
• The results show how often exceedances of the ‘100 year events’ are expected
to occur with sea level rise. They do not show the duration or extent of any
flooding that may occur from these exceedances.
• No change in either the frequency or size of storm surges has been assumed in
the modelling.
• Tide gauges do not measure wave height and waves are an important factor
in some coastal flooding. Because waves ride on top of the sea, the higher the
sea, the higher up the coast the waves will reach.
In assessing flooding risk from particularly high waters, local characteristics are
critical. For instance, the records used in the modelling are from tide gauges at ports
located in harbours that are more sheltered than coasts exposed to the open sea.31
Although the four lines shown in Figure 3.3 have the same shape, they rise at
different rates with Wellington at one extreme and Auckland at the other. By the
time the sea has risen about 70 centimetres higher than it is now, every high tide at
31
Wellington’s port is expected to be higher than today’s ‘100 year event’ level. But it
is not until the sea has risen over 100 centimetres that every high tide at Auckland’s
port is expected to be higher than today’s ‘100 year event’ level.29
This difference is due to the variation in high tide levels. High tide levels at Auckland’s
port vary over a wide range, so it takes a relatively large rise in sea level to push every
high tide over today’s ‘100 year event’ level. In contrast, there is little variation in high
tide levels at Wellington’s port.
3.3 In conclusion
Coastal cities and towns have been developed over time with a stable sea level in
mind. Buildings, roads, airports, wastewater systems and other infrastructure have
all been built based on an historical understanding of the reach of the tides and
occasional flooding during storms.
As the level of the sea continues to rise, areas of low-lying coastal land that currently
flood during storms or king tides will experience more frequent and severe flooding.
Areas a little higher will also begin to flood over time.
While the modelling results presented in this chapter do have limitations, they provide
some useful insights, including the following.
• Each of the lines in the graph in Figure 3.3 begins with a relatively flat section,
showing that there is some time for planning for the increased frequency of
flooding that will come. How much time depends on the particular location.
• It is certain that the frequency of coastal flooding will increase as sea level rises.
But the further ahead we look, the greater is the uncertainty in the modelling
results.
• The results of such modelling are best plotted against centimetres of sea level
rise. They can then be readily plotted against time for different IPCC scenarios.32
4
Coastal erosion

Coastal erosion occurs when waves eat away at the land causing the shoreline to
retreat. The sand and gravel stripped from a beach or cliff can be carried away by
ocean currents. They can then be deposited out at sea or on another beach, causing
it to build up – a process known as accretion.

The first section of this chapter describes the factors that make particular areas of the
coastline vulnerable to erosion.

A rising sea can speed up erosion along some parts of the coastline and trigger it in
others. This is illustrated with some examples from around the country in the second
section.

The third section is a summary of the main points in this chapter.
Chapter 4 – Coastal erosion

     4.1 Vulnerability to coastal erosion

              Different factors affect how vulnerable a shoreline is to being eroded by the sea,
34
              whether it be long-term recession of the coastline or short-term cycles of erosion and
              accretion.

              Coastal composition and shape

              Sandy beaches are constantly changing. Sand is light and easily suspended in water,
              allowing it to be readily moved around by waves and currents. In contrast, pebbles
              from gravel beaches tend to be tossed around by the breakers and dropped back on
              the beach, sometimes piling up to form steep terraces. In New Zealand, mixed sand
              and gravel beaches are common.

              Unlike beaches, cliffs can only erode – there is no natural process to build them up
              again. The composition of cliffs is important – cliffs made of silt or soft rock, for
              instance, are prone to erosion.

              As for coastal flooding, erosion is more likely to happen on open coasts that bear the
              brunt of storm surges and larger waves, than on naturally sheltered coastlines, such
              as harbours or estuaries.

              Size and shape of waves

              Episodes of erosion often occur during storms. Storm surges take waves high up
              beaches, and strong winds generate large steep waves that can remove sand and
              deposit it on the seabed just offshore.30 In calm weather, smaller flatter waves tend to
              deposit sand on to shores, helping beaches to accrete.

              For a shoreline to be stable, stormy periods with large eroding waves must be
              balanced by long periods with smaller accreting waves. Significant erosion often
              occurs if there is a series of storms over a short period of time.

              The balance between erosion and accretion can change over time when the size and
              direction of waves is influenced by weather cycles. In the upper North Island, beaches
              on the east coast tend to erode during a La Niña, while west coast beaches tend to
              erode during an El Niño.31
35 Sediment availability Sediment – which includes both sand and gravel – naturally moves around the coast. 35 Longshore currents run parallel to the shore and can carry sediment away. But those same currents may also bring sediment into the vicinity of a beach, allowing waves to deposit it on the shore. Most of this sediment comes from erosion inland and has been carried down rivers to the sea. The supply of sediment varies over time and is influenced by many factors including storms, earthquakes, deforestation, dams, and changes in river flow. Coastal scientists use the term ‘sediment budget’ to refer to the balance between the sediment that is removed from and the sediment that is added to different sections of coastlines and rivers. A deficit will generally lead to net erosion and a surplus will generally lead to net accretion – rather like a bank account. Built defences Different kinds of structures, such as seawalls, can be built to prevent or slow coastal erosion. Piling up large rocks against vulnerable shores is known as ‘rock amouring’ or ‘rip- rap’. The road that runs between Wellington airport and the sea is protected in this way. While this approach may protect the land behind, sand in front of the rocks can be stripped away. Groynes are barriers running out from the shore that can capture sediment as it is carried along by longshore currents. While groynes can protect a beach from erosion, they can also cut off the sediment supply to neighbouring beaches. Built structures can also drive localised accretion. Caroline Bay in Timaru has changed markedly since 1878, when a breakwater was constructed to protect the harbour from southerly swells. Thousands of cubic metres of sand have since accumulated on the beach, and the shoreline has advanced hundreds of metres. However, nearby stretches of the coast have experienced accelerated rates of erosion due to the disruption of their sediment supply.32
Chapter 4 – Coastal erosion

     4.2 A rising sea will increase coastal erosion

              As the sea rises, erosion will increase in many places around the coast.

              High-energy storm waves will rush further up beaches and reach higher up soft cliffs.
              Thus, beaches and cliffs that are prone to erosion are likely to erode faster.

36            Stable beaches may also begin to erode, and beaches that are accreting may accrete
              more slowly or begin to erode.

              Waihi Beach on the east coast of the Coromandel, Haumoana in Hawke’s Bay, and
              Beach Road south of Oamaru are three places where coastal erosion is clearly evident,
              and almost certain to increase as the sea continues to rise.

              In places where the shoreline is advancing seaward, it may be many years before
              the sea rises enough to overcome the processes driving the accretion. The sediment
              supply is critical. Eastbourne in Wellington has changed from a retreating sandy beach
              to an advancing gravel beach, although the sea has been rising for a hundred years or
              so.33

                                                                Source: Western Bay of Plenty District Council

              Figure 4.1 Waihi Beach is subject to episodes of erosion when storms
              gouge sand out of the dunes.
37
37
Source: Parliamentary Commissioner for the Environment archives
Figure 4.2 At Haumoana in Hawke’s Bay, the land subsided about 70
centimetres during the 1931 earthquake. The earthquake also altered
the sediment supply coming down nearby rivers. Since then the
shoreline at Haumoana has moved about 40 metres inland.34
Source: Fairfax NZ
Figure 4.3 Beach Road south of Oamaru runs along the top of soft
cliffs which have been eroding for thousands of years.35 Soft cliffs do
not undergo periods of erosion and accretion – they only erode.Chapter 4 – Coastal erosion
4.3 In conclusion
Erosion (and accretion) around much of the coastline of New Zealand is a natural
38
process that has been happening for thousands of years.
Councils have long been dealing with some of the consequences of erosion.
Carparks, access ramps, and other public amenities have been relocated, and sections
of some roads have been lost. Breakwaters and groynes have been built as defences
and the odd building has fallen into the sea.
As the sea rises, cycles of erosion and accretion on beaches will change. The net
effect of a higher sea will generally be increased erosion because the high-energy
waves that strip sediment will reach further up shores.
As with coastal flooding, generalisations can be misleading. But when it comes to
soft seaside cliffs that are already eroding, it is possible to generalise with reasonable
confidence – the rate of erosion along such shorelines will increase.5 Coastal groundwater Groundwater sits in the spaces between soil and sediment particles, and within rock fractures. In many parts of the country, groundwater is used as a key source of water for drinking, industry, and agriculture. Most groundwater extracted in New Zealand is taken from coastal aquifers.36 When flooding and erosion occur along the coast, the impact is evident. But groundwater problems are not generally visible and are difficult to measure. Some issues associated with coastal groundwater can be expected to become more significant as the sea rises. In some places, the groundwater will rise as the sea rises. The first section of this chapter describes the problems caused by high groundwater. Another consequence of rising sea level will be more seawater moving into coastal aquifers. The second section of this chapter describes why saltwater intrusion occurs and why rising sea level could reduce the availability of freshwater in some places.
Chapter 5 – Coastal groundwater

     5.1 High groundwater

             In some coastal areas, the water table is not far below the ground and is connected
             to the sea. As the level of the sea rises, the water table will rise in these areas.37

             High groundwater causes a number of problems.

40              •    Boggy ground and surface ponding.

                •    Damage to infrastructure and buildings.

                •    Saturated soil raising the risk of liquefaction in earthquakes.

             Areas of land reclaimed from the sea are especially likely to experience problems
             caused by high groundwater.

             South Dunedin is an area where such problems were clearly evident when prolonged
             heavy rainfall in June 2015 led to extensive flooding because the rainwater could not
             drain away. Much of South Dunedin is built on what was once a low-lying coastal
             wetland, and the water table is close to the surface, with many direct underground
             connections to the sea.38 The water table rises and falls with the tides – in some
             places, builders know to wait for the tide to go out before excavating.

             As the level of the sea rises, the water table in South Dunedin – and in some other
             coastal areas in New Zealand – will be affected.39 A rising water table will lead to
             surface ponding in some places and more extensive flooding after heavy rain. It
             will also damage roads, pipes, and cables, as well as the foundations of buildings,
             particularly if the groundwater becomes saline.

             A coastal aquifer does not have to be directly connected to the sea to be influenced
             by sea level rise. Where an aquifer extends out under the sea, changes in the weight
             of the water above it can increase the pressure on the aquifer, forcing the water table
             closer to the surface.

             High groundwater can also increase the damage caused by earthquakes. When
             unconsolidated soils that are saturated with water are shaken in an earthquake, the
             soil can behave like a liquid. The citizens of Christchurch are all too familiar with the
             phenomenon of liquefaction.

             Areas of reclaimed land are particularly prone to liquefaction. Because rising sea
             level will generally push up groundwater in these areas, the risk of liquefaction will
             increase.40
41
41
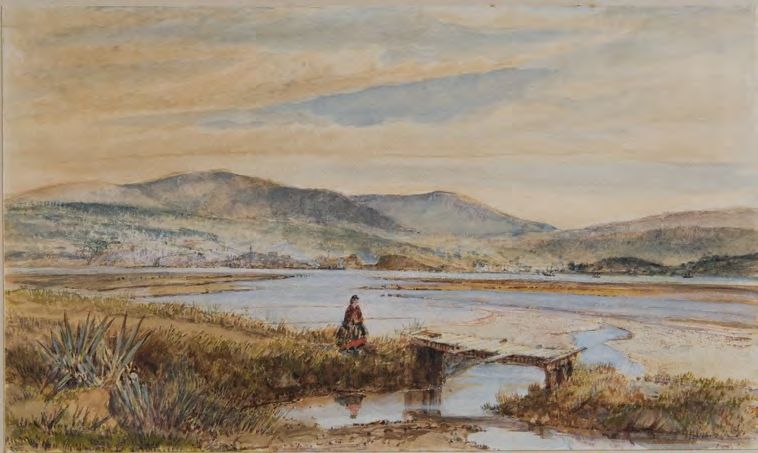
Source: Hocken Collection, University of Otago
Figure 5.1 In 1864, artist Andrew Hamilton painted ‘Dunedin from the
track to Andersons Bay’. Much of South Dunedin is built on what was
once a marshland of lagoons, rushes, and tussock.
Source: Otago Daily Times
Figure 5.2 Heavy rainfall caused flooding and damage in Dunedin
in June 2015 when the stormwater system could not cope with the
deluge.Chapter 5 – Coastal groundwater
5.2 Saltwater intrusion
Sea level rise also increases the potential for saltwater to enter freshwater aquifers.
Coastal aquifers can become contaminated with saltwater when freshwater is
extracted at a rate faster than it is replenished. This seems to be a relatively minor
problem in New Zealand.
42
The Waiwhetu Aquifer supplies more than a third of Wellington’s water demand.
This coastal aquifer extends off the Petone foreshore, and so the risk of saltwater
intrusion must be actively managed. Sea level rise is expected to reduce the amount
of freshwater that can be extracted from this aquifer.41
The Hawke’s Bay iwi Ngāti Kahungunu is concerned about the potential for sea level
rise to adversely affect the Heretaunga Aquifer. Groundwater scientists from GNS
Science are investigating.
Low-lying Pacific atolls are especially vulnerable to flooding and salinisation of
groundwater as the sea rises. Such atolls are porous so rainwater seeps directly
through to the freshwater layer that floats on the seawater below the ground. On
some of these islands, the freshwater has become brackish. One cause of this is
waves overtopping and washing over the shores, and this will occur more frequently
as the sea rises.42
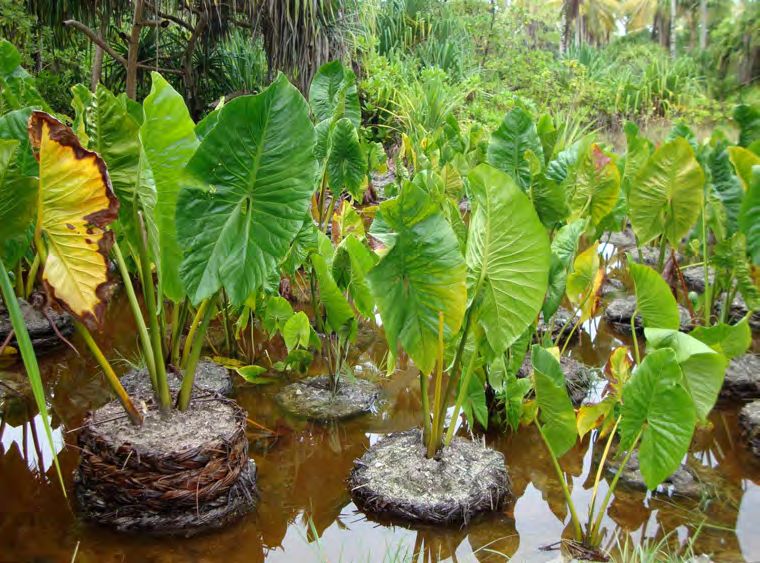
Source: Wikimedia Commons (CC BY-SA 3.0)
Figure 5.3 Giant swamp taro is one of the crops being affected by
increasingly saline groundwater.43
5.3 In conclusion
Interactions between groundwater and seawater are highly localised and complex,
and it is uncertain how groundwater in many places will respond as the sea rises.
Predicting impacts on aquifers is made particularly difficult by the ‘invisibility’ of
groundwater and a scarcity of information.
43
Those places where groundwater is linked directly to the sea are most likely to be
affected.
This is particularly the case for groundwater beneath land that has been reclaimed
from the sea. After heavy rain in South Dunedin in June this year, the problems that
can be caused by a high water table were all too evident with flooded properties and
damaged roads. A rising sea will slowly push the water table higher in South Dunedin
and some other coastal areas.
Another potential consequence of sea level rise is increasing saltwater intrusion into
coastal aquifers that are used as water sources. Saltwater intrusion is already causing
serious problems for some of New Zealand’s Pacific neighbours.44
6
Low-lying and close to the coast

Areas that are both low-lying and close to the coast are, in general, most vulnerable
to sea level rise. This is certainly the case when it comes to coastal flooding and rising
groundwater. Erosion is rather different – a shoreline need not be low-lying to be
eroded.

This chapter contains a number of maps showing areas in New Zealand that are both
low-lying and close to the coast. Such maps are a necessary early step in assessing
what is at risk as the sea rises. But, as has been emphasised in earlier chapters, local
characteristics are also vitally important. For instance, a low-lying area close to the
coast may be protected by a headland or a natural barrier such as a sand dune. And
groundwater will only be a problem if it is connected to the sea.

The first section of this chapter describes how elevation above sea level can be
measured accurately using a technology known as Light Detection and Ranging
(LiDAR). During this investigation, NIWA was commissioned to convert the available
LiDAR data into a standardised form. Once this was done, NIWA used RiskScape
software to estimate how much of the built environment is at risk from sea level
rise.43

The second section contains maps showing low-lying coastal areas in four cities –
Auckland, Wellington, Christchurch and Dunedin. These four cities were chosen to
provide a link with the modelling results in Chapter 3. Each map is accompanied by a
short commentary that contains some RiskScape data. The purpose in this chapter is
to give a sense of the information that is now readily available.

The impact of sea level rise will be felt in many other areas outside of these four
major cities. Maps of these and other coastal areas have also been prepared in the
course of this investigation, and are available at www.pce.parliament.nz. The third
section contains commentaries on five other cities and towns that have significant
areas of low-lying coastal land – Napier, Whakatane, Tauranga, Motueka, and Nelson.
You can also read