Current Status, Projected Trends, Potential Casualties, and Our Ability to - Environmental Assessments
←
→
Page content transcription
If your browser does not render page correctly, please read the page content below
(A40264)

     Current Status,

Projected Trends, Potential

   Casualties, and Our Ability to

       Respond: A Briefing Report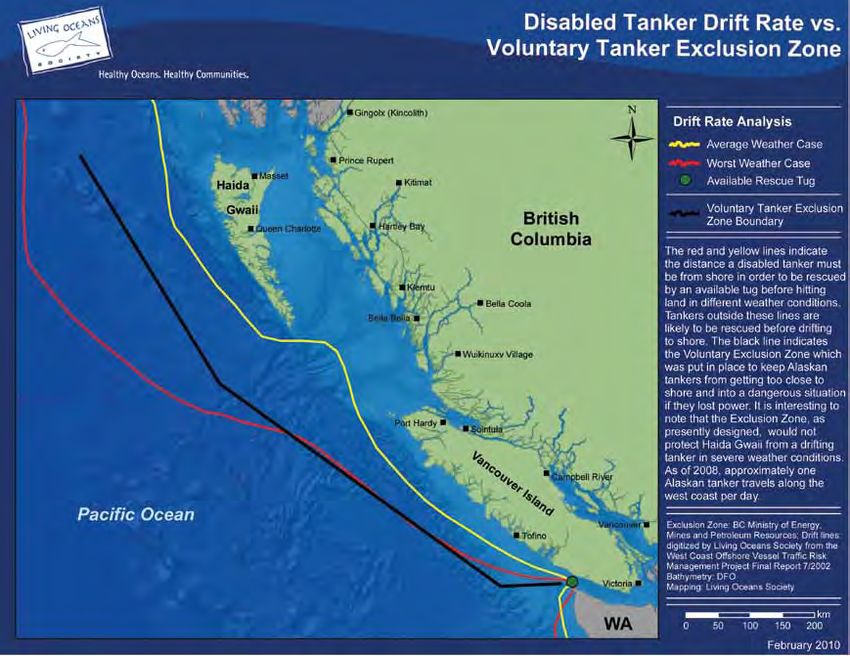
shipping on the british columbia coast                                                                                                   (A40264)

                                         Living Oceans Society
                                         Box 320 Sointula, BC V0N 3E0
               2                         Canada
                                         250 973 6580
                                         info@livingoceans.org
                                         www.livingoceans.org

                                         © 2011 Living Oceans Society

                                         L iving Oceans Society. (2011). Shipping on the British Columbia Coast. Current Status, Projected Trends,
                                          Potential Casualties, and Our Ability to Respond: A Briefing Report. Sointula, BC: Living Oceans Society.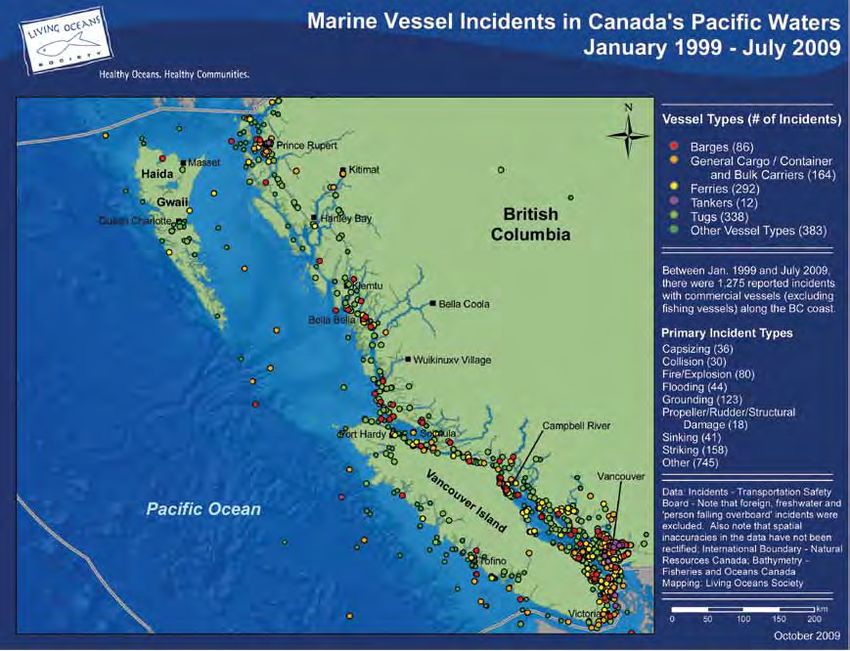
(A40264)

        Contents
List of Acronyms  . . . . . . . . . . . . . . . . . . . . . . . . 4          4.2      From Vessel Casualty  . . . . . . . . . . . . 27
Living Oceans Society . . . . . . . . . . . . . . . . . . . . 5          5 Marine Vessel Casualty Risk and
Acknowledgements . . . . . . . . . . . . . . . . . . . . . . 6             Emergency Response Preparedness . . . . . . 29

Introduction  . . . . . . . . . . . . . . . . . . . . . . . . . . . 7        5.1      Marine Vessel Casualty Risk . . . . . . . 29

1 Shipping on the B.C. Coast:                                                5.2      Canada’s Oil Spill Response Regime 30
  Current Status and Trends . . . . . . . . . . . . . . . 9                  5.3	Limitations to Canada’s Oil Spill
    1.1      Vessel Sectors and Vessel Types . . . . . 9                          Preparedness and Response Regime 31

    1.2      Marine Traffic Activity  . . . . . . . . . . . 11               5.4      Oil Spill Funding and Financial
                                                                                      Vulnerability . . . . . . . . . . . . . . . . . . . 34
    1.2.1 Trans-Alaska Pipeline System
          (TAPS) Oil Tankers . . . . . . . . . . . . . . 13              6 Solutions and
                                                                           Policy Directions  . . . . . . . . . . . . . . . . . . . . 37
    1.3      Projected Trends  . . . . . . . . . . . . . . . 13
                                                                         7 Maps  . . . . . . . . . . . . . . . . . . . . . . . . . . . . . 41
    1.4      Case Study—Enbridge’s Northern
             Gateway Project . . . . . . . . . . . . . . . . 16          8	Glossary of Terms . . . . . . . . . . . . . . . . . . . . 47

2	Shipping Legislation and Regulation  . . . . . 19                     9	References  . . . . . . . . . . . . . . . . . . . . . . . . . 51

    2.1      Legislation  . . . . . . . . . . . . . . . . . . . . 19     Appendix A: Marine Vessel Incidents
                                                                                 and Casualties along the
    2.2      Regulatory Measures . . . . . . . . . . . . 20                      Pacific Coast . . . . . . . . . . . . . . . . . . . 55
    2.2      Double vs. Single Hulled Vessels  . . . 20                  Appendix B:The World’s Largest Oil
    2.3      Voluntary Tanker Exclusion Zone  . . 20                             Spills and Global Oil Spill Trends . . . 59
    2.4      Accountability . . . . . . . . . . . . . . . . . 21         Appendix C: Spill Cost Summary of
3 Types and Causes of Marine                                                     Selected Oil Spill Incidents,
  Vessel Casualties . . . . . . . . . . . . . . . . . . . . . 23                 1984-2000  . . . . . . . . . . . . . . . . . . . . 63

    3.1.Types of Marine Vessel Casualties . . . . . 23                   Appendix D: Living Oceans Society’s
                                                                                 Oil Spill Model . . . . . . . . . . . . . . . . . 65
    3.2      Causes of Marine Vessel Casualties  . 23
4 Environmental Impacts . . . . . . . . . . . . . . . . 25
    4.1.     From Normal Operations . . . . . . . . . 25

                                                                        shipping on the british columbia coast                                  3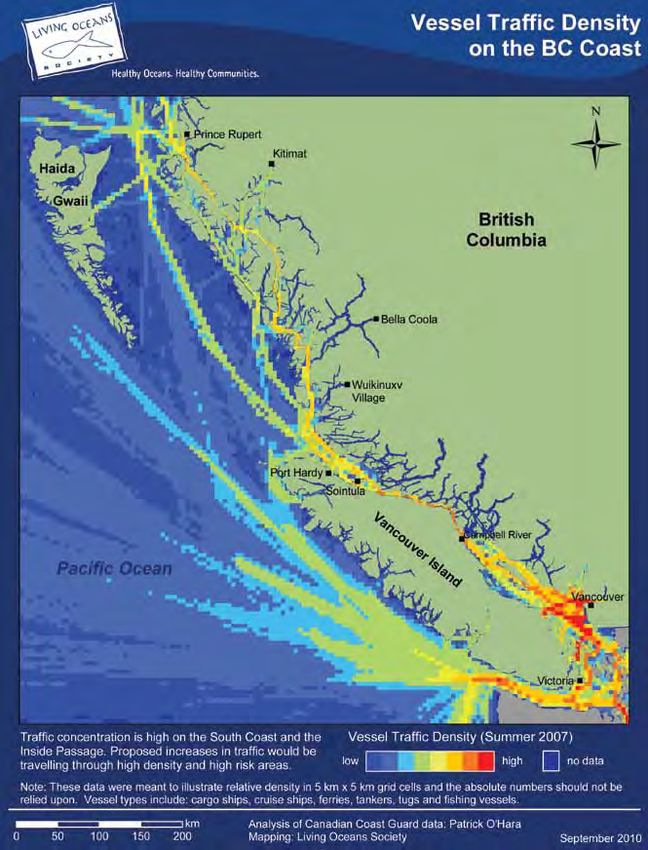
shipping on the british columbia coast (A40264)
Figures, Tables, Maps
Tables Figures
Table 1 Major Vessels that Frequent B.C.’s Figure 1 Proposed Pipeline and Tanker
4 Coastal and Territorial Waters . . . . . 9 Routes for Enbridge Northern
Table 2 Oil Tanker Specifications . . . . . . . . 11 Gateway Project . . . . . . . . . . . . . . . 17
Table 3 Annual Vessel Movements4 by Figure 2 Causes of Oil Spills in Excess
Vessel Type on the B.C. Coast of 700 tonnes2 . . . . . . . . . . . . . . . . 24
from 1996/97 to 2003/04 . . . . . . . 11 Figure B1 Location of Major Oil Spills
Table 4 Traffic Patterns and Routes for Since 1967 . . . . . . . . . . . . . . . . . . . 60
Major Vessels in B.C. Waters . . . . . . 12 Figure B2 Annual Quantities of Oil Spilled
Table 5 Summary of Projected Major Worldwide (From Spills Over 7
Vessel Traffic Volumes Based Tonnes) Including Major
on West Coast Industrial Accidents Between 1970-2009 . . . 61
Projects . . . . . . . . . . . . . . . . . . . . . 15 Figure C1 Winter oil spill at Ness Rock,
Table 6 Weaknesses to Canada’s Oil Spill from Living Oceans Society’s
Preparedness and Response Oil Spill Model . . . . . . . . . . . . . . . . 65
Regime . . . . . . . . . . . . . . . . . . . . . . 32 Maps
Table A1 Twenty Years of Notable Major Map 1 Vessel Traffic Density on the
Marine Vessel Incidents along the BC Coast . . . . . . . . . . . . . . . . . . . . . 42
Pacific West Coast . . . . . . . . . . . . . 55 Map 2 Traffic Routes and Port
Table B1 World’s Ten Largest Ship-Source Locations for Major Vessls in
Oil Spills since 1967 . . . . . . . . . . . . 59 BC Waters . . . . . . . . . . . . . . . . . . . . 43
Table C1 Costs of Selected Oil Spills in the Map 3 Disabled Tankers Drift Rate vs.
U.S., 1984-2000 . . . . . . . . . . . . . . . 63 Voluntary Tanker Exclusion Zone . 44
Map 4 Marine Vessle Incidents in
Canada’s Pacific Waters:
January 1999 - July 2009 . . . . . . . . 45
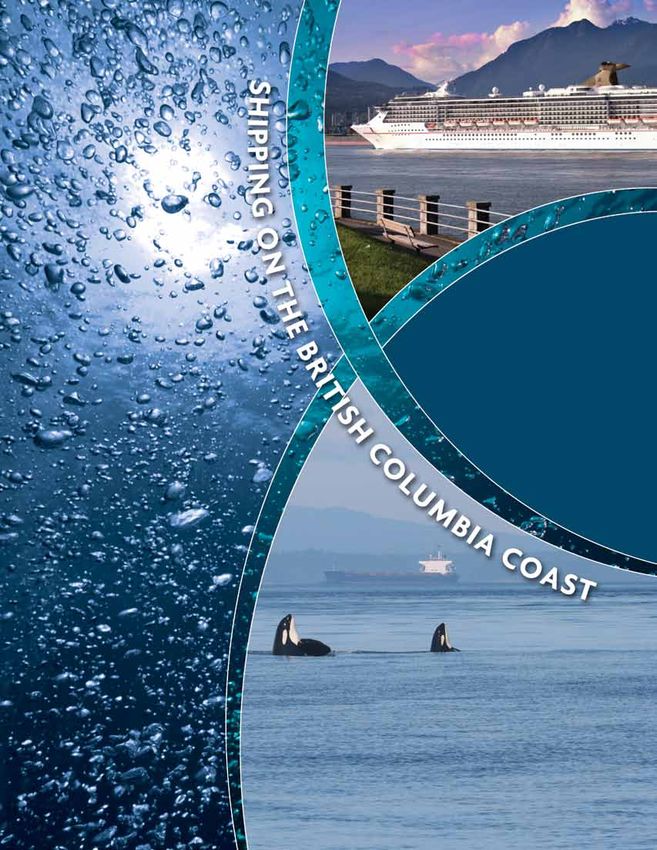
Cover images: cruise ship ~ James Church.Tanker and orcas ~ Scott Veirs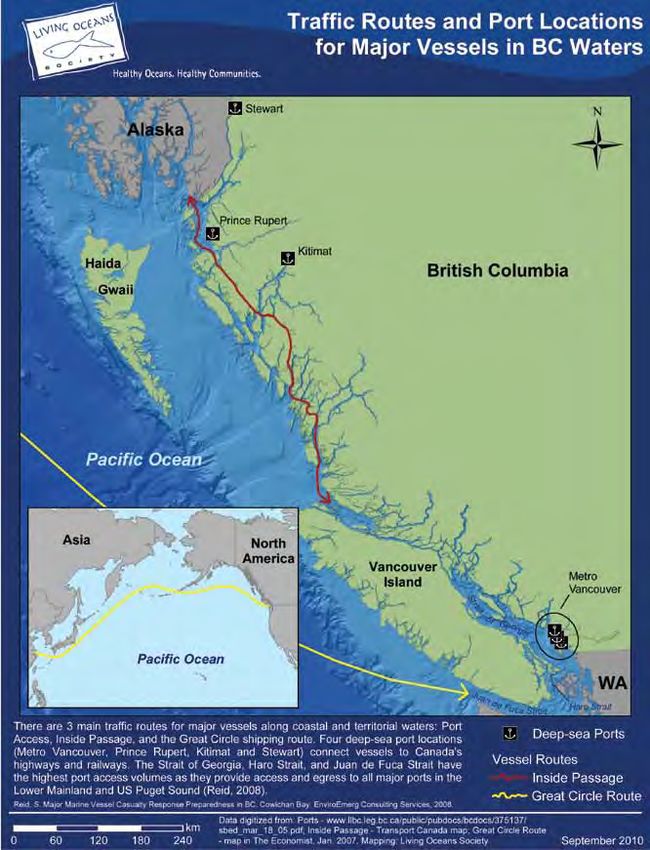
(A40264)

     List of Acronyms
bbl barrel                                      MoE Ministry of the Environment
B.C. British Columbia                           NEB National Energy Board
bpd barrels per day                             nm nautical mile
CCG Canadian Coast Guard                        PNCIMA Pacific North Coast Integrated Manage-
CEAA Canadian Environmental Assessment             ment Area
   Agency                                       RO Response Organization
DWT deadweight ton                              RO-RO Roll-on/Roll-off vessel
FMO Federal Monitoring Officer                  RP Responsible Party
GRP Geographic Response Plan                    SDR Special Drawing Rights
GT Gross Tonnage                                SOPF Ship-Source Oil Pollution Fund
HFO heavy fuel oil                              TAPS Trans-Alaska Pipeline System
IMO International Maritime Organization         TBT tributylin
km kilometre                                    TEZ Tanker Exclusion Zone
LNG liquid natural gas                          TEU Twenty-foot Equivalent Unit
m3 cubic metres                                 ULCC Ultra Large Crude Carrier
MARPOL International Convention for the Pre-    U.S. United States
   vention of Pollution from Ships              VLCC Very Large Crude Carrier

                                               shipping on the british columbia coast         5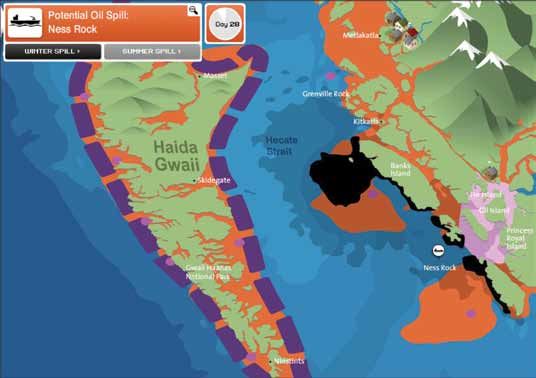
(A40264)

                                         6
shipping on the british columbia coast
(A40264)
Living Oceans Society
L
iving Oceans Society is Canada’s largest or- the fish—it’s about the fish and the people. Living
ganization focusing exclusively on marine Oceans Society believes that people are part of the
conservation issues. We are based in Sointu- environment and that by protecting B.C.’s coastal
la—a small fishing village on the Central Coast of ecosystem we can build sustainable communities
British Columbia. today and for our children.
Living in a coastal community, we are re- For information about Living Oceans Society
minded each day that our work is not just about please visit: www.livingoceans.org.
shipping on the british columbia coast 7shipping on the british columbia coast (A40264)
Acknowledgements
W
8 e would like to thank the following Living Oceans Society would also like to thank
foundations. Without their contribu- the following people for their contributions:
tions, this briefing report would not Emma Point, Stafford Reid, Arthur Caldicott, Mia
have been possible. Gardiner and Rick Steiner.
We gratefully acknowledge the support of the
Tar Sands Campaign Fund of Tides Foundation for
this publication.
C Tides Foundation cmyk.pdf 1 12/20/10 10:27 AM
M
Y
CM
MY
CY
CMY
K(A40264)
Introduction
Transportation by water is an efficient and Numerous technical and operational weak-
economical way to move goods and people. In nesses exist within Canada’s and B.C.’s emergency
general, vessels that travel through the coastal preparedness and response strategy for marine
waters of British Columbia (B.C.) are well man- vessel casualties, including oil spills. In the past,
aged and the shipping system works well under improvements to shipping practices, regulations
Canada’s Shipping Act and conventions of the and emergency response procedures have come
International Maritime Organization (IMO). in the wake of large scale environmental disasters,
However, recent events on the B.C. coast, such as such as the 1989 Exxon Valdez oil spill in Alaska.
the Westwood Anette oil spill in Howe Sound, the Living Oceans Society does not want to wait
sinking of the Queen of the North ferry, and the for an accident on the B.C. coast to occur before
barge spill in Robson Bight, serve to remind us of improvements are made to Canada’s marine vessel
the negative consequences of shipping. casualty emergency response plan. It is imperative
As vessel traffic volumes increase, so does the that government and stakeholders take actions
potential for a shipping accident. Between 1999 now to:
and 2009 there were over 1,200 reported marine
vessel incidents along the B.C. coast. Over the Legislate a permanent ban on oil tanker
next 15 years, container ship volumes through traffic in Dixon Entrance, Hecate Strait and
coastal waters are predicted to increase by 300 Queen Charlotte Sound;
percent. The number of bulk cargo vessels over Manage B.C.’s shipping industry with an
that time will grow by 25 percent and cruise ecosystem-based approach that ensures
ship traffic is expected to increase by at least 20 safe shipping practices, prioritizes the
percent. There are also several project proposals health of the ocean, and considers other
in place that would bring supertankers to the sectors of economic activity; and
North and Central Coast for the first time. The Improve Canada’s and B.C.’s rescue and re-
preservation of the coast from shipping related sponse capabilities for oil spills and other
accidents and oil spills is of utmost importance to vessel casualties.
coastal ecosystems and communities, as well as
This briefing report was written with the
B.C.’s resource-dependent economy.
intent to provide a summary of current and pro-
posed shipping-related activities on the B.C. coast.
shipping on the british columbia coast 9shipping on the british columbia coast (A40264)
It aims to familiarize the reader with the impacts Through examination of the technical and institu-
of shipping on the marine environment, as well tional gaps in Canada’s oil spill response regime,
as the risk and associated outcomes of major we have identified a number of possible solutions
marine vessel casualties. The report also explores and policy directions to encourage the best pos-
Canada’s—and B.C.’s—emergency response sible shipping and emergency response practices
preparedness for a major marine vessel casualty. for our coast.
10(A40264)
1 Shipping on the B.C. Coast:
Current Status and Trends
1.1
Vessel Sectors and Vessel Types
Canada’s marine industry is comprised of their services.These vessels are commonly referred
domestic and international vessels. Domestic ves- to as “convention vessels” and include tankers, con-
sels are typically Canadian owned and operated tainer, bulk carrier, general cargo and cruise ships
ships such as ferries, fishing boats and barges. (Reid, 2008). Specifications for various oil tanker
Alternately, international vessels are major sea- classes are found in Table 2.
going ships chartered by companies that need
Table 1
Major Vessels that Frequent B.C.’s Coastal and Territorial Waters
Oil Tankers Chemical Tankers
Oil tankers are self-propelled tank vessels used for Chemical tankers are designed to transport chemicals in
the transport of bulk crude oil and refined petroleum bulk, in separated and protected compartments. Most
products. Tankers range in size from less than 50,000 modern chemical tankers are constructed with a double
hull. The Port of Vancouver is the primary location for
deadweight tons (DWT) to 300,000 DWT or more.
chemical tankers in B.C. to on- and off-load cargo. Globally,
The largest of tankers (“supertankers”) can transport chemical tanker accidents are rare, with most incidents
between 2 and 3 million barrels [320,000 - 480,000 occurring at terminals.
cubic metres(m3)] of oil as cargo. In addition to
cargo, tankers carry fuel to power their own systems
Liquid Natural Gas (LNG) Tankers
and engines. Known as bunker fuel, tankers carry
between 2,000 and 8,000 m3 of fuel for this purpose. Liquid Natural Gas (LNG) tankers are designed to transport
Because of their huge mass, tankers are very difficult liquid natural gas in bulk. Most LNG tankers are double
hulled and have either spherical or box-shaped protrusions
to steer and stop. A loaded supertanker can take
above deck. If LNG is released, it converts to a gaseous
long as 15 minutes (and 3 km) to come to a full stop, state and is highly explosive if ignited. At present time, no
and has a turning diameter of 2 km. The first tankers LNG tankers enter Canada’s Pacific waters, but proposals
were generally single-hulled, but a global phasing for LNG terminals and gasification plants in northern and
out of single-hulled vessels was scheduled for 2010. southern B.C. threaten to bring theses tankers to the coast.
continued...
shipping on the british columbia coast 11shipping on the british columbia coast (A40264)
Major Vessels that Frequent B.C.’s Coastal and Territorial Waters (continued)
Bulk Carriers barge’s cargo that can pose an environmental risk as
Bulk carriers, or “bulkers”, carry cargo such as coal, opposed to the barge itself. For instance, a large oil barge
grain, and cement in bulk and range from 10,000 can carry up to 30,000 barrels (4,800 m3) of petroleum.
to over 200,000 DWT. Bulkers are vulnerable to Other dangerous goods such as paints, solvents, industrial
cargo shifting which can cause a ship to capsize. chemicals, and biocides are also commonly transported
Bulkers carry a substantial amount of bunker fuel to on barges.
operate their engines. The outer hull of bulk carriers
typically serve as part of the vessel’s fuel tank, which Ferries
can rupture in the event of a collision or grounding,
releasing fuel into surrounding waters.1 Ferries are vessels that carry passengers and their vehicles.
Ferries vary in size and design depending on the length of
their route, water conditions and required capacity. Most
General Cargo Vessels ferries in B.C. are double-ended vessels and can shuttle
General cargo vessels, or “break-bulk” vessels, carry between terminals without turning around. B.C. Ferries
non-containerized or piece-handled cargo such as boasts three of the largest double-ended ferries in the
wood, construction materials and bagged products. world, known as “Super C-class” ferries.
General cargo vessels are smaller than bulk carriers
and are approximately 50,000 DWT. Like bulk Roll-on/Roll-off (RO-RO) Vessels
carriers, break-bulks carry a substantial amount of
bunker fuel to operate their engines. Also similar to RO-RO vessels are designed to carry wheeled cargo such
12
bulk carriers, the outer hulls of break-bulks serve as as cars, trucks and railcars. RO-RO vessels include ferries,
part of the fuel tank.1 barges, cruise and cargo ships. Large RO-RO vessels transit
the outer coast of B.C. transporting vehicles from the
southern U.S. to Alaska, and from Asian countries to
Container Vessels North America via the Great Circle route.
Container vessels carry their load in truck or railcar-
sized containers which can be loaded onto these Cruise Ships
vehicles at port for further land-based transport.
Large container vessels can carry extremely heavy Cruise ships are passenger vessels used for pleasure
loads, as much as 300,000 DWT. Containers can voyages. Typical cruise ships that traverse B.C.’s Inside
capsize if loaded poorly. A loss of containers at sea Passage range from 50,000 – 90,000 Gross Tonnage (GT)
poses a real threat to other vessels and can become and can carry between 700 to more than 3,000 passengers.
a substantial source of marine pollution. Like bulk Cruise ships carry substantial volumes of bunker fuel and
carriers and general cargo vessels, the outer hulls thus pose an oil spill risk in the event of a vessel casualty.
of container ships serve as part of the fuel tank Other environmental concerns relate to discharges of a
which could rupture and release fuel in the event of cruise ship’s waste streams which have the potential to
collision or grounding.1 threaten human health and damage aquatic life if not
treated properly (Hall, 2008).
Barges
Barges are not self-propelled but rather are pulled
or pushed by tug or tow boats. In general, it is a Source: Reid, 2008 (unless otherwise noted)(A40264)
Table 2
Oil Tanker Specifications
Tanker Class Deadweight Tons Length Average Capacity
(DWT) (Meters) (Barrels)
Oil barge n/a up to 112 10,000-65,000
Coastal/Handysize up to 50,000 205 300,0002
Panamax up to 80,000 230 500,0002
Aframax3 80,000-120,000 245 700,000
Suezmax 120,000-200,000 285 1,000,000
Very Large Crude Carrier (VLCC) 200,000-300,000 350 2,000,000
Ultra Large Crude Carrier (ULCC) 300,000-550,000 415 3,000,000
Source: Reid, 2008; Island Tug & Barge Ltd. 2007
1.2
Marine Traffic Activity
Table 3 displays vessel movements by vessel but proposed shipping and terminal expansions at
type on the B.C. coast from 1996/7 to 2003/4. the ports of Kitimat, Stewart and Prince Rupert are
Map 1 illustrates vessel traffic densities on the B.C. expected to substantially increase vessel traffic on
coast in 2007.The greatest concentration of vessel the North and Central Coast (Section 2.3.1).
traffic is in southern B.C. (MoE, 2006; Hall, 2008),
Table 3
Annual Vessel Movements4 by Vessel Type on the B.C. Coast from 1996/97 to 2003/04
Vessel type Vessel Description Average Number of Vessel Percent of Total
Movements/Year
Passenger Ferries and cruise ships 229,095 56
Tugs Towing or propelling barges 117,319 29
Cargo Bulk cargoes such as cars, grain, ore, etc. 29,253 7
Fishing Catching, processing or transporting fish 11,078 3
under the Fisheries Act
Tankers Carrying liquid cargo (primarily oil) 2,739shipping on the british columbia coast (A40264)
Table 4 describes the main traffic patterns and rial waters. Map 2 illustrates these traffic routes as
routes for major vessels along coastal and territo- well as the locations of deep sea ports in B.C.
Table 4
Traffic Patterns and Routes for Major Vessels in B.C. Waters
Traffic Pattern/Route Description
Port Access There are four deep-sea port locations in B.C. connected to Canada’s continental highways and railways:
Lower Mainland5, Prince Rupert, Kitimat, and Stewart. The port system in B.C. handles 85 percent of the
western provinces’ marine exports of grain, coal, forest products, petroleum and petrochemicals. The Port
of Vancouver is North America’s largest port by tonnage (Government of B.C., 2005). In 2005, the Port of
Vancouver, Fraser River Port (now amalgamated), and the Port of Prince Rupert account for more than 95
percent of the international trade moving through the B.C. port system (B.C. Government, 2005). Throughput
of dry and liquid bulk, container shipments and cruise ship passengers at these ports are projected to increase.
Inside Passage The Inside Passage route has almost constant vessel traffic. It is used primarily by Alaska-bound cruise ships,
transit tankers, tugs, barges and fishing vessels. Vessel activity in the Inside Passage varies seasonally with
1,200-1,500 vessels using the passage each month in the summer and 800-1,000 vessels each month during
winter. U.S. and Canadian commercial fishing boats are the most common small vessels and account for
14 approximately 17 percent of traffic in the Inside Passage. Strong currents and narrow passages make these
waters challenging for vessels to navigate and present close-quarter situations with other marine traffic (Reid,
2008). If Enbridge’s Northern Gateway Project proceeds, at least 225 tankers will cross over the Inside
Passage each year, carrying condensate and crude oil to and from the Port of Kitimat.
Great Circle The “Great Circle” is the shortest distance between Asian Pacific Rim ports and the west coast of North America.
It is the route travelled by many of the cargo vessels carrying commodities (oil, bulk goods, vehicles, general
cargo) from North American to Asia, and Asian manufactured products to North America. The significance
of vessel traffic in the Great Circle Route is that all ships in transit—whether from Alaska or Asia—sail near
the west coast of Vancouver Island and Haida Gwaii, regardless of whether the vessel’s destination port is in
B.C. or Puget Sound.
Tanker Moratorium on the North and Central Coast later in Prince William Sound, Alaska (Brander-
British Columbians have long been concerned Smith, 1990; Priddle et al., 2004).
about oil tanker traffic on the coast (Brander- The North and Central Coast remained tanker-
Smith, 1990). According to federal government free until 2006 when the federal Conservative
documents (Priddle et al., 2004; Royal Society government permitted Canadian-chartered
of Canada, 2003), a moratorium on crude oil tankers to import condensate to the Methanex
tanker traffic in Hecate Strait, Dixon Entrance and Marine Terminal in Kitimat via Douglas Channel
Queen Charlotte Sound has existed since 1972. and Caamano Sound (Reid, 2008). Ever since, the
The moratorium was imposed by the federal federal Conservative government has denied the
Liberal government under Pierre Trudeau due to existence of the moratorium on tanker traffic and
concerns over potential environmental impacts,
and was later extended to include offshore oil and
gas exploration and development on Canadian
(offshore) lands. Public concern for the marine According to a 2010 poll, 80 percent of
environment was further strengthened after wit- British Columbians support banning crude
nessing the devastating and widespread effects of oil tankers in B.C.’s coastal waters, up from
the 1988 Nestucca Barge spill in Gray’s Harbour, 72 percent in a similar 2008 poll (For-
Washington, and the Exxon Valdez oil spill a year estEthics, 2010).(A40264)
“If oil-tanker traffic is allowed off Southern Coast Oil Tankers
the coast, it becomes a statistical The Port of Metro Vancouver handles fuel oil
and gasoline imports and exports through five ter-
question of when, not if, an accident
minals. In 2006, 1.7 million tonnes of gasoline and
is going to occur.” 1.4 million tonnes of fuel oil (mostly by barges)
(David Anderson6, 1989) were shipped to and from points on Vancouver
Island and in Washington State from the Port of
Metro Vancouver. Kinder Morgan’s Westridge
Marine Terminal is the largest of the Vancouver
has revoked the tanker moratorium statement terminals and has been in operation since 1957.
from the Priddle (2004) report. This significant Their operations are expanding: 34 crude oil tank-
change in federal policy was made without con- ers were loaded at the Westridge Marine Terminal
sultation or input from coastal communities or in 2007 compared to 28 in 2006. Most crude oil
First Nations governments along the tanker route shipments from the Kinder Morgan terminal are
and has been debated since. destined for California (Reid, 2008). However, the
Regardless of the existence of a federal tanker company has been “testing the logistics” of expand-
moratorium, a permanent, legislated tanker ban ing the capacity of their pipeline and shipping
is needed in Dixon Entrance, Hecate Strait and Alberta oil to China (Statistics Canada, 2007).
Queen Charlotte Sound. According to a 2010
1.2.1
poll, 80 percent of British Columbians support a
Trans-Alaska Pipeline System (TAPS) Oil Tankers
ban of crude oil tankers in B.C.’s coastal waters
(ForestEthics, 2010). In March of 2010, the Coastal U.S.-flagged and owned oil tankers transport
First Nations, an alliance of ten First Nations on crude oil from Valdez,Alaska along B.C.’s west coast
the North and Central Coast of B.C. and Haida to refineries in Puget Sound.This TAPS tanker traffic
Gwaii, declared their opposition to tanker traffic has resulted in an oil tanker traveling down B.C.’s
stating: coast every day since 1976.Today,TAPS tankers are
built with dual systems: two engines, two screws,
two rudders. The likelihood of both systems be-
“...in upholding our ancestral laws, coming disabled is remote (Reid, 2008).
rights and responsibilities, we
1.3
declare that oil tankers carrying
Projected Trends
crude oil from the Alberta Tar Sands Among all of B.C.’s ports over the next 15 years,
will not be allowed to transit our container ship volumes are expected to increase by
lands and waters.” 300 percent, bulk cargo shipments by 25 percent,
and cruise ship traffic by 20 to 25 percent (Hall,
(Coastal First Nations, 2010b) 2008). Throughput of the Port of Vancouver is
expected to grow 2.3 percent per year, from 73.57
million tonnes in 2004 to 106.4 million tonnes by
2020 (Government of British Columbia, 2005).
shipping on the british columbia coast 15shipping on the british columbia coast (A40264)
Projected Vessel Traffic Volumes from Proposed Pipeline “The north coast of B.C. is a well
and Terminal Expansion Projects established commercial and
Several terminal expansion and pipeline recreational marine network of
development projects are proposed or underway coastal and inland waterways.
along the B.C. coast that would increase shipping However, tankers transiting to and
traffic, shipping-related impacts and the risk of from Methanex’s Kitimat Terminal will
marine vessel casualties on the coast (Reid, 2008; encounter locations where close-
OSTF, 2002). At least four pipeline projects have quarter situations with other marine
been proposed for the North Coast alone which, traffic may occur including pilot
if permitted, would bring more than 300 oil tank- boarding stations, narrow channels,
ers to North and Central Coast waters every year channel beds, and areas where
(Reid, 2008). By far the largest pipeline proposal is marine traffic crosses. In addition
Enbridge’s Northern Gateway Project—described
to marine vessel traffic, visiting
in greater detail in Section 1.4.
tankers need to be aware of other
16 Most of these proposed developments are
regional activities that may present
directly related to the current and forecasted ex-
navigational hazards including
pansion of the Alberta tar sands. Production of tar
military operations, exploratory
sands oil drives the development and expansion
work, seaplane activities, commercial
of pipelines that can transport oil and condensate
fisheries, and environmentally
between the tar sands and the ports of Kitimat and
and socio-economically sensitive
Vancouver (Reid, 2008). In turn, tankers would be
required to ship condensate and oil to and from
shoreline features .
these ports. (Methanex Corporation, 2006)
Table 5 describes terminal expansion and
pipeline development projects that are proposed
or underway in B.C. The terminal expansion
At least four pipeline projects have been
projects are part of the $13 billion Asia-Pacific
proposed for the North Coast alone. If
Gateway Project which aims to make intermodal permitted, these projects will bring more
container and bulk cargo management larger and than 300 massive oil tankers to North and
more efficient (Reid, 2008). Central Coast waters every year.Table 5
Summary of Projected Major Vessel Traffic Volumes Based on West Coast Industrial Projects
Project Vessel Type Current Vessel Size Current Traffic Potential Traffic Volume Comments/Details of Project
Volume
Delta Container Terminal Container Current range of 3.1 vessels/day (1,131 5.3 vessels/day (1,934 New berth and second terminal to be in operation by 2021.
Expansion 1,600 to 6,300 TEU vessels/year) vessels/year) Container vessels will also increase in size, up to 12,000 TEU.
Prince Rupert Container Container Up to 5,020 TEU 167,000 TEU total Up to 2 million TEU annually Individual container vessels will increase up to 12,000 TEU or
Terminal Expansion volume for 2007 by 2020 greater.
Stewart Bulk Cargo and Bulk Unknown 30 vessels/year 100 vessels/year Additional traffic volume will include container ships.
Container Terminal Expansion
Kitimat General (Break-bulk) General Cargo n/a n/a n/a Proposal in feasibility stage.
Terminal Project
Kitimat LNG Terminal Project LNG Tanker n/a n/a 70 to 90 LNG tankers /year Size range from 160,000 to eventually 260,000 cubic meters
LNG tankers.
Kitimat to Summit Lake LNG LNG Tanker n/a n/a Increase LNG tanker traffic The pipeline project would significantly increase the capacity
Pipeline Looping Project to overland transport LNG from the Kitimat LNG Terminal.
Texada LNG Terminal Project LNG Tanker n/a n/a 36 LNG tankers /year n/a
Kinder Morgan Canada’s Oil Tanker 65,000 to 85,000 34 out-bound tankers Up to one loaded tanker per Tanker size will increase to 100,000 DWT. Assumption is that
Pipeline System Expansion DWT range for 2007 day all product will be transported by tanker; whereas, some may
be transported overland.
EnCana/Methanex 's Oil Tanker 35,000 DWT 7 to 9 in-bound 32 in-bound tankers/year Condensate is currently transported overland by rail car (30-
Condensate Tanker Imports tankers/year 40 cars/day). Imports are limited by a shortage of temporary
storage capacity at the terminal, which is in the process of
being increased.
Pembina Pipeline Oil Tanker n/a n/a One inbound tanker every 10 Pipeline design capacity is 100,000 barrels per day (bpd).
Corporation’s (Summit Lake) days (assuming an Aframax Could replace current condensates imports by EnCana being
Condensate Pipeline Project size) moved overland by railcar.
Enbridge Inc.'s Northern Oil Tanker n/a n/a Average 71 tankers/year Pipeline design capacity is 193,000 bpd (Enbridge Northern
Gateway Pipelines Project - (Enbridge Northern Gateway Gateway Pipelines, 2010a).
shipping on the british columbia coast
Condensate Import Pipeline Pipelines, 2010a).
Enbridge Inc.'s Northern Oil Tanker n/a n/a Average 149 tanker/year Pipeline design capacity is 525,000 bpd of crude oil (Enbridge
Gateway Pipelines Project - (Enbridge Northern Gateway Northern Gateway Pipelines, 2010a).
Crude Oil Export Pipeline Pipelines, 2010a).
17
(A40264)
Source: Reid, 2008 (unless otherwise noted)shipping on the british columbia coast (A40264)
1.4
Case Study—
Enbridge’s Northern Gateway Project
In May of 2010, Enbridge Northern Gateway to Asian and southern U.S. markets and import-
Pipelines submitted a project application to ing condensate to Alberta (Enbridge Northern
the National Energy Board (NEB) and Canadian Gateway Pipelines, 2010a).
Environmental Assessment Agency (CEAA) in The federal NEB/CEAA joint review of the
which it proposed to construct and operate two project, led by a Panel of three government em-
parallel 1,170 km oil pipelines between Kitimat, ployees, is expected to be complete by the end
B.C. and Bruderheim, Alberta (Figure 1). The of 2012. Numerous non-government organizations
proposal includes the construction of a marine and First Nations were granted public participant
terminal at Kitimat, B.C. and associated tanker traf- funding to partake in and provide expert evidence
fic. One pipeline would move 525,000 barrels of to the review. If approved, the projected timeline
crude oil per day west to Kitimat, and the other for completion and operation is 2016.
would carry 193,000 barrels of condensate east Northern Gateway’s emergency response
to the tar sands (Enbridge Northern Gateway strategy aims to “prevent accidents before they
Pipelines, 2010a). If approved, an average of 220 occur” (Enbridge Northern Gateway Pipelines,
supertankers will pass through the confined 2010b). The reality however, is that no amount of
18 waterways of the Great Bear Rainforest on B.C.’s planning can fully eliminate the risk of an oil spill.
North and Central Coast each year, exporting oil
1 In 2006, the International Maritime Organization (under MAR- Canada’s Westridge Marine Terminal in the Port of Vancouver (Reid,
POL), adopted a regulation requiring that all new ships with a bun- 2008).
ker fuel capacity of 600 m3 or more must have their fuel tanks
4 Table describes average number of vessel movements per year and
deeper inside their ship and behind two walls. The regulation also
not number of actual vessels, in accordance with Transport Cana-
limits the capacity of each fuel tank to 2,500 m3. This regulation
da’s method for counting vessels.
does not affect existing vessels (Reid, 2008).
5 Lower Mainland ports include the Vancouver Port, Fraser River
2 The capacity of Coastal and Panamax tankers are approximations
Port and the North Fraser Port. In 2008, these ports were amalgam-
based on 40,000 and 70,000 DWT vessels respectively.
ated into Port Metro Vancouver (Port Metro Vancouver, 2008)
3 Aframax tankers are the most common tankers worldwide and are
6 Former Minister of the Environment
the type of tanker that currently exports oil from Kinder-MorganFigure 1
Proposed Pipeline and Tanker Routes for Enbridge Northern Gateway Project
shipping on the british columbia coast
Data: Pipelines and tanker routes from Enbridge Northern Gateway Pipelines (2010c). Tar sands digitized by Global Forest Watch Canada from
Canadian Centre for Energy Information (2008).
19
(A40264)(A40264)
20
shipping on the british columbia coast(A40264)
2 Shipping Legislation
and Regulation
2.1
Legislation
The Government of Canada has jurisdic- require oil tankers and barges and oil han-
tion over shipping in Canadian waters1 and the dling facilities that receive shipments3 from
Canadian Coast Guard is the lead federal agency2 these vessels to have an “arrangement” with
for maritime oil spills from vessels under the a Transport Canada Response Organization
Canada Shipping Act. The B.C. provincial gov- (RO) to handle an oil spill for which they
ernment has jurisdiction over the coastline and are responsible (Reid, 2008).
the B.C. Ministry of the Environment is the lead
The
Fisheries Act (1985): applies to ship-
provincial agency for oil and hazardous material
ping only insofar as the protection of fish
spills under the Emergency Program Act.The dif-
and their habitat from pollution. It is ad-
ficulties associated with this jurisdictional overlap
ministered by the Minister of Fisheries and
is examined in Section 6.2.2.
Oceans Canada (Government of Canada,
A variety of legislation exists to govern ship-
1985).
ping in B.C. and Canada:
The
Marine Liability Act (2001): creates
The
Canada Shipping Act (2001): is the
the legal liability on the ship owner for
principle legislation governing safety in
oil pollution damage and costs of reason-
marine transportation and recreational
able measures4 undertaken. The Act also
boating, as well as protection of the marine
incorporates a number of international
environment. It applies to Canadian vessels
covenants into Canadian law (Reid, 2008).
operating in all waters and to all vessels
operating in Canadian waters. It promotes International
Maritime Organisation
“the sustainable growth of the marine (IMO): was established in 1948 and is
shipping industry without compromising the United Nation’s specialized agency
safety (Reid, 2008).” It is administered by responsible for improving maritime safety
the Minister of Transport although some and preventing pollution from ships (IMO,
provisions are governed by the Minister of 2002). IMO conventions for ensuring crew
Fisheries and Oceans Canada. In 1993 the and passenger safety, preventing accidents,
Canada Shipping Act was amended to and pollution, making arrangements for
shipping on the british columbia coast 21shipping on the british columbia coast (A40264)
compensation, and for the design and op- operating in Canadian waters built or substantially
eration of major vessels come into effect modified after 1993 were to be double-hulled.The
when a majority of nations accede to them. accelerated phase-out date put Canada at par with
Canada agreed to the conventions of the the U.S., which mandated all tankers calling at
IMO under The Canada Shipping Act American ports be double-hulled by 2010, under
(2001) The conventions do not address the Federal Oil Pollution Act (OPA) of 1990 (Reid,
emergency preparedness however, which 2008). Introduction of the OPA closely followed
is left to the individual country (Reid, the Exxon Valdez spill in Prince William Sound in
2008). 1989.The Exxon Valdez was a single-hulled tanker.
The International Convention for the 2.3
Prevention of Pollution from Ships Voluntary Tanker Exclusion Zone
(MARPOL): is intended to prevent ships The Voluntary Tanker Exclusion Zone (TEZ)
from polluting the marine environment by (Map 3) has existed as an industry Code of Practice
operational or accidental causes. It covers since the 1970s to discourage tankers carrying
pollution by oil, chemicals and harmful petroleum, liquid gas and vegetable oils from trav-
substances in packaged form, as well as eling too close to B.C.’s west coast (MacConnachie
sewage and garbage.As of December 2005, et al., 2007). The TEZ was designed to reduce the
22 136 countries (including Canada), repre- risk of a disabled tanker drifting ashore before
senting 98 percent of the world’s shipping a salvage tug could reach it in difficult weather
tonnage, were party to MARPOL. conditions (Reid, 2008).
Originally, the TEZ was aimed at TAPS tank-
2.2
ers moving along the west coast of Haida Gwaii
Regulatory Measures (Queen Charlotte Islands) and was unpopular
2.2 among the tanker industry. In 1988, the U.S.
Double vs. Single Hulled Vessels and Canadian Coast Guards, along with the U.S.
Chamber of Shipping, developed a TEZ that took
Double-hulled vessels are often cited as an
into consideration:
improvement over single-hulled vessels (OCIMF,
2003). A double hull is essentially two skins of 1 The risk of a disabled tanker grounding on
steel separated by a space about two metres the B.C. coast;
wide which is used to hold ballast water when
the vessel is without cargo (PWSRCAC, 2009). 2 The
risk of west coast fishing vessels col-
The theory is that if the outer hull is damaged, liding with tankers;
the cargo in the inner hull may still be protected
3 The
shipping industry’s desire to keep
(Reid, 2008). Double-hulled tankers offer the best the boundary close to shore for economic
protection when a collision or grounding occurs reasons; and
at slow speeds, but double hulls do present chal-
lenges as they are still a relatively new technology 4 The
position at the time of breakdown
and are more susceptible to problems of poor tankers were predicted to run aground
maintenance and operation (OCIMF, 2003). For before the arrival of a tug.
instance, double hulls may result in increased cor- Critics point out that the economic interests
rosion between the hulls and a top heaviness that of the shipping industry were too well accom-
makes the vessel less stable in rough conditions. modated in the development of the TEZ. It is
In 1993, the International Maritime deemed as an inadequate measure to protect the
Organization (IMO) enacted a phase-out scheme coast from potential tanker disasters because 1)
for all single-hulled tankers by 2015, later acceler- it is voluntary, and 2) portions of the boundary
ated to 2010 ((Reid, 2008). In addition, all tankers fall substantially short of the distance required to(A40264)
enable a rescue tug to arrive and secure a tow in term “flag of convenience” describes this business
severe weather conditions (OSPF, 2002).The near- practice, the significance of which is that it raises
est rescue tug is stationed 600 nm away, at Neah the question of who is ultimately responsible, or
Bay in Washington State. Furthermore, oil barges accountable, for a vessel in the event of a casualty
and other non-oil carrying tankers (i.e. chemical (Reid, 2008).
tankers, bulk carriers, container vessels, etc.) do In Canada, accountability for a major spill is at
not need to travel outside the TEZ and often travel “arms-length” ever since the Exxon Valdez spill in
very close to shore (Reid, 2008). A drift analysis 1989. Oil companies will rarely put their corporate
study which assessed the risk associated with name on a vessel anymore because oil companies
disabled tankers and B.C. rescue tug capacity is rarely own the vessels in which they transport their
described in Section 5.1. product. Instead oil companies charter vessels to
do their shipping and it is the ship owner, not the
2.4 product owner, that is the legally Responsible Party
Accountability (RP) in the event of an oil spill or other marine
Internationally, the shipping industry is a casualty (Reid, 2008).
complex structure of national and open registries.
Some 29,000 vessels above 1,000 GT worldwide
are engaged in seaborne trade and nearly half of
these vessels are registered in the open registries
of countries5 different from that of the ship
owner (Reid, 2008). This practice can reduce
operating costs and enables ship owners to avoid
regulations in their own country (ITF, 2010). The
1 Canada’s Oceans Act defines “Canadian waters” as the area in be- 4 Reasonable measures and cost requirements are poorly defined
tween the low water line and 200 nautical miles (nm) out to sea. (Reid, 2008).
2 Lead agency refers to the government department, ministry, or or- 5 Countries with open registries include Panama, Liberia, Cyprus,
ganization that has jurisdiction to manage an emergency. Bahamas, Bermuda and Vanuatu, as well as the international ship
registries of Norway and Denmark (Reid, 2008).
3 The amendment only applied to tankers and barges carrying oil in
excess of 150 tonnes, and to ships 400 tonnes or greater..
shipping on the british columbia coast 23(A40264)
24
shipping on the british columbia coast(A40264)
3 Types and Causes
of Marine Vessel Casualties
3.1. bunker fuel which is carried by all vessels to op-
Types of Marine Vessel Casualties erate their engines and ship systems. Most of the
A marine vessel casualty refers to an accident world’s ocean-faring vessels use a heavy fuel oil
resulting in damage to a vessel such as ground- (HFO) known as Bunker “C”. The risk of a bunker
ing or sinking, collision or allision (Reid, 2008). fuel spill is greatest with general cargo ships, bulk
However, a marine vessel incident refers to a carriers and container vessels since the outer hulls
vessel in distress (i.e. loss of engine power).Vessel
of these ships serve as part of the fuel tank and can
incidents can lead to marine vessel casualties. On rupture in the event of a collision or grounding.
the B.C. coast between 1999 and 2009, over 1,200 The bunker fuel capacity of major marine vessels
vessel incidents were reported (Map 4). is considerable. Bulk carriers hold as much as
4,000 m3 of HFO and 300 m3 of diesel oil. An even
Discharge of a Vessel’s Cargo
greater threat comes from large oil tankers and
Although we typically focus on the risk container vessels which carry as much as 7,500
and potential impacts of a major tanker losing m3of HFO and 400 m3 of diesel as bunker fuel
its cargo of oil, the loss of other cargos (i.e. (Reid, 2008).
containers and chemicals) can have substantial
public safety and environmental consequences Ship Wreck
as well. Hundreds of floating containers from an A ship wreck due to grounding or sinking poses
overturned container ship pose a serious threat the economic dilemma of whether to salvage the
to vessels attempting to navigate through the vessel or leave it as a wreck. A ship wreck that is
flotsam. If containers are broken open at sea, or not removed can be a public safety issue, a blight
once they reach shore, the contents can become on the landscape, a navigational risk, and a source
a substantial source of marine and coastal pol- of chronic pollution as the vessel degrades over
lution (Reid, 2008). Of course, oil spills are also time (Reid, 2008).
damaging events, the ecological impacts of which
are described in Section 5.2 3.2
Causes of Marine Vessel Casualties
Release of Vessel’s Bunker Fuel
Most vessel accidents are a result of a combi-
An oft-overlooked aspect of marine vessel nation of factors, all which contribute in varying
casualties is the potential release of a vessel’s degrees to the final outcome. According to marine
shipping on the british columbia coast 25shipping on the british columbia coast (A40264)
statistics compiled by the Transportation Safety
Board of Canada between 2002 and 2006, the
most common cause of shipping accidents Human factors are cited as the underly-
involving Canadian commercial vessels were ing cause of 75-80 percent of oil spills
groundings, strikings (not including collisions) and marine accidents.
and fires or explosions (TSB, 2007). These data (DeCola & Fletcher, 2006)
reflect those collected by the International Tanker The Role of Human Error in Marine Vessel Casualties
Owners Pollution Federation (ITOPF) which has
Conservative estimates suggest that human
maintained a database of accidental oil spills from factors—either individual errors or organizational
tankers, combined carriers and barges since 1970. failures—are the “real” or underlying cause behind
The ITOPF classifies spills as either “opera- as much as 75-80% of oil spills and marine ac-
tional” or “accidental” (ITOPF, 2010). ITOPF data cidents (DeCola & Fletcher, 2006; Brander-Smith,
indicates that most spills from tankers result 1990). Although we may identify the causes of
from routine operations (i.e. operational), such oil spills and accidents according to a type of
as loading, discharging, and bunkering in ports or incident (e.g. groundings, collisions, fires, etc.),
at oil terminals (ITOPF, 2010). Most operational the root cause can likely be traced back to a chain
spills are small, 90 percent of which have resulted of events involving human performance break-
in less than 7 tonnes of oil being spilled. On the downs, resulting in poor choices and decisions.
26
other hand, accidental spills, such as those result- The significance of this information should not be
ing from vessel collisions or groundings, typically overlooked. Human and organizational errors will
result in much larger spills. Eighty-four percent of continue to occur despite improvements to oil
accidental spills have resulted in oil spills in excess spill prevention technologies, tanker design and
of 700 tonnes (ITOPF, 2010). Figure 2 provides a regulatory oversight (DeCola & Fletcher, 2006).
breakdown of the causes of oil spills that resulted Proposed terminal expansion and pipeline devel-
in quantities of oil in excess of 700 tonnes being opment projects on the B.C. coast are not exempt
released. from the reality of human nature.
Figure 2
Causes of Oil Spills in Excess of 700 tonnes2
Adapted from ITOPF (2010)
1 In 2006, the International Maritime Organization (under MAR- limits the capacity of each fuel tank to 2,500m3. This regulation
POL), adopted a regulation requiring that all new ships with a does not affect existing vessels (Reid, 2008).
bunker fuel capacity of 600m3 or more must have their fuel tanks
2 Includes operational and accidental oil spills (ITOPF, 2010).
deeper inside their ship and behind two walls.The regulation also(A40264)
4 Environmental Impacts
4.1.
From Normal Operations
A catastrophic oil spill may be the first thingHall, 2008) and can be as toxic to marine life as an
that comes to mind with respect to the potential oil spill (Johannessen, et al., 2007).
impacts of shipping. However, a number of other Anti-fouling paints, used as a biocide on vessel
sources of pollution and environmental distur- hulls since the 1970s, commonly contain a com-
bance exist in the realm of vessel and shipping pound called tributylin (TBT)3 (Haggerty et al.,
activities. These impacts range from chronic oil 2003), which has been described as “the most toxic
pollution from oily wastewater discharges, to substance ever deliberately introduced into natural
the introduction of invasive species and anthro- waters” (Stewart & Thompson, 1994). Benthic sedi-
pogenic noise pollution. The following section ment cores approximately 25 kilometres offshore
outlines several shipping-related sources of
from Vancouver harbour have shown traces of TBT
marine pollution and disturbance, and some of
(Stewart & Thompson, 1994). Wood preservatives,
the resulting ecological impacts.
often applied to pilings, peers and docks, also have
Water Pollution toxic effects when released into the marine envi-
Chronic oil pollution from marine traffic (as ronment (Molnar & Koshure, 2009).
opposed to acute oil spills) contributes more oil Debris disposal by ships pose serious risks
to the marine environment than do acute spills1 to marine organisms (Molnar & Koshure, 2009;
(Haggerty et al., 2003). Worldwide, operational Hall, 2008) if they become entangled in debris or
discharge from ships is estimated to amount mistake the marine debris for prey (BCCSN, 2010).
to 198,000 tonnes each year2 (GESAMP, 2007). Common types of debris such as glass, metals, paper,
Chronic oil pollution most frequently occurs food wastes, wood, rubber and packaging materi-
during cargo transfers at ports where vessels als can be discharged overboard at prescribed
discharge oily bilge and waste water (Haggerty et
al., 2003), but also on offshore shipping routes
through engine, tank and shipboard machinery As many marine birds are killed as a result
washings (Van Hinte, 2005; Haggerty et al., 2003). of chronic oiling as from catastrophic oil
Chronic oil pollution has persistent, cumulative spills (Johannessen, et al., 2007).
impacts on marine plants and animals (MoE, 2006;
shipping on the british columbia coast 27shipping on the british columbia coast (A40264)
distances from shore under various international
marine conventions (Van Hinte, 2005).The release
of sewage and grey water from ships into the Southern coastal B.C. is critical habitat
marine environment is of great concern due to for Southern Resident killer whales which
concentrations of pharmaceuticals, coliform bac- are listed as “Endangered” by the Com-
teria, personal care products, oils and greases, and mittee on the Status of Endangered Wild-
nutrients found in human waste and in grey water life in Canada (COSEWIC, 2009). There
from sinks, showers and galleys (Johannessen et is concern that noise from heavy marine
al., 2007).The release of sewage and grey water is traffic in the Georgia and Juan de Fuca
of particular concern with respect to cruise ships. straits (Map 2) may be interfering with the
It is estimated that a cruise ship carrying 3,000 whales’ ability to locate prey and com-
people for one week can produce 3.8 million municate with each other, although this
litres of waste water and 800,000 litres of sewage has yet to be assessed (DFO, 2005).
(Hall, 2008).
Air Pollution
International shipping is becoming an increas-
ingly significant source of air pollution and green
28 house gas emissions. By 2010, marine vessels are & Koshure, 2009) and is cited as a conservation
predicted to exceed on-road motor vehicles as a concern for threatened Northern Resident and en-
source of smog-forming air pollutants in Metro dangered Southern Resident killer whales (Joyce,
Vancouver (MoE, 2006;Van Hinte, 2005). Key com- et al., 2005).
pounds emitted by ocean-going vessels include
carbon dioxide, nitrogen oxides, sulphur oxides, Invasive Species
carbon monoxide, volatile organic compounds, More than 3,000 species of animals and plants
black carbon and particulate matter. These com- are estimated to be transported around the world
pounds have been linked to a variety of public daily in ballast water (MoE, 2006). When ballast
health concerns and ecosystem impacts, as well as water is discharged, alien species may become
global warming and ocean acidification.At present, introduced to a new area.Alien species are consid-
no mandatory measures to regulate and reduce ered invasive if their introduction causes harm to
emissions of greenhouse gases from international the environment, the economy or human health
shipping sources exist (Maritime Environment (Transport Canada, 2010).A recent analysis of high
Protection Committee, 2010). Without action, density shipping areas in B.C. identified the Strait
carbon dioxide emissions from shipping could of Georgia, Johnstone Strait and parts of the Inside
rise as much as 75 percent in the next 15-20 years Passage along the B.C. Central Coast as areas at
(Vidal, 2007). the highest risk for significant invasive species
introductions (Herborg et al., 2008).
Noise Pollution
Ambient noise levels in the ocean are thought
to be at least ten times higher today than they
were a few decades ago (Hildebrand, 2003).
Loud sounds can interfere with marine mammals
dependent on the physics of underwater sound
for communication, reproduction, navigation, and The European green crab was introduced
locating food (Molnar & Koshure, 2009). Noise to San Francisco Bay through ballast
pollution from engine propellers, seismic surveys water and is currently migrating up the
and navy sonar produce sound levels that are west coast, threatening indigenous crab
above the pain threshold for killer whales (Molnar populations (Van Hinte, 2005).(A40264)
Ship strikes
“Ship strike” is the term used when a ship hits
An oil spill of 36,500-365,000 barrels can
a whale or other marine mammal. Ship strikes
spread to cover an area of 50,000 km2
can pose substantial conservation issues for small
(Patin, 1999).
populations or endangered species (Laist et al.,
2001). Fortunately, ship collisions with whales on
the B.C. coast are rare, but increased marine traf-
fic in shipping lanes that cross whale migration
The Exxon Valdez oil spill in 1989 was
and feeding areas increases the risk of collisions
estimated to have resulted in the death
(Environment Canada, 2004). In the narrow pas-
of 2,800 sea otters, 250,000 birds, 1.9
sageways of B.C.’s North and Central Coast, where
million salmon, and 12.9 billion herring
whales and high vessel traffic densities are found,
(Brown et al., 1996; Geiger et al., 1996;
researchers have demonstrated an elevated ship
Piatt & Ford, 1996).
strike risk for humpback, fin and killer whales
(Williams & O’Hara, 2009).
For a more thorough assessment of the they are unique to the nature and size of the spill
impacts of shipping download: “Cleaning (Birtwell & McAllister, 2002; Patin, 1999; GESAMP,
Up Our Ocean: A report on ocean pollution 1993), the surrounding environment (Birtwell &
from shipping-related sources in the Pacific McAllister, 2002; Strong et al., 2002; Wells et al.,
North Coast Integrated Management Area 1995), and biological characteristics of impacted
(Pncima) on the British Columbia Coast” organisms. For instance, animals that live at the
from www.livingoceans.org/initiatives/ ocean’s surface, in inter-tidal zones, in estuaries
ocean-planning/reports-publications. and in other coastal habitats are impacted most
severely by oil spills (Strong et al., 2002; GESAMP,
4.2 1993). Immediate effects on marine life may be
From Vessel Casualty compounded by linkages of organisms within food
webs (Birtwell & McAsllister, 2002).
Oil Spills The duration of environmental impacts from
When oil is released in a spill, it is acted upon oil spills varies according to species and the degree
by physical, chemical and biological “weathering” to which oil is retained in shoreline sediments.
processes. If released at the ocean’s surface, oil Oil can persist for longer periods on beaches
rapidly spreads into slicks and moves along with composed of course materials such as gravel and
the prevailing water flow and wind direction. cobbles (U.S. NOAA, 1997; GESAMP, 1993). A 2003
When spills occur beneath the surface of the study in Prince William Sound indicated that oil
ocean, the oil spreads through the water column remained in shoreline sediments and a number of
and drifts with currents (Patin, 1999). In both species were still exhibiting signs of oil pollution
instances, spilled oil can dissolve, evaporate, 14 years after the Exxon Valdez spill (Peterson,
emulsify, and disperse within the water column, et al., 2003). Impacts on the natural environment
aggregate into lumps or tar balls, oxidise or enter from an oil spill could have far reaching socio-eco-
the sediment. Waves and currents will eventually nomic and cultural effects by negatively impacting
bring spilled oil to near shore areas (U.S. NOAA, commercial, recreational or subsistence fisheries,
1997), and substantial portions of oil spills typi- and marine recreation and tourism industries.
cally reach shorelines before they are completely
weathered at sea (Patin, 1999).
Oil spills can have immediate and harmful
impacts on marine organisms. Specific ecologi-
cal impacts of oil spills are difficult to predict as
shipping on the british columbia coast 29shipping on the british columbia coast (A40264)
The length of time an animal is in oil is a
more important determinant of survivabil-
ity that the amount oil it has been exposed
to. A highly oiled bird that has been cap-
tured and appropriately cared for within a
few hours has a greater chance of surviv-
al—and less suffering—than a lightly oiled
one left in the wild for days (Reid, 2008).
30
1 Chronic oil pollution refers to operational discharge of oil from 3 The use of TBT compounds in antifouling paints in Canada was
ships into the marine environment. In contrast, acute oil pollution prohibited in 2002 (Health Canada, 2002).
results from accidental oil spills (Molnar & Koshure, 2009).
2 Includes operational discharges of fuel oil, bilge oil and oily ballast
water (GESAMP, 2007).You can also read