ZAMBIA ROADSHOW OCTOBER 2016 - Grit Real Estate Income Group
←
→
Page content transcription
If your browser does not render page correctly, please read the page content below

ZAMBIA ROADSHOW
OCTOBER 2016
CURRENT ASSET UNDER TRANSFER
Cosmopolitan Mall (50% ownership)
                         Location:                     Lusaka, Zambia

                         Anchor tenant(s):             Shoprite, Game

                         Sector:                       Retail

                         Land title:                   Leasehold

                         GLA:                          25 900m2

                         Parking bays:                 1 300

                         Anchor lease term:            10 years

                         Anchor tenant lease expiry:   2026

                         Average escalation:           US CPI

                         Vacancies:                    0%

                         Valuation (100%):             US$ 74.2 million

                         Acquisition yield:            7.80% (9.84% in Mauritius)
                                                                                    3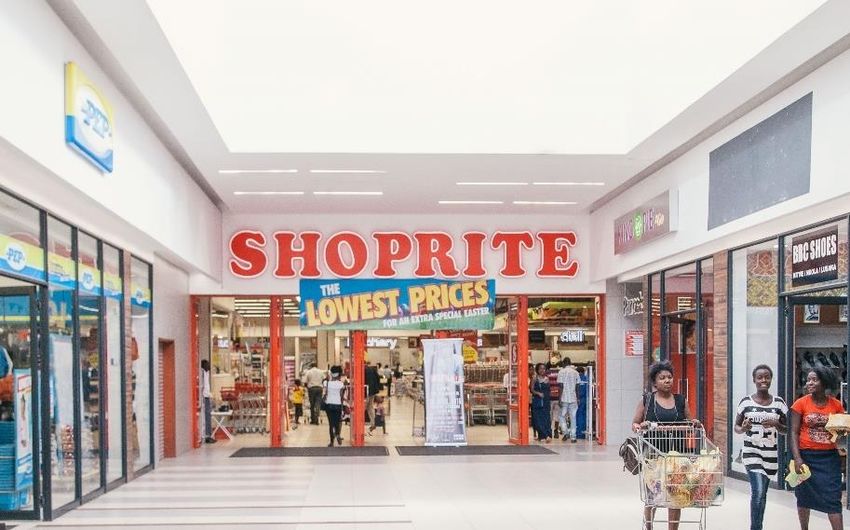
EXISTING PORTFOLIO ASSETS
Mukuba Mall (50% ownership)
                         Location:                     Kitwe, Zambia

                         Anchor tenant(s):             Shoprite, Game, Pick ‘n Pay

                         Sector:                       Retail

                         Land title:                   Freehold

                         GLA:                          28 229m2

                         Parking bays:                 670

                         Anchor lease term:            10 years

                         Anchor tenant lease expiry:   2025

                         Average escalation:           US CPI

                         Vacancies:                    0%

                         Valuation (100%):             US$ 63.0 million
                                                                                     5
Kafubu Mall (50% ownership)
                          Location:                     Ndola, Zambia

                          Anchor tenant:                Shoprite

                          Sector:                       Retail

                          Land title:                   Leasehold

                          GLA:                          12 141m2

                          Parking bays:                 180

                          Anchor lease term:            10 years

                          Anchor tenant lease expiry:   2024

                          Average escalation:           US CPI

                          Vacancies:                    0%

                          Valuation (100%):             US$ 17.5 million
                                                                           6
KEY PORTFOLIO
PERFORMANCE METRICS

Key Portfolio Performance Metrics
                   VACANCY AND LEASE EXPIRY                                        Mukuba Mall   Kafubu Mall   Cosmo Mall
                                No. of tenants                                         69            42           66
                                  Vacancy (m2)                                         58            0             0
                                   Vacancy (%)                                        0.21%        0.00%         0.00%
            % m2 expiring in the next 12 months                                        0%            0%           0%
            % m2 expiring in the next 24 months                                        1%            0%           0%

                       TENANT COMPOSITION                                          Mukuba Mall   Kafubu Mall   Cosmo Mall

                   % National Tenants (by GLA)                                        83%           86%           78%

                      % Local Tenants (by GLA)                                        17%           14%           22%

                % USD Leases (by Rent Income)                                         71%           38%           80%

               % ZMW Leases (by Rent Income)                                          29%           62%           20%

Note: Information sourced from most recently finalised Property Management Packs                                            8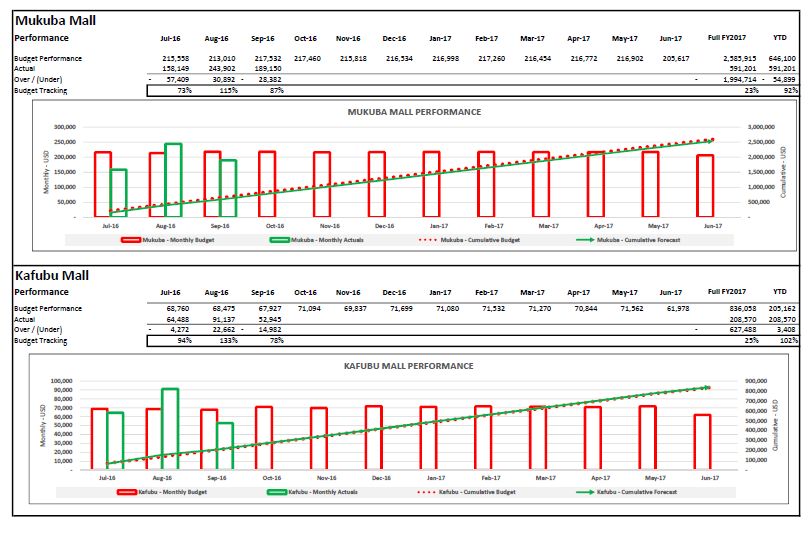
Key Portfolio Performance Metrics
            TURNOVER AND TRADING DENSITY                                             Mukuba Mall                     Kafubu Mall       Cosmo Mall

   Total Centre Average Monthly Turnover (US$)                                          2 941 397                     1 982 236              N/A*

     Average Centre Trading Densities YTD (US$)
                                                                                           104.20                      163.27                N/A*
                  (Jan - Aug 2016)

           Turnover Growth % YOY (2015-2016)                                                 20%                         8%                  N/A*
 * Turnover figures are currently unavailable for Cosmopolitan Mall as the centre only started operating this year

  RENTAL, OPERATING EXPENSES AND ARREARS                                             Mukuba Mall                     Kafubu Mall       Cosmo Mall

       Total Centre Average Rental per m2 (US$)                                             17.43                       16.60               24.99

                       Cost to Income Ratio (%)                                              15%                        21%                  14%
                                                                                                                                     Final figure unavailable
       Total Arrears (% of Total Monthly Billings)                                           11%                         7%         due to trading and rental
                                                                                                                                   liability recons in progress

Note: Information sourced from most recently finalised Property Management Packs                                                                                  9
Key Portfolio Performance Metrics
 GROCERY ANCHOR PERFORMANCE (SHOPRITE)                                                  Mukuba Mall        Kafubu Mall          Cosmo Mall

                      Grocery Anchor GLA (m2)                                              4262                  4144              3422

              Grocery Anchor Rent per m2 (US$)                                              9.61              15.03                16.69
       Grocery Anchor Total Average Turnover
                                                                                         1 347 835          1 021 386            1 094 269
                 per month (US$)
     6 month Average Trading Density per m2 of
                                                                                           316.24            246.47               319.77
               Grocery Anchor (US$)

                                                 TOP 5 TRADING DENSITIES FOR LATEST REPORTING MONTH
           Kafubu Mall (US$)                                                       Mukuba Mall (US$)                   Cosmo Mall (US$)
1.          DSTV          917.73                                        1.       Mobile City      898.01    1.      Hungry Lion       631.90
2.       Hungry Lion      525.71                                        2.       Hungry Lion      692.44    2.        Umoyo           555.30
3.      American Swiss    358.34                                        3.          MTN           555.61    3.     American Swiss     496.54
4.        Shoprite        195.07                                        4.    Gigibonta Zambia    532.74    4.       Mobile City      364.22
5.         E Plus         181.01                                        5.        Vodafone        492.55    5.      The Cake Bar      316.05

Note: Information sourced from most recently finalised Property Management Packs                                                               10
FINANCIAL PERFORMANCE (SHARE OF PROFITS)
Financial Performance (Share of Profits)

Note: Cosmopolitan Mall is still under transfer   12
COUNTRY RISK ANALYSIS
Key Facts

                         Gross Domestic Product
         4%               Ave Medium Term Forecast Growth                                               Credit Rating
                          per annum                                                                                     Fitch
                                                                                                                                Credit Rating
                                                                                                                                      B
                                                                                                                                                Outlook
                                                                                                                                                Negative

                                                                                                                    Moody’s          B3         Negative
                                                                           Capital Lusaka                                S&P          B
                           Nominal Per Capita
                                                                                                                                                Negative

                                                                                                                 IHS Connect         B-         Negative

     $2,404                Ave Medium Term Forecast

                           PPP in USD                                                       Population
                                                                                                                   2025
                                                                                 2015
                          Urbanization Rate
      4.3%                  2013

                         Urbanized Population                                   16.2 mill
       41%                 2013                                                                                                 21.4            mill
                                                                                        Population Density
                                                                               2005                            2013
                          Resource Dependency
        78%               Top 3 Exports as % of the Total Exports (2012)

                                                                               16.1 People per km   2

                                                                                                                         21.8             People per km2
                                                                                                                                                           14
Source: World Bank, IHS Connect, BBC, Mara Delta (2016)
Economic Outlook
Gross Domestic Product International Reserves Key Points
30,00 6,00 3,50 4,00
1. After consecutive years of strong GDP growth
3,00 3,50
25,00 5,00 that made Zambia one of the best-performing
3,00
20,00 4,00
2,50 economies in southern Africa, the country
2,50
2,00 reached low-middle-income status in 2010.
2,00
15,00 3,00
1,50
2. Zambia’s GDP growth expectations marginally
1,50
10,00 2,00
more positive than expected after recent
1,00
1,00
slump.
5,00 1,00 0,50 0,50 •Zambia's economy has been affected by low
0,00 0,00
0,00 0,00 commodity prices . The country is one of the
2013 2014 2015 2016f 2017f 2018f 2019f 2020f
2013 2014 2015 2016f 2017f 2018f 2019f 2020f world's largest exporters of copper (75% of
Nominal GDP (USD) Real GDP, Growth Rate (%) Int. Reserves Excluding Gold, USD Int. reserves, import cover total exports) and the lackluster commodity
price environment will continue to exert
Foreign Debt pressure on Zambia’s mining sector, which is
Domestic Credit unlikely to significantly recover until 2018.
100,00 35,00
90,00
12,00 45,00 •The drought at the end of 2015 has severely
80,00
30,00 40,00 impacted the agriculture production and hydro
10,00
70,00 25,00 35,00 power supply, slowing economic growth .
60,00
8,00 30,00 •Nevertheless, Zambia’s GDP growth
20,00
50,00 25,00 expectations have marginally increased for
6,00
40,00
15,00 20,00 2016/17, following expectations of a more
30,00 4,00 15,00
favorable agricultural outcome for the farming
10,00
20,00 10,00
season and copper production increased by
10,00
5,00 2,00 9.6% year on year.
5,00
0,00 0,00
•The economy will remain vulnerable to external
0,00 0,00
2014 2015 2016f 2017f 2018f 2019f 2020f 2013 2014 2015 2016f 2017f 2018f 2019f 2020f shocks such as the weather and developments
Domestic Credit - LCU Foreign Debt: Total, USD
in international commodity prices.
Growth Rate: Domestic Credit in LCU Total Foreign Debt as % of GDP
15
Source: Data from IHS Connect and IMF (2016)Political & Governance Overview
Key Points
1. Zambia continues to be one of the most politically stable countries in the sub-Saharan region.
2. The governing Patriotic Front's (PF's) Edgar Lungu, who served the remainder of former president Michael Sata's term from January 2015, won his
first full term in office at the August 2016 presidential election.
3. The PF adheres to investor and business-friendly policies which attracted significant private investment into the country’s mining and agricultural
sectors. Attracting more than USD8.5 billion in foreign direct investment inflows during 2010–14, driving growth’
4. Zambia’s headline inflation rate reached a peak of 22.9% year on year in February 2016 and has since been trending down slowly. A steep drop in
headline inflation from the fourth-quarter 2016 onward is expected.
5. Further monetary responses are expected if pressure on the Zambian kwacha re-emerges. The Bank of Zambia has shown its commitment to
shield the kwacha exchange rate from further depreciation following the 800-basis-point rise in the bank’s overnight lending facility rate in
November 2015. Scope to lower the Bank of Zambia's policy rate from 2017 onward is considered highly likely.
6. The fiscus has shown a deterioration in the wake of large spending commitments and slowing government revenue flows.
7. Nevertheless, Zambia has made significant progress and reached broad consensus with the International Monetary Fund on a planned support
package. The government hopes to secure a bailout that could exceed USD1.2 billion to support the nation’s budget and top-up foreign reserves.
Exchange Rate Policy Interest Rate Inflation
16,00 20,00
18,00
18,00
14,00 16,00
16,00
12,00 14,00
14,00
10,00 12,00
12,00
10,00
8,00 10,00
8,00
6,00 8,00
6,00 6,00
4,00
4,00 4,00
2,00
2,00 2,00
0,00 0,00 0,00
2011 2012 2013 2014 2015 2016f 2017f 2018f 2019f 2020f 2011 2012 2013 2014 2015 2016f 2017f 2018f 2019f 2020f 2011 2012 2013 2014 2015 2016f 2017f 2018f 2019f 2020f
16
Source: Data from IHS Connect and IMF (2016)Key Strengths & Weaknesses
KEY STRENGTHS KEY RISKS
Strong economic growth prospects. Uncertainty caused by policy reviews.
High urbanization rate. Operational challenges including power-rationing.
PF-led government maintains an anti-corruption stance. Near-term growth prospects of the Zambian economy remain
Proceeds from Eurobond issuance are to be channelled into precarious due to slow copper prices recovery and weather related
infrastructural development. risk.
Zambia enjoys a relatively secure environment. Gradually subsidies cuts expected.
Business friendly policy.
IMF support package planned to support foreign reserves.
Mitigation measures in place
1. Mara Delta’s management has maintained close and robust ties with its local in-country partners in order to comprehensively monitor economic
and political stability.
2. Mara Delta continues to maintain a policy limiting any local currency exposure, utilising natural hedging of currency risk by matching the
currency of expenditure to the currency of income.
3. Mara Delta has a robust ability to manage flow of funds through the Group liquidity facilities in Mauritius, careful manages cashflows
surrounding investments and the strength of the counter parties (tenants).
4. All Mara Delta assets in country are equipped with power generators when and if power supply issues occur.
17
Source: IMF (2016)EXECUTIVE & MANAGEMENT TEAM
Executive Team
      Bronwyn Anne Corbett                Bronwyn is the Chief Executive Officer of Mara Delta Property Holdings, the largest pan African focused real estate fund listed on
      Chief Executive Officer             the Johannesburg Stock Exchange and in Mauritius. Corbett has significant corporate finance and deal making experience. She
                                          played an instrumental role in the JSE listing of Delta Property Fund Limited in 2012 where she held the positions of Chief Financial
      BCom (Acc) (Univ. of Natal, PMB),   Officer and Chief Operating Officer prior to taking up the leadership role at Mara Delta. During her tenure at Delta Property Fund
      CA(SA)                              Limited, Corbett spearheaded the diversification of the REIT’s funding sources into the debt capital markets, leading to the
                                          establishment of a ZAR2 billion Domestic Medium Term Note Programme (DMTN programme). She led the team responsible for
                                          obtaining a national scale issuer rating from Global Credit Ratings as part of the DMTN programme. In addition, Bronwyn co-headed
                                          the team responsible for growing assets under management from ZAR 2.2 billion at listing to ZAR 11.8 billion in May 2016. Bronwyn
                                          is a founder member and served as non-executive director on the board of Delta International Property Fund Limited (now
                                          Mara Delta Property Holdings) where she played a significant role in the listing and conversion of the fund to its current pan-African
                                          focus, underpinned by dollar based leases. She assumed the role of Chief Executive Officer in the lead-up to the fund’s merger with
                                          Pivotal/Mara to form Mara Delta. She has grown the fund from $220 million to approximately $450 million in under 2 years.

      Leon van de Moortele                After completing articles with PwC, Leon moved to the Global Risk Management Services within PwC, where he become the Senior
      Chief Finance Officer               Manager in charge of Data Management. In 2004, he moved to Solenta Aviation where he became Group Finance Director within
                                          18 months. During his tenure as Group Finance Director, the group expanded from 12 aircraft to 48 aircraft, operating in 8 African
      Bcompt (Hons), CA(SA)               countries (including South Africa, Mozambique, Algeria, Ghana, Gabon, Kenya, Tanzania and Cote d’Ivoire). He joined Mara Delta in
                                          April 2015, as CFO, where he has continued to utilise his tax structuring knowledge and experience in operating in Africa to expand
                                          the asset base of the group.

      Greg Pearson                        A graduate of Kingston University, London, Greg studied Business Management and Project Management and is registered with the
      Head of Developments and            Chartered Management Institute. Greg was formerly an executive with AECOM, a global provider of Design, Development,
      New Business                        Engineering and construction services having had the responsibility of expanding the footprint for the ‘Rest of Africa’ business from
                                          2006 (outside of South Africa). He gained his basic training and experience in London working mostly on commercial, retail and
      MCMI, Elec Eng                      residential mixed use projects. Greg’s expertise includes development management, cost planning, procurement, time
                                          management and traditional project management of major engineering and building projects. His market sector knowledge
                                          includes: office, retail, Leisure, education and healthcare schemes and he has experience in over 40 African countries.

      Heidi Rix                           Heidi Rix joined Mara Delta as Chief Operating Officer on 1 May 2016. Heidi brings 18 years of commercial and real estate
      Chief Operational Officer           experience and holds BComm LLB degrees with further studies in the real estate industry including an Advanced Diploma in
                                          Property Practice (cum laude). Heidi joins Mara Delta from the Broll Property Group where she was a Director of the Group and
      Bcom LLB                            held the position of Managing Director Investor Services with overall responsibility and accountability for the Asset Management,
                                          Property Management and Retail Leasing businesses. Prior positions held by Heidi include Director of Atterbury Asset Managers
                                          (Pty) Ltd and General Manager Rand Merchant Bank Properties (Pty) Ltd.

      Moira van der Westhuizen            Moira joined MaraDelta in May 2016 as the Chief Integration Officer. She holds a B Com (Honours) degree from the University of
      Chief Integration Officer           South Africa and is a qualified Chartered Accountant.
      Bcom (Hons), CA(SA)                 She has over 20 years of experience in finance, business and auditing, which included running her own business and then in 2005
                                          going into partnership as the Audit Partner in an Audit and Accounting practice. In 2008 she moved to Mauritius and worked for
                                          Investec Bank and later the CCI Group as the Group Financial Controller.
                                                                                                                                                                                   19
Management Team (in attendance)
Trevor Matthews Trevor has over 30 years industry experience beginning his career in 1979 as a property assistant, a position he held for six years, in
Senior Operations Asset Manager which he established the building blocks to a long and successful career in the sector. By 1985, he joined BanKorp Properties as a
manager of collections. Following this, Trevor joined Liberty Group Properties as the Leasing Manager. In 2001, he managed a R1.5
billion portfolio for Allan Gray Shopping centres, thereafter progressing to Canal Walk Management as the Leasing Manager. He
was the Retail Asset Manager of the Fountainhead Property Trust where he was responsible for the full asset management of a
retail portfolio of 10 shopping centres.
Mike Sewell Mike is a charted management accountant with over eight years’ international experience in real estate, having worked on a cross
Head of Acquisitions section of deal structures, asset sectors and jurisdictions. His previous position as Fund Finance Manager at Axa Real Estate
Investment Managers (London) centred on deals, managing fund finances, fund maintenance and tax structuring and investment
management strategies.
Chanel van Zyl-Swart Chanel joined MaraDelta in 2016 as a Country Risk Analyst.
Country Risk Analyst She holds a BComm with Law, as well as a BComm Honours Degree in Economics, both from the University of Stellenbosch. After
graduating, she joined the Department of Trade and Industry within South Africa as a Policy Analyst. Thereafter, she became a
Country Risk Analyst at the Development Bank of Southern Africa in 2010 where she specialized in economic development, political
risk and finance in Africa. She has a strong background in research, empirical analysis and statistical modeling in order to do in-
depth risk assessment in guidance of major infrastructure projects.
20Disclaimer
For professional advisers or Qualified Institutional Buyers only. This material is not suitable for retail clients.
Past performance is not a guide to future performance and may not be repeated. The value of investments and the income from them may go down as well as up and investors may not get back the amount originally invested.
The data contained in this presentation has been sourced by Mara Delta Property Holdings Limited (“Mara Delta”) and should be independently verified before further use. This presentation is intended to be for information
purposes only and it is not intended as promotional material in any respect.
The material in this presentation is not intended as an offer or solicitation for the purchase or sale of any financial instrument. The material is not intended to provide, and should not be relied on for, accounting, legal or tax
advice, or investment recommendations. Information herein is believed to be reliable but Mara Delta does not warrant its completeness or accuracy. No responsibility can be accepted for error of fact or opinion.
This presentation is restricted and is not for release, publication or distribution, in whole or in part, directly or indirectly, in or into the Australia, Canada, Japan or any other jurisdiction in which such release, publication or
distribution would be unlawful. This presentation is for information purposes only, does not purport to be full or complete, is subject to change and shall not constitute or form part of an offer or solicitation of an offer to
purchase, sell, issue or subscribe for securities in the United States of America or any in other jurisdiction nor shall there be any sale of securities in any jurisdiction in which an offer, solicitation or sale would be unlawful prior to
registration or qualification under the securities laws of any such jurisdiction. Any failure to comply with these restrictions may constitute a violation of securities laws of such jurisdictions.
The distribution of this presentation in certain jurisdictions may be restricted by law.
No action has been taken by Mara Delta or any of its affiliates that would permit an offering of securities or possession or distribution of this presentation or any other offering or publicity material relating to securities in any
jurisdiction where action for that purpose is required. Persons into whose possession this presentation comes are required to inform themselves about, and to observe, such restrictions.
Mara Delta securities have not been and will not be registered under the United States Securities Act of 1933, as amended (the "Securities Act"), and may not be offered or sold, directly or indirectly, in the United States of
America, absent registration or an exemption from, or transactions not subject to, the registration requirements of the Securities Act. Mara Delta does not intend to register its securities under the Securities Act or to conduct a
public offering of the securities in the United States of America. Should securities be offered in the future, in the United States of America, any offering of securities will be made only to qualified institutional buyers in
accordance with Rule 144 A under the Securities Act or in other transactions exempt from, or not subject to, the registration requirements of the Securities Act and applicable state or local securities laws. Outside the United
States of America, any future offering of securities will be made in accordance with Regulation S under the Securities Act.
In member states of the European Economic Area (“EEA”) which have implemented the Prospectus Directive (each, a “Relevant Member State”), this presentation is directed exclusively at persons who are qualified investors
within the meaning of the Prospectus Directive (“Qualified Investors”). For these purposes, the expression Prospectus Directive means Directive 2003/71/EC (and amendments thereto, including Directive 2010/73/EU, to the
extent implemented in a Relevant Member State), and includes any relevant implementing measure in the Relevant Member State.
In the United Kingdom this presentation is only being distributed to, and is only directed at, Qualified Investors who are (i) investment professionals falling within Article 19(5) of the UK Financial Services and Markets Act 2000
(Financial Promotion) Order 2005 (the “Order”); or (ii) high net worth entities falling within Article 49(2)(a) to (d) of the Order, or (iii) other persons to whom it may otherwise be lawfully communicated (all such persons together
being referred to as “relevant persons”). Persons who are not relevant persons should not take any action on the basis of this presentation and should not act or rely on it.
Nothing in this presentation should be viewed, or construed, as "advice", as that term is used in the South African Financial Markets Act, 2012, and/or Financial Advisory and Intermediary Services Act, 2002 and/or the
equivalent legislation in the United States of America.
This presentation contains (or may contain) certain forward-looking statements which reflect Mara Delta’s intent, beliefs or current expectations about the future and can be recognized by the use of words such as “expects,”
“plans,” “will,” “estimates,” “projects,” “intends,” or words of similar meaning. These forward-looking statements are not guarantees of future performance and are based on assumptions about Mara Delta’s operations and
other factors, many of which are beyond the Mara Delta’s control, and accordingly, actual results may differ materially from these forward-looking statements. Forward-looking statements contained in this presentation
regarding past trends or activities should not be taken as a representation that such trends or activities will continue in the future. Except as required by the JSE, the SEM or applicable law, Mara Delta expressly disclaims any
obligation or undertaking to release publicly any updates or revisions to any forward-looking statements contained in this presentation to reflect any changes in Mara Delta’s expectations with regard thereto or any changes in
events, conditions or circumstances on which any such statement is based.
21You can also read