ZAMBIA Tobacco Farmers Survey Report 2019 - American Cancer Society
←
→
Page content transcription
If your browser does not render page correctly, please read the page content below
AFRICA REPORTS

ZAMBIA
Tobacco Farmers Survey Report 2019
ii THE ECONOMICS OF TOBACCO FARMING IN ZAMBIA
SOURCES

Compiled by Lusaka: University of Zambia School of      This report was authored by:
Medicine and Atlanta: American Cancer Society.
                                                        Dr. Fastone M Goma – Principal Investigator, Centre for
Copyright ©2019 University of Zambia and the American   Primary Care Research, School of Medicine, University of
Cancer Society.                                         Zambia (UNZA). Zambia project leader.

                                                        Dr. Ronald Labonté – Professor and Distinguished
                                                        Research Chair, University of Ottawa.

                                                        Dr. Jeffrey Drope – Vice President, Economic & Health
                                                        Policy Research, American Cancer Society (ACS). Overall
                                                        project leader.

                                                        Ms. Qing Li – Scientist, Economic & Health Policy Research,
                                                        American Cancer Society

                                                        Mr. Richard Zulu – Research Fellow, Institute of Economic
                                                        and Social Research, UNZA (retired).

                                                        Mr. Evans Kangwa, Data Manager, Centre for Primary Care
                                                        Research, University of Zambia School of Medicine, UNZA.

                                                        The following members of the core team for the overall
                                                        project on the political economy of tobacco in Africa were
                                                        involved in conceptualizing the project, including the
                                                        survey instrument used in this report:

                                                        Ms. Adriana Appau (McGill University), Dr. Raphael
                                                        Lencucha (McGill University), Mr. Peter Magati
                                                        (International Institute of Legislative Affairs – Kenya), Dr.
                                                        Donald Makoka (Centre for Agricultural Research and
                                                        Development – Malawi) and Firman Witoelar (Australian
                                                        Natioanl University).

                                                        Research reported in this publication was supported by the
                                                        National Institute on Drug Abuse, the Fogarty International
                                                        Center, and the National Cancer Institute of the National
                                                        Institutes of Health under Award Number R01DA035158.
                                                        The content is solely the responsibility of the authors and
                                                        does not necessarily represent the official views of the
                                                        National Institutes of Health.

                                                        Suggested Citation: Goma FM, Labonté R., Drope J,
                                                        Li Q, Zulu R, Kangwa E. 2019. The Economics of Tobacco
                                                        Farming in Zambia: Tobacco Farmers Survey Report 2019
                                                        Lusaka: University of Zambia School of Medicine and
                                                        Atlanta: American Cancer Society.

                                                                                             THE ECONOMICS OF TOBACCO FARMING IN ZAMBIA   iii
TABLE OF
CONTENTS

TABLES & FIGURES                                              v

EXECUTIVE SUMMARY                                             1

INTRODUCTION                                                  2

CONTEXT                                                       4

RESULTS
     socio - demographic characteristics of household head
     sur vey respondents                                      6
     the economics of growing tobacco                         8
     why farmers grow tobacco                                18
     satisfaction with tobacco markets                       20
     food security                                           21
     child labour                                            22
     the harms from curing tobacco                           23
     future of growing                                       24
     alternatives to tobacco                                 26

CONCLUSION                                                   28

REFERENCES                                                   30

iv   THE ECONOMICS OF TOBACCO FARMING IN ZAMBIA
TABLE OF
CONTENTS

LIST OF FIGURES                                                                     TABLE 6
                                                                                    average sales for tobacco and other crops ( zmw )        -
FIGURE 1
tobacco farming sur vey study sites                                             5   former and current tobacco farmer by province                      16

FIGURE 2                                                                            TABLE 7
annual profit per acre         -    wave    1 sur vey                     12        mean difference in non - tobacco crop sales ( zmw ),
                                                                                    former tobacco farmers                                             16
FIGURE 3
annual profit household             - 2017     growing season              13       TABLE 8
                                                                                    average household resources ( zmw )    -   current and
FIGURE 4                                                                            former tobacco farmer , by province                                17
annual profit per kilogram              - 2017   growing season            14
                                                                                    TABLE 9
FIGURE 5                                                                            food security   -   former and current tobacco farmer              21
sources of income ( zmw )           -   former vs . current
tobacco farmers 		                                                             15   TABLE 10
                                                                                    child labour in the zambian tobacco sector                         22
FIGURE 6
ranked order of reasons for growing tobacco                                    18
FIGURE 7
recruitment into tobacco farming                                               18
FIGURE 8
satisfaction with tobacco selling                                              20
FIGURE 9
farmers considering switching to non - tobacco crops                           24
FIGURE 10
top reasons for switching from tobacco crops                                   25
FIGURE 11
farmers self - reported likelihood of future tobacco growing                   25
FIGURE 12
alternative crops considered                                                   26

LIST OF TABLES
TABLE 1
socio - demographic characteristics of household head
sur vey respondents                                                             6

TABLE 2
mean production , price and income , excluding extreme outliers                 8
TABLE 3
C ost   of   N on -L abour inputs                                               9
TABLE 4
median non - labour input costs , contract vs . independent farmer              9
TABLE 5
household labour , contract             &   independent tobacco farmers        11

                                                                                                                                 THE ECONOMICS OF TOBACCO FARMING IN ZAMBIA   v
vi THE ECONOMICS OF TOBACCO FARMING IN ZAMBIA
EXECUTIVE SUMMARY

TOBACCO IS A PRODUCT THAT WHEN USED AS SUGGESTED                 to be the most labour-intensive agricultural crop. When

BY THE MANUFACTURERS IT WILL KILL MORE THAN HALF                 incorporating a minimal economic value of unpaid family
                                                                 labour (an accepted method in agricultural economics
ITS USERS. REDUCING TOBACCO USE SHOULD THEREFORE                 to estimate the opportunity costs of any agricultural
                                                                 activity), nearly all Zambian smallholder tobacco farmers
BE A CORNERSTONE OF ANY GOVERNMENT’S PUBLIC                      lose income by growing the crop. Most tobacco farmers
HEALTH STRATEGY. YET TOBACCO CONTROL MEASURES                    would be better off putting their very hard work into other
                                                                 economic pursuits.
CONSISTENTLY FACE ENORMOUS OPPOSITION, OFTEN
FROM OPPONENTS USING ARGUMENTS WITH A SUPPOSED
                                                                 WHEN WE COMPARE CURRENT AND FORMER TOBACCO
ECONOMIC LOGIC. OUR CONTINUING STUDY ON THE
                                                                 FARMERS, THERE IS A STARK DIFFERENCE. ON AVERAGE
POLITICAL ECONOMY OF TOBACCO CONTROL AND TOBACCO
                                                                 THE HOUSEHOLD RESOURCES OF THE FORMER TOBACCO
FARMING IN ZAMBIA CHALLENGES THESE AGRUMENTS
                                                                 FARMING HOUSEHOLDS WERE ALMOST 75 PERCENT
WITH SOLID EMPIRICAL EVIDENCE.
                                                                 HIGHER THE YEAR AFTER SWITCHING COMPARED TO
One dominant economic argument is the alleged harm               THEIR NEIGHBOURS WHO HAD CONTINUED CULTIVATING
to smallholder tobacco farmers from tobacco control              TOBACCO LEAF. WHILE TOBACCO-FARMING HOUSEHOLDS’
policies. This argument has become one of the ubiquitous
reasons promoted by the tobacco industry and its allies for      GROSS INCOMES WERE TYPICALLY HIGHER ON AVERAGE,
governments to slow, stop, or even reverse tobacco control
efforts. Moving beyond the well substantiated logic that
                                                                 THEIR COSTS, BOTH DIRECT AND HOUSEHOLD LABOUR,
demand for tobacco leaf is driven by global, not simply          WERE SIGNIFICANTLY MORE THAN THE FARMERS WHO
country-level, consumption – hence Zambia’s tobacco
control efforts are likely to have little short-run effects
                                                                 HAD SWITCHED TO NON-TOBACCO CROPS AND OTHER
on tobacco farmers – it is becoming increasingly clear           LIVELIHOODS. THE FORMER TOBACCO FARMERS WERE
that tobacco farming is not a livelihood worth pursuing
for Zambians. In this report, we utilize a representative        ALSO PRODUCING SIGNIFICANTLY MORE FOR THEIR
survey of 515 tobacco farmers to examine these economic          HOUSEHOLD’S OWN CONSUMPTION— INCLUDING FOOD
livelihoods rigorously. Building on previous research on
tobacco farmers, this study also includes in the sample a        PRODUCTS— AVOIDING THE NEED FOR THESE HOUSEHOLDS
large sub-sample of former tobacco farmers, which permits
us to compare the livelihoods of the current and former
                                                                 TO PURCHASE THESE OFTEN COSTLY GOODS.
farmers.
                                                                 Zambia is a Party to the WHO Framework Convention on
The findings show that growing tobacco generally compares        Tobacco Control (FCTC), which compels Parties to help
poorly with other agricultural livelihoods for most              tobacco farmers to find viable alternative livelihoods
smallholder farmers. Our research results demonstrate that       (Article 17). The results of this research suggest strongly
most tobacco farmers who have signed contracts with leaf-        that finding and promoting alternative livelihoods for
buying companies to cultivate tobacco leaf are operating         tobacco farmers should be a development priority in
at a net loss. The farmers usually end up in debt to the leaf-   the coming years. This comes in serious and troubling
buying company, compelling them to grow tobacco again            contrast to the recent 7th National Development Plan for
the following season to pay back their debt, precipitating       Zambia, which specifically identified tobacco farming as
or continuing a long and generally losing annual cycle. To       a growth sector.
make this scenario even worse, tobacco growing appears

                                                                                                     THE ECONOMICS OF TOBACCO FARMING IN ZAMBIA   1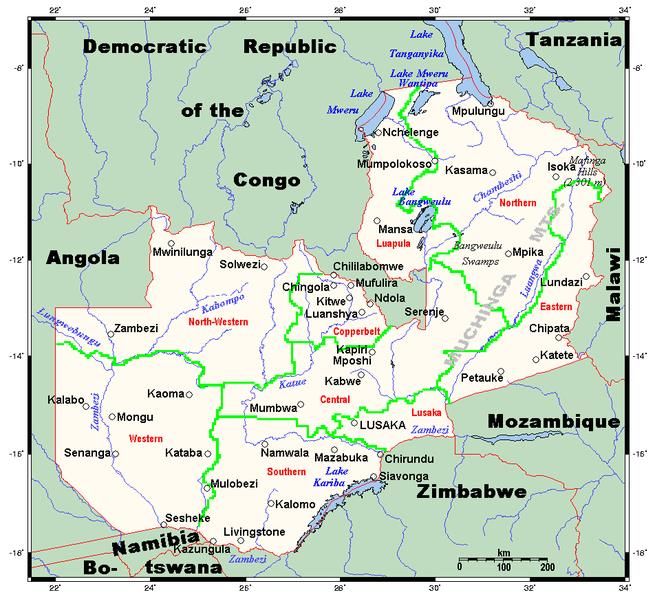
INTRODUCTION

Tobacco control remains one of the greatest public health          products, suggesting a major and potentially catastrophic
challenges of the first half of the 21st century. Scholars         shift (GYTS 2011; ITC 2015). 5 6 These percentages equate to
estimate that the number of tobacco-attributable deaths            more than one million adult smokers and more than 56,000
in 2018 to be more than seven million 1, and is projected          child and youth (
INTRODUCTION

Other studies back up the claim that tobacco creates a         Recognizing that tobacco farmers’ livelihoods must
net economic cost rather than gain, at both personal and       be taken into important account, the FCTC obligates
national levels. Buying tobacco instead of using resources     governments to assist in supporting tobacco farmers to
to obtain other vital goods and services like healthcare,      find viable alternative livelihoods (Article 17).
education, or healthy foods, for example, prevents families
from rising out of poverty (Chelwa and Van Walbeek,                Provision of support for economically viable
2014), thereby dampening economic development. To                  alternative activities Parties shall, in cooperation with
smoke daily 10 of the cheapest cigarettes available in             each other and with competent international and
Zambia, a Zambian of average income would have to                  regional intergovernmental organizations, promote,
spend nearly 20% of his or her income (tobaccoatlas.org).          as appropriate, economically viable alternatives for
Tobacco use also increases illness in smokers, leading to          tobacco workers, growers and, as the case may be,
loss in worker productivity, and imposes significant costs         individual sellers.
to the health system (both public and private) in treating
tobacco-related diseases, costs which might otherwise          Fulfilling this obligation is much more than just
be invested in healthier and more sustainable forms of         complying with the government’s legal commitment to
economic development.                                          this international treaty; it also addresses the Zambian
                                                               government’s commitment to a “healthy and skilled
In 2008, Zambia became a Party to the WHO FCTC,                working population that can meet the demands and
which compels Parties to implement a number of control         challenges of upper middle income development” as its
measures aimed at reducing tobacco use. As of early            most recent national development plan aims to achieve
2019, the Zambian government was considering enabling          by 2030.7 At present, there is only limited evidence-based
legislation that would help implement the treaty’s             information about tobacco farmers’ livelihoods in most
provisions. Despite the WHO identifying tobacco control        countries, which makes it harder for government policy-
as a public health ‘“best buy” it continues to face stiff      makers to counter the dominant narrative that tobacco
opposition in many countries, including Zambia. One            is essential to the economic livelihoods of smallholder
of the most common arguments against tobacco control           farmers. Building on our earlier 2015 survey and report,8
efforts is the alleged threat these efforts pose to the        this report presents findings from our second survey in 2017
economic livelihoods of tobacco farmers. Even though it        of smallholder tobacco farmers, systematically examining
is well established empirically that demand for tobacco        their economic livelihoods.
leaf is global and a country’s tobacco control efforts are
unlikely to affect tobacco farmers’ livelihoods in the short
term, this argument against tobacco control to resonate in
political and policy circles.

  “…on the international market, the demand [for tobacco
  leaf] is slightly going down, mainly associated with
  some of those lobbying, the anti-tobacco laws.” (P12)

  “Our friends in the tobacco sector have already gone to
  Agriculture and told them this [tobacco control] law is
  very bad, it’s going to ruin the economy.” (P9)

                                                                                                    THE ECONOMICS OF TOBACCO FARMING IN ZAMBIA   3
CONTEXT
than 10% in 2016 and 2017.14 This calls into question the
The Zambian economy continues to experience a shift oft-stated economic argument of tobacco’s importance in
away from agriculture as its main engine of growth. generating FOREX made by many of our key informants
Agriculture, in general, makes only a small contribution working in the Zambian tobacco industry (P4, P5, P8, P9),
to Zambia’s Gross Domestic Product (GDP), estimated at since the FOREX value of tobacco imports essentially
just 4.8% in 2017, 9 down from 8.5% in 2014 and from 16% cancels out the FOREX value of tobacco exports.
in 2001.10 Not only has agriculture’s contribution to GDP
declined precipitously, so has its value-added labour Publicly-stated government policy continues to promote
contribution to the Zambian economy (IAPRI 2017). These the narrative that tobacco growing is essential to the
declines represent broader structural changes in the livelihoods of smallholder farmers and a necessary element
economy. These structural changes, however, have not in poverty reduction. Indeed, it is presented as such in
led to increased growth in manufacturing or value-added the latest Zambian economic development plan, which
production (which is one of the key economic development foresees increases in both tobacco leaf production and
goals of the present Zambian government), but rather a value-added leaf processing and cigarette manufacturing.
transition from rural agriculture to low-paying and insecure In the absence of good empirical data for these claims,
service sector work in urban centers. This phenomenon we originally set out in 2015 to examine tobacco farmer
is not unique to Zambia and is broadly characteristic of livelihoods using a major individual-level economic
many African countries. Importantly, however, and despite survey. Our first survey wave was implemented in 2015 and
the declining economic importance of agriculture to the found that smallholder tobacco farmers were either losing
Zambian economy, almost half (48.9%) of the population’s income, or not earning enough to justify its continuing
livelihoods in 2016 were still based on agriculture.11 cultivation. Both to validate and build upon these findings,
we conducted a follow-up second wave survey in 2017.
It is estimated that 10,000 – 12,000 smallholder farmers Both surveys were led by researchers at the University of
continue to grow tobacco as a cash crop. Given an average Zambia’s School of Medicine, in collabouration with the
household size of approximately 6.7 people, 67,000 to American Cancer Society. Our 2015 survey sample was 497
80,400 Zambians have some measure of direct reliance farmers. In the follow-up 2017 survey, we interviewed 515
on tobacco farming, bearing in mind that most tobacco from the same tobacco-growing districts that we visited in
farmers also grow other crops. Economic activities in one 2014. We interviewed both farmers who were continuing to
sector are known to have ‘ripple effects’ in other sectors grow tobacco (335) and those who had stopped growing
(backwards and forwards linkages), or multipliers, often tobacco (180). Data collection interviews with 515 farmers
measured as ‘social accountability matrices’ (SAMs). No were conducted during the period, March/April, 2017.
estimates of SAMs for Zambia exist, however, making it Training in data collection for 10 research assistants was
difficult to assess claims of the total number of individuals conducted for 3 days prior to the fieldwork. The training
whose livelihoods depend to some extent on tobacco included a field pre-test component after which the survey
farming or manufacturing; although recent increases in instrument was modified to account for concerns raised.
cigarette manufacturing in Zambia claim to provide over
170 new jobs.12 13 As illustrated in Figure 1, the study was conducted in six
districts of Zambia where tobacco is mostly grown by
Although tobacco continues to contribute to the value small- to medium-scale farmers: Chipata and Lundazi in
of agricultural exports, it remains quite low in its overall Eastern Province; Mkushi and Serenje in Central Province;
economic contribution. Despite recent comments by the and Kalomo and Choma in Southern Province.
Chair of the Tobacco Board of Zambia (TBZ) that tobacco
contributes 3% to Zambia’s GDP (based on the peak year As we did with our previous survey, we also convened focus
of tobacco sales in 2013), more recent data estimate its group discussions (FGDs) with tobacco farmers in four of
contributions at between 0.3% and 0.4% (P11, P12). The Zambia’s tobacco-growing regions, in which 57 farmers
value of tobacco exports is only marginally more than the participated. Some of their comments are included in this
value of tobacco imports, with tobacco export earnings report’s key findings.
outpacing value of the tobacco imports by a margin of less
4 THE ECONOMICS OF TOBACCO FARMING IN ZAMBIACONTEXT
Figure 1 – Tobacco Farming Survey Study Sites
Mkushi
Choma
reference to marketing of tobacco (considering efforts to legislate
TOBACCO PROMOTION OR TOBACCO CONTROL? tobacco control efforts) is of some concern given that in 2018
two new cigarette manufacturing plants opened in the Lusaka
In 2017, the Zambian government released its Seventh National Multi-Facility Economic Zone. These plants took advantage of
Development Plan, with the goal of achieving World Bank upper- Zambian government incentives (zero percent tax for five years)
middle income country status by 2030, primarily by diversifying that, during the opening of one of the plants, officials explained
away from copper to greater value-addition in its agricultural were “in line with the Seventh National Development Plan.”15 The
exports. The plan identifies tobacco production as “a very British American Tobacco Zambia factory is estimated to produce
lucrative investment opportunity in the country because of its 5 million cigarettes daily; the Zambian-owned Roland Imperial
profitability compared to other agricultural crops. It further states Tobacco Company states that it will produce 20 million cigarettes
that tobacco “has great potential to contribute to the growth of daily. While much of the output will be exported to neighboring
the economy through employment and wealth,” although no countries, both companies are also targeting, with the intent of
references or studies are cited for these claims. One of its proposed growing, the domestic market. Any value in the 170 new jobs
“strategic interventions” is to “Provide an enabling policy created in cigarettemanufacturing will be quickly overwhelmed
environment to facilitate involvement of the private sector in the by the health and economic damages created by increased
marketing and processing of tobacco” (REF 7th NDP p.137). The domestic tobacco use.16
THE ECONOMICS OF TOBACCO FARMING IN ZAMBIA 5RESULTS
SOCIO-DEMOGRAPHIC CHARACTERISTICS OF
HOUSEHOLD HEAD SURVERY RESPONDENTS
Table 1 presents many of the key background characteristics of farming. Although these characteristics are roughly similar
the household head of the interviewed tobacco-farming and to those from our earlier survey, there are some differences.
former tobacco-farming households. Most of the household A higher proportion of household head in our second wave
head interviewed were male. It is important to note, however, survey are male (93% vs 80%), more likely to be 36 years or
that farming is most commonly a family activity, in which older (76% vs. 60%), and less likely to be single (5% vs. 11.5%).
both males and females participate; the preponderance of The notable difference in reported age coheres with the
male respondents therefore does not accurately represent narrative from one of our informants that youth are less likely
the proportion more broadly of who work on tobacco farms. to continue farming (P1), leaving an aging cohort of active
Most respondents were married, between 36 and 60 years old, smallholder farmers. An addition to our second wave survey
and had primary schooling. Only 25 respondents indicated distinguished current from former tobacco farmers to allow
work outside of their farms, indicative that the most common us to explore why some farmers stop growing tobacco.
industry 1 industry 2 Solutions 1
primary occupation of respondents was crop and livestock T1. SOCIO-DEMOGRAPHIC CHARACTERISTICS OF HOUSEHOLD HEAD SURVERY RESPONDENTS
CHARACTERISTICS CURRENT (N=335) FORMER (N=180) TOTAL (N=515)
PROVINCE
TABLE 1
Socio-Demographic
Central 46 13.7%
14+86 53 29.4%
29+71 99 19.2%
20+80
34.0%+34+66 52.2% 52+48+
Characteristics of Eastern 114 94 208 40.4%
+40+60
18.3% 18+82
Household Head Southern 175 52.2%
52+48 33 208 40.4%
40+60
Survey Respondents* GENDER
Male 292 92.4%
+ +7
93 150 94.3%
94+6 436 93.2%
+ +7
93
Female 24 7.6%
+8+92 9 5.7%
6+94 32 6.8%
7+93+
AGE (YEARS)
< 21 2 0.6%
99+0 3 1.9% 2+98 5 1.1% 1+99
18.2% +19+81 +24+76
21-35 82 26.6%
27+73 29 111 23.7%
64.9%65+35 67.9% 68+32
36-60 205 108 313 65.9%
66+34
61+ 27 8.5%
+9+91 19 12.0%
12+88+ 46 9.7%
10+90
MARITAL STATUS
Single 19 6.6% +7+93 3 2.0% 3+97 22 5.2% +5+95
88.9%90+10 89.8% 90+10
Married 256 136 90.7%
91+9 392
4.5% 5+95 5.5% 6+94
Others 13 11 7.3%
8+92 24
EDUCATION
Not yet or no schooling 26 8.2%
8+92 14 8.8% +9+91 40 8.4% + +92
8
Primary 175 55.4% 56+44 105 66.0% 66+34 280 59.0% 59+41
34.4% 35+65 31.0% 31+69
Secondary 109 38 23.9%
24+76 147
College or University 6 1.9%
2+98 2 1.3%
2+98 8 1.7%
2+98
*Numbers indicate total responses to each category of question. Not all surveyed farm households provided answers to rcentages are based on total responses for each category of data, and not on the total sample.
6 THE ECONOMICS OF TOBACCO FARMING IN ZAMBIARESULTS
76 %
OF TOBACCO FARMERS
WERE ON CONTRACT
WITH A LEAF-BUYING
COMPANY.
CONTRACT VS. INDEPENDENT TOBACCO FARMERS
The majority of current tobacco farmers in the survey A slightly lower percentage (68% or 239 out of 354) reported
(269 out of 354, or 76%) were on contract with a leaf- having a written contract, though only 177 (50%) of those had
buying company. This figure is similar to that found in our a copy. In terms of the type of tobacco cultivated, 54.2% (13
previous survey (73.6%). Notably, the Tobacco Board of out of 24) of independent farmers and 68.7% (101 out of 147)
Zambia reports that the figure is closer to 90 percent. The of contract tobacco farmers grew Virginia tobacco. All but
contract arrangement provides farmers with the required 39 of the remaining contract and 10 independent farmers
agricultural inputs at the start of the season with no up-front grew Burley tobacco. On average, it took both types of
payment, and a guaranteed buyer for their product at the farmers a little more than 8 months to produce the tobacco.
end of the season, although not a guaranteed price or
specified quantity to be purchased. The costs of these inputs
are deducted from the value of their sales at the end of the
season. Three quarters of our surveyed contract farmers
(156 out of 208 who answered this question) reported
that they were adequately informed about their contract.
THE ECONOMICS OF TOBACCO FARMING IN ZAMBIA 7RESULTS
THE ECONOMICS OF TABLE 2
Mean Production, Price and Income, Excluding
GROWING TOBACCO Extreme Outliers
AVERAGE
QUANTITY REPORTED TOBACCO
PRICE
SOLD (KG) INCOME(ZMW)
(ZMW)
In this section, we examine the central dynamics of tobacco
farmers’ economic lives. We begin with an examination n 129 125 129
of their income. Note that income alone is an insufficient mean 1699.7 25.9 14465.9
economic indicator because it does not always accurately Contract Framer
reflect the overall economic situation of the farming meadian 1068 23 10000
households. This is largely because there are typically n 21 21 21
significant costs to tobacco farming. Thus, it is imperative
Independent mean 822.7 22.7 8391.4
to generate accurate cost calculations to combine with Farmer
the income calculations. Major costs include not just the meadian 700 23.6 4800
obvious physical inputs such as seeds, fertilizers, and
agricultural chemicals, but also the large amount of labour n 150 146 150
necessary to cultivate the crop. It is therefore critical to mean 1576.9 25.5 13615.5
move beyond simple income calculations and consider
Total meadian 1000 23 8820
both the revenue generated by selling tobacco leaf and the
total costs of production.
THE RESULTS DEMONSTRATE THAT
CONTRACT FARMERS WERE TYPICALLY SELLING
MORE TOBACCO THAN THEIR INDEPENDENT
COUNTERPARTS IN TERMS OF WEIGHT AND
SALES VALUE
Table 2 presents data on the mean and median quantity
sold, price per kilogram, and the sales for the full prior
growing season, amongst those farmers who provided
these figures, after removing the extreme outliers (n=150).
We show these figures for both contract and independent
tobacco farmers. The results demonstrate that mean and
median contract farmers were typically selling more
tobacco than their independent counterparts in terms of
weight and sales value. The mean contract farmer sold
14,465 ZMW worth of tobacco leaf, significantly more than
the mean independent farmer who sold 8,391 ZMW worth
of leaf.. T 2. MEAN PRODUCTION, PRICE AND INCOME, EXCLUDING EXTREME OUTLIERS
industry 1 industry 2 Solutions 1
8 THE ECONOMICS OF TOBACCO FARMING IN ZAMBIARESULTS
COSTS OF TOBACCO FARMING
TABLE 3
NON-LABOUR COSTS Cost of Non-Labour Inputs
MEDIAN OF MEAN OF TOTAL
It is well established in the literature that tobacco farming TOTAL NUMBER OF TOTAL COST OF COST OF THE
is both input- and labour-intensive. Accordingly, we OBSERVATIONS THE AMOUNT AMOUNT USED
ITEM USED (ZMW) (ZMW)
examine these dynamics in depth. Farmers’ non-labour
costs are presented in Tables 3 and 4. Note that the input Seed 132 3243 204
costs included are the principal variable costs such as Water Cans 190 80 88
tools, fertilizer, herbicide, pesticide and seeds, but not the
Pesticides (chemicals) 88 225 289
fixed cost such as land rental, although land rental was not
Herbicides 6 208 218
a large part of most farmers’ production.
Fertilizer 167 2160 2617
In Table 3, the first column identifies the non-labour input
Hoes 215 80 108
item, and the second column the number of observations
(farmers who provided information on each cost item). Flue Curing Wood 141 300 325
The third column is the median cost and the final column
is the mean (average) cost of farmers who acquired the
item. There is a further 2 percent levy from the government
on tobacco leaf sales. This overall amount is above what an
average small-scale tobacco farmer can afford as working
capital to venture into tobacco farming, which accounts for
the attractiveness of entering into a contract.
T 3. MOST OF NON-LABOUR INPUTS
industry 1 industry 2 Solutions 1
TABLE 4
Table 4 examines the cost of inputs per kilogram of
tobacco leaf produced. The results are striking: despite Median Non-Labour Input Costs, Contract
the attractiveness of contracts because they provide a vs. Independent Farmer
form of credit to the farmers, the non-labour input costs
per kilogram of tobacco are substantially higher for
contract than for independent farmers. T 4. MEDIAN NON- INPUT COST PER KG
industry 1 industry 2 Solutions 1
n QUANTITY SOLD (KG)
LABOUR INPUT COSTS, CONTRACT VS. INDEPENDENT FARMER (ZMW)
Contract Farmer 130 1699.7 18.9
Independent Farmer 20 822.7 3.9
TOBACCO FARMING IS BOTH INPUT- AND
LABOUR-INTENSIVE
THE ECONOMICS OF TOBACCO FARMING IN ZAMBIA 9RESULTS
HIRED LABOUR COST
Despite three quarters of the surveyed contract farmers
stating that they were adequately informed about their
contracts, a large number of these farmers were unable to Among current tobacco farmers, 68% of contract farmers and 59% of
tell us the price of the inputs, most of which would have independent farmers used hired labour for tobacco farming, while
been provided by the leaf-buying companies. Less than only 30% of them hired labour for farming other crops. This last
half of the contract farmers (133 of 269) knew the price figure is the same (30%) as the number of former tobacco farmers
of their pesticides, and only 33 knew the price of their who similarly hired labour to help farm their non-tobacco crops.
herbicides. This dynamic is significant and problematic
since these are two of the costliest inputs according These figures suggest that tobacco growing is labour intensive,
to those farmers who did know the prices (Table 3). and are consistent with other research findings,17 and also with
Although not all tobacco farmers in our focus groups how the tobacco farmers in Zambia themselves describe their
thought their input prices were unreasonable, most efforts:
complained that the costs charged by the companies
were too high, that “retailers…sell chemicals…cheaper “labour is too much,” “growing tobacco…is too demanding,”
than those offered by tobacco companies.” Others “it is a heavy job,” “is very demanding, requires a lot of labour.”
complained that “for chemicals we don’t know [the
prices],” or that “certain deductions remain hidden until Unlike contract farmers, independent farmers, having to cover the
the time of sales,” leading one farmer to conclude simply costs of their own start-of-season inputs, may be more reluctant
that “it is difficult to know how much money you have to expend as much on hired labour, which could account for
spent growing the tobacco.” None of the farmers in one of the reported difference between the two groups. The difference
our focus groups had read or knew the contents of their between the two groups is more striking when we consider hired
contract, and complained that if one of the farmers in labour in terms of average number of days, or average number of
their tobacco cooperative defaults on paying the cost of hours per kg of tobacco. Contract farmers averaged 378 (S.E.=211)
their inputs, this liability is passed on to other members days of hired labour, or 5.1 hours per kg; while independent
of their cooperative. Notably, the leaf-buy companies are farmers averaged only 146 (S.E.=27) days of hired labour, or 1.2
setting up these groups, which is essentially transferring hours per kg. The difference is statistically significant. However,
all of the risk of cultivating tobacco to the farmers, while tobacco extension officers note the relationship between this
the leaf-buying companies have little or no risk. lower level of labour intensity and the comparatively poor quality
and yield of the tobacco from many independent farmers.
“[T]hey (the companies) do not tell us those things. What is also important to note is tobacco farming, relative to
They only tell us [these things] after we’ve grown the farming other crops, has very high input costs, even before
tobacco.” considering the value of household labour. Our survey found that
tobacco farmers spent an average of 3,958.3 ZMW on farming all
crops including tobacco, while former tobacco farmers only spent
an average of 1,399.8 ZMW on farming their non-tobacco crops.
LABOUR COSTS
To determine more accurately farmers’ costs and
therefore their profits, it is critical to examine their labour
“LABOUR IS TO MUCH”
costs. There are two main sources of labour costs: hired
and household. We begin with hired labour costs.. “GROWING TOBACCO...IS
TOO DEMANDING”
10 THE ECONOMICS OF TOBACCO FARMING IN ZAMBIARESULTS
HOUSEHOLD LABOUR COST TABLE 5
Household Labour, Contract & Independent
Tobacco Farmers
It is often argued that household labour should not be
considered a ‘cost’ since family farms have historically often
relied upon family labour. But it is now widely accepted
that family labour can also represent an opportunity cost in MONTHS OF HOURS PER HOURS PER KG
terms of alternative earning possibilities (which admittedly DURATION HOUSEHOLD
may be limited in some rural Zambian communities) and, Contract 8.8 4701.569 10.4
at a minimum and given the extent of labour involved
in tobacco farming, is a legitimate measure of a farming
Independent 7.7 4495.439 6.7
household’s net return on investment.18 19 20 The results Total 8.4 4667.764 9.9
presented in Table 5 suggest that the number of hours of
household labour to produce a kilogram of tobacco leaf
is high at more than 10.4 hours for contract farmers (less
for independent farmers, though this difference is not
statistically significant). Incorporating household labour
costs into the equation renders a bad economic situation for
tobacco farmers much worse. T 5. HOUSEHOLD LABOUR, CONTRACT &
industry 1 industry 2 Solutions 1
INDEPENDENT TOBACCO FARMERS
“LABOUR IS TOO MUCH,”
“GROWING TOBACCO…IS
TOO DEMANDING,” “IT IS
A HEAVY JOB,” “IS VERY
DEMANDING, REQUIRES A
LOT OF LABOUR.”
THE ECONOMICS OF TOBACCO FARMING IN ZAMBIA 11RESULTS
PROFIT: PERCEIVED AND ADJUSTED FIGURE 2
Annual Profit per Acre - Wave 1 Survey
While gross income and costs are vital measures, putting
the two together to examine profits is arguably more useful Annual Profit per Acre Wave 1 Survey
in terms of understanding the overall state of farmers’ ZMW 5,000
livelihoods. In our Wave 1 survey we had accurate data on
1295.4
the size of farms for both contract and independent farmers.
We were able to combine the revenue and input cost data ZMW 0
to calculate average profits per acre, effectively the total
cash revenues from selling tobacco leaf minus all input -1627.8
costs. We estimated these profits for two scenarios, in the -ZMW 5,000 -4301.9
first (the perceived profit) we excluded household labour
while in the second (adjusted profit) we monetized the
household labour as an input cost, using the government’s
-ZMW 10,000
official wage for domestic workers. There is no official
government agricultural minimum wage, but we argue that
the domestic wage is a reasonable proxy because the skill -13182.2
-ZMW 15,000
level of these two categories of jobs is similar and because
Profits including value of household Profits excluding value of household
there is ample evidence that many rural workers have labour labour
recently migrated to towns and cities for precisely these
types of jobs.21 In the original report, we used a shorter Independent Contract
work month (23 days), which translated into a higher
minimum wage) and reported the profits in US, but in this
report we recalculated using the hourly wage 3.646 Zambia
Kwacha in the legislation, and report in Zambian Kwacha
(ZMW). In Figure 2, we observe that in the 2015 growing
season, before including household labour, independent
tobacco farmers on average were making a small profit
of 1,295 ZMW per acre while contract farmers on average
were facing a small loss of 1,627.80 ZMW per acre. When
we incorporated household labour, both sets of farmers
on average were losing significantly: 4,301.9 ZMW per WHEN WE INCORPORATED HOUSEHOLD LABOUR, BOTH
acre for independent farmers and 13,182.2 ZMW per acre SETS OF FARMERS (INDEPENDENT AND CONTRACT) ON
for contract farmers. FIG 2. ANNUAL PROFIT PER ACRE - WAVE 1 SURVEY.
industry 1 industry 2 Solutions 1
AVERAGE WERE LOSING SIGNIFICANTLY.
12 THE ECONOMICS OF TOBACCO FARMING IN ZAMBIARESULTS
FIGURE 3
As we noted in our Wave 1 survey report, these figures Annual Profit per Household - 2017 Growing
differ from the gross margins reported by Tembo and Season
Sitko,22 which used different years than our own study
(including years when tobacco did well in both quantity
produced and overall sales values) and also incorporated
Annual Profit per Household Wave 2 Survey
data from medium- and some large-scale producers. 0.0
Our study focused only on smallholder tobacco farmers. -219.3 -1301.7
-5000.0
When accounting for the family labour cost of tobacco,
-10000.0
farmers’ income losses are striking; but even considering
only direct input costs, contract farmers lose income -15000.0
ZMW
(despite the cash they might receive at some point in the -16875.5
-20000.0
contract relationship with the leaf-buying company) while -19267.5
independent farmers make only a tiny profit. -25000.0
-30000.0 -27170.7
We were unable to estimate farm acreage in our Wave -31065.8
-35000.0
2 survey and could not undertake the same per acre
analysis. We were able to make a similar estimation, Independent Contract
however, based on profit per farming household, and Profits including value of household labour(minimum wage)
per kilogram of tobacco. We again compare contract and Profits including value of household labour(hired labour wage)
independent tobacco farmers. In Figure 3, we observe Profits excluding value of household labour
that for both contract and independent tobacco farming
households, without incorporating a value of household
labour, the average household does a little worse than
breaking even (-1,301.7 and -219.3 ZMW respectively). As
we discuss above for the Wave 1 survey, in addition to
these gross margins, we also recalculate profits assigning
reasonable values for household labour. As we did above,
we first use the minimum wage of a domestic worker and
the losses per household are significant: -19,267.5 ZMW
for contract farmers and -16,875.5 ZMW for independent
farmers. Because the minimum wage for domestic WHEN ACCOUNTING FOR THE FAMILY LABOUR
workers had not been adjusted since 2012, we expect COST OF TOBACCO, FARMERS’ INCOME LOSSES
this is a significant undervaluation of the farmers’ labour,
so we recalculated using the average wage paid by the ARE STRIKING.
surveyed farmers to their hired farm help. In other words,
this value would approximate almost perfectly what a
farmer could have made if they had instead worked on
a neighbouring farm. The farmers were paying their help
more than the 2012 minimum wage. When we recalculated
the independent farmers were losing 27,170 ZMW per
household on average, whereas the contract farmers
were losing slightly more at 31,065.8 ZMW per household
on average. FIG 3. ANNUAL PROFIT PER HOUSEHOLD - 2017 GROWING SEASON.
industry 1 industry 2 Solutions 1
THE ECONOMICS OF TOBACCO FARMING IN ZAMBIA 13RESULTS
FIGURE 4
Figure 4 presents a similar scenario for profits per Annual Profit per Kilogram - 2017 Growing Season
kilogram. Without incorporating household labour,
independent farmers are making a very small profit (0.3 Annual Profit per Kilogram of Tobacco
ZMW per kg) whereas contract farmers are losing some 30.0
(-7.3 ZMW per kg). Again, like we observe above for per 0.3
0.0
household calculations, the losses are much greater when -7.3
-30.0
we include household labour. Using the very conservative -26.6
ZMW
2012 domestic worker minimum wage, the losses are -26.6 -60.0 -44.5
ZMW/kg for independent farmers and -74.5 ZMW/kg for -90.0 -74.5
contract farmers. Using the more accurate measure of -120.0
what the farmers were paying their own hired farm help, -119.3
-150.0
the losses are -44.4 ZMW/kg for independent farmers and
Independent Contract
-119.3 ZMW/kg for contract farmers. FIG 4. ANNUAL PROFIT PER
Profits including value of household labour (minimum wage)
KILOGRAM - 2017 GROWING SEASON - industry 1 industry 2 Solutions 1
Profits including value of household labour(hired labour wage)
Profits excluding value of household labour
Although the actual amounts (in ZMW) are not directly
comparable between the two survey waves, or between
the two different estimations in Wave 2, what is consistent
is that most tobacco farmers appear to be operating at
a net loss, and notably so when considering household TOBACCO, OTHER CROPS, AND OFF-FARM ECONOMIC ACTIVITIES
labour, no matter how we calculate it. A possible
criticism of our use of monetized household labour in
both survey waves is that, while an accepted estimation Tobacco is rarely, if ever, the single crop grown by smallholder farmers, as
practice, it assumes the presence of alternative income one of our informants noted of farmers’ decision-making:
sources for household members (i.e.,“opportunity costs”
in economics). As one of our focus group farmers in “…how do I actually fare in terms of tobacco? How do I fare in terms
Wave 2 noted, a comment shared by several focus group pomegranate, [or] in terms of blueberries? I need to not rely on one
participants: particular aspect [crop].” (P8)
“We have no jobs in Zambia. Therefore we have gone In fact, cultivating other crops is a crucial economic component of most
into tobacco.” households’ wellbeing both in terms of crops to sell and also crops to
consume by the household. Similarly, many farmers participate in off-farm
But there is widespread and varied agricultural activity
economic activities such as non-agricultural businesses and paid employ-
throughout the country and at very least finding casual
ment. These dynamics are often overlooked by analysts examining rural
farm employment on larger farms is a reliable possibility
livelihoods in Zambia, but our research demonstrates unequivocally that
for smallholder farmers. Furthermore, the potential earn-
they are often crucial parts of farming households’ economic lives.
ings from non-tobacco crops (described below) and the
continued involvement of children as part of household
labour in tobacco cultivation (also described later) cer-
tainly challenge the dominant poverty-reduction narrative
of tobacco farming. Given excluding household labour,
tobacco growing reprents, on average, a net loss for most
tobacco farmers, contradicting empirically the dominant
tobacco narrative expressed by the tobacco companies,
some government officials, and even some tobacco farm-
ers themselves. Such evidence also begs the question: if
returns from tobacco farming are so low as to even be
negative, and especially so when considering the oppor-
tunity costs of household labour, why do farmer still grow
the crop? This is a question we explore two sections below.
14 THE ECONOMICS OF TOBACCO FARMING IN ZAMBIARESULTS
FIGURE 5
In Figure 5, we report on how sources of income differed Sources of Income (ZMW) – Former vs. Current
between current and former tobacco farmers. Based Tobacco Farmers
only on the income received by the time of the survey
implementation and including only those incomes that
averaged greater than 50 ZMW, on average, former tobacco Other
farmers reported almost twice as much average income Artisanal Skills
from non-tobacco crops as current farmers, and about Pension
20% more income from livestock. Perhaps surprisingly, Gifts/Remittainces
considering how labour-intensive tobacco farming is, Land Rentals
current tobacco farmers reported an average of almost Petty Trading/Business
5 times more income from casual labour compared to Beer Brewing
former tobacco farmers, but less than a third earned from Casual Labor
business or petty trading. Evidence from Focus Group Formal Employment
Discussions suggests that tobacco farmers often work Natrual Resources Sales
on each other’s farms during busy times (both paid and Livestock Production
in-kind exchanges), which might help to explain this Other Crop Sales
dynamic. Former tobacco farmers received proportionately Tobacco Sales
more gifts and remittances, as well as from beer brewing. 0 500 1000 1500 2000 2500 3000 3500 4000 4500 5000
We urge caution in interpreting the significance of these Zambian Kwacha (ZMW)
differences, since the reported earnings at the time of
Current Farmer Former Farmer
the survey do not necessarily include all annual income,
since some tobacco and other crop earnings were not
realized until after the survey. It does suggest, however,
that former tobacco farmers are increasing the diversity
of their revenue streams more than farmers who continue
to grow tobacco. FIG 5. SOURCES OF INCOME (ZMW) - FORMER VS. CURRENT
industry 1 industry 2 Solutions 1
TOBACCO FARMERS -
FORMER TOBACCO FARMERS ARE INCREASING THE
DIVERSITY OF THEIR REVENUE STREAM MORE THAN
FARMERS WHO CONTINUE TO GROW TOBACCO.
THE ECONOMICS OF TOBACCO FARMING IN ZAMBIA 15RESULTS
TABLE 6
Our second wave survey found that almost all farmers Average Sales for Tobacco and Other Crops
(97.3%) are growing other crops, a figure almost identical
(ZMW) – Former and Current Tobacco Farmer by
to that of farmers in our first wave survey who indicated
crops other than tobacco as important sources of their Province
livelihoods (96.4%). Maize still tops the list of livelihood
crops, for both current and former tobacco farmers.
Tobacco ranks second, followed by soy beans. CURRENT FARMER FORMER FARMER
Region Other Crops Tobacco Other Crops
We attempted to further our understanding of these
crop and income dynamics with a crude analysis of Central 7449.4 4648.8 5376.0
average sales, repeating the caveat from the discussion
above that sales do not incorporate costs, which is vital Eastern 7354.6 4459.5 3134.4
to understanding the farmers’ overall livelihoods. When South 5169.6 5648.4 3234.7
asked to estimate revenue from all crops in the previous
Total 6453.5 4947.3 3875.9
year, notable differences emerge between current and
former tobacco farmers, particularly when disaggregating
by province (Table 6). In all three provinces, tobacco
farmers on average sold more non-tobacco crops than
their former tobacco farming neighbors. We speculate
that this was often in large part due to land size with larger TABLE 7
landholders “hedging” by growing tobacco and a wide Mean Difference in Non-Tobacco Crop Sales
portfolio of other crops. T 6. AVERAGE SALES FOR TOBACCO AND OTHER
industry 1
CROPS (ZMW) – FORMER AND CURRENT TOBACCO FARMER BY PROVINCE
industry 2 Solutions 1
(ZMW), Former Tobacco Farmers
CENTRAL (N=97) EASTERN (N=188) SOUTHERN (N=188)
Maize 240.4 -910.9 -18025.3
Both former and current tobacco farmers have wide crop
portfolios with many farmers cultivating multiple crops in a Groundnuts 87.5 308.1 3393.8
growing season. Depending on the region, former tobacco Soybeans 487.5 1660.6
farmers have taken to several major crops to sustain their
Sweet potatoes 2775 -333.3
livelihoods. Table 7 examines these dynamics, wherein
a positive value indicates how much more, on average, Cassava -957.5 -525
a former tobacco farmer is growing of a certain crop Pigeon peas -1200
compared to current tobacco farmer average (or those
who grow); a negative value indicates how much more the Banana -3800
average current tobacco farmer is growing of a certain crop. Beans 1700 -1000 -600
In Central Province, non-tobacco sales for former tobacco
Sunflower 4000 -1595 1935.7
farmer were mostly driven by switching to sugarcane and
vegetables, followed by sunflower and soybeans. In Eastern Sugarcane 13000
province the predominant non-tobacco crop was cotton, Popcorn 713
followed (somewhat distantly) by soybeans, but notably, it
was largely tobacco farmers who were also growing this Vegetables 8000
crop. In Southern province, it was maize and cotton, but Tomatoes -366.7 -487.5
again cultivation was dominated by farmers who were also
growing tobacco. T 7. MEAN DIFFERENCE IN NON-TOBACCO CROP SALES (ZMW), Cotton -11774.3 -6750
industry 1 industry 2 Solutions 1
FORMER TOBACCO FARMERS.
16 THE ECONOMICS OF TOBACCO FARMING IN ZAMBIARESULTS
TABLE 8
To compare tobacco and non-tobacco farming households’ Average Household Resources (ZMW) – Current
economic livelihoods more meaningfully, in Table 8, we and Former Tobacco Farmer, by Province
introduce an examination of overall household resources.
The household resource allocation is arguably a more
sophisticated measure of household economic activity
CURRENT FARMER FORMER FARMER
in low- and middle-income countries (LMICs) because
it permits us to examine household own-consumption.
Economists have long acknowledged that many LMIC Region n Mean n Mean
households, particularly rural ones, produce significantly
for the household’s own consumption, which means that Central 16 740.6 43 5045.3
they do not need to purchase the goods or services they
Eastern 14 2095.1 71 2166.7
are consuming.23 Because households not producing
for own-consumption must purchase such goods or South 19 3171.4 25 4922.6
services, it is therefore critical to assign an appropriate Total 49 2070.1 139 3552.9
value to these goods and services and incorporate them
into the calculation of the household’s broader economic
production. Accordingly, total resource is the income from
all crops sold (tobacco and other) plus any wages earned,
plus the value of crops harvested and consumed by the
household (“own” consumption), less the costs of the
physical and other major direct inputs (e.g., seeds, fertilizer,
agricultural chemicals and hired labour). In brief, former
tobacco farmers’ household resources exceeded those of
current farmers, sometimes by a wide margin. The average
household resources across all former tobacco farmers was
3,552.9 ZMW compared to 2,070.1 ZMW for current tobacco
farmers. Note, too, that the household resource calculation
does not include the opportunity (monetized) costs of THESE FINDINGS CAST SERIOUS DOUBT ON THE
household labour, which means that if they were to be NARRATIVE THAT TOBACCO FARMING IS A SUPERIOR
included, the gap between the tobacco-growing and non- LIVELIHOOD FOR MOST SMALLHOLDER FARMERS.
tobacco households due to the far larger household labour
demands of tobacco cultivation would almost certainly
be even larger. There is considerable variation across the
three provinces. In Eastern province, average household
resources between current and former tobacco farmers
was about even. In Southern, former tobacco farming
households’ average resources with about 40 percent
more than current tobacco farmers. In Central province,
however, the former tobacco farmers’ average resources
nearly seven times greater than the current tobacco
farmers. These findings cast serious doubt on the narrative
that tobacco farming is a superior economic livelihood for
most smallholder farmers. T 8. AVERAGE HOUSEHOLD RESOURCES (ZMW)
industry 1 industry 2 Solutions 1
– CURRENT AND FORMER TOBACCO FARMER, BY PROVINCE
THE ECONOMICS OF TOBACCO FARMING IN ZAMBIA 17RESULTS
WHY FARMERS GROW FIGURE 6
Ranked Order of Reasons for Growing Tobacco
TOBACCO
I am used to growing tobacco
In each of our survey waves we explored the reasons To repay outstanding debts from the tobacco company
farmers themselves give for continuing to grow and/or college or school fees
why they started growing tobacco. Figures 6 and 7 chart It was a highly lucrative enterprise
the frequency of the answers current tobacco farmers Good incentives from the tobacco company
provided in Wave 2 by rank order. Both figures indicate Influenced by other tobacco producers
an overwhelming perception that tobacco has a ready
Availability of land
market, is the only viable crop, is highly lucrative, and
It was the only viable cash crop
comes with incentives from tobacco companies. Other
Existence of ready market
tobacco producers (presumably their farming neighbours)
also exert some influence. These findings are not novel;
and while the top three reasons for growing tobacco are 0 50 100 150 200 250
the same in Wave 2 as in Wave 1, the emphasis is different. # ofobservations
In our earlier survey the most frequently cited reason was
“only viable crop,” followed by “lucrative industry” and First Second Third
“ready market.”
FIGURE 7
Recruitment into Tobacco Farming
In Wave 2 the “ready market” trumps the other two reasons,
and the perception that tobacco as a ‘highly lucrative
enterprise’ slips in the rankings. Since the questions in the
two waves were asked slightly differently, we are cautious
It was a highly lucrative enterprise
in drawing too much inference from these differences.
Good incentives from the tobacco company
The prominence of a “ready market” and less emphasis
on tobacco’s “lucrative enterprise” in Wave 2, however, Influenced by other tobacco producers
may signal a shift in how the tobacco farming market is Availability of land
perceived by farmers. This finding is consistent with the Inherited it from parents
research team’s recent field visits to the tobacco-growing It was the only viable cash crop
regions where tobacco farmers continue to underscore Existence of ready market
above all other dynamics that they prefer the relative
assurance of a market for their tobacco crop regardless of
the ultimate price paid to them for it. 0 50 100 150 200 250 300 350 400 450
FIG 6. RANKED ORDER OF REASONS FOR GROWING TOBACCO # of observations
industry 1
FIG 7. RECRUITMENT INTO TOBACCO FARMING
industry 2 Solutions 1
industry 1 industry 2 Solutions 1
First Second Third
18 THE ECONOMICS OF TOBACCO FARMING IN ZAMBIARESULTS
Whether this farmer is describing private creditors
As with our first wave study, many of the tobacco farmers or the leaf-buying companies with which they enter
in our focus groups maintained that, of all cash crops, into contract is not clear. Since few farmers reported
“number one is tobacco”, “no crop can beat tobacco”, successfully securing loans from private creditors
and “tobacco has money.” As one of our key informants outside of tobacco companies, we assume it is likely the
explained, this is largely because “small-scale farmers lack latter. Nevertheless, what is evident, and consistent with
an understanding of what their labour value is” (P3) and our own profit findings above, is that tobacco farmers
need to be taught the importance of incorporating their often end up in debt, sometimes owing money to the
own labour into their budgeting to get a more accurate leaf-buyers, and are then “forced by the company to
account of their production costs compared to other, non- grow the tobacco [the next year] so that [they] repay
tobacco crops. the debt.”
What remains relatively unique about tobacco is the ready “The issue of repaying the debt. That is a big
market, the near guarantee of some cash at the end of problem.”
the season, and sometimes, as part of their contract at
the beginning or part way through the growing season. Tobacco farmers’ many complaints above do not mean
Tobacco farmers in both the survey and the focus groups that they are necessarily prepared to give up growing it.
report that the cash they receive at the end of the season is For many, tobacco is still seen as the one crop that brings
essential to cover school fees, children’s school uniforms, cash at the end of the year, the one crop upon which
loans undertaken for new inputs during the growing they can rely. But their own experiences recounted
season (even for contract farmers who often run out of in our focus groups hardly stand as a resounding
company-provided inputs), the cost of hired labour, or the endorsement of tobacco as a poverty-reducing and
purchase of new livestock or equipment. Current tobacco livelihood-promoting practice for most smallholder
farmers, in general, for example, report more farming farmers. It also questions the longer-term viability of
assets than former farmers, while independent tobacco tobacco farming.
farmers report the greatest diversification in such assets,
perhaps anticipating their usefulness for if (or when) they
choose to cease growing tobacco.
“SMALL-SCALE FARMERS LACK AN UNDERSTANDING
OF WHAT THEIR LABOUR VALUE IS.”
- SENIOR AGRICULTURAL OFFICAL
Even as several farmers in our focus groups maintained
the importance of tobacco as the “only viable cash crop”
due to it having a “ready market,” most complained loudly
that the price paid, the input charges and levies, and the
income eventually earned, are far below what they need:
“There are some farmers who still owe from the
previous farming seasons [and] the creditors don’t
give you a chance, they simply unleash bailiffs to
recover the money.”
THE ECONOMICS OF TOBACCO FARMING IN ZAMBIA 19RESULTS
SATISFACTION WITH TOBACCO Farmers participating in our focus groups were often very
blunt about their dissatisfaction with how the leaf-growing/
MARKETS leaf-buying ‘system’ is still not working in their favour:
On contracts:
Our previous survey (Wave 1) reported a high level “The contracts we sign with the tobacco companies are
of dissatisfaction with several aspects of the market
economics of tobacco faming. One-third of the contract not clear. As a result of not understanding the terms,
farmers in the earlier study complained of not being
accurately informed of what was expected of them from farmers have become destitute.”
the contract. Most tobacco farmers (whether contract or
independent) were not satisfied with their leaf grading, or On grading:
with the final pricing. We attributed this to the monopsonist
(one buyer, many sellers) market structure of the contract- “We’re being cheated on the grading of tobacco.”
driven leaf-buying system in Zambia, which gives farmers
poor to no leverage when negotiating price with the On selling price:
buyer.24
“Selling price is too low.”
The Wave 2 results in Figure 8 still show high levels of
dissatisfaction, but with some nuances. Most contract One reason for some contract farmers’ dissatisfaction is
farmers, for example, report dissatisfaction with their that the inputs they receive at the start of the season are
negotiating position when they decide on a new or renewed recorded in US dollars, but the tobacco leaf they sell is priced
contract (58.8%), and only a few farmers state they are in Zambian kwachas (ZMW) making them vulnerable to
negotiating from a position of strength. Their satisfaction currency fluctuations (usually not in their favour). As one
increases, however, once the arrangements are confirmed farmer captured the general mood (and findings) across
within a contract, with 34% of those answering the question the four groups: FIG 8. TSATISFACTION WITH TOBACCO SELLING
still reporting dissatisfaction with the contract terms, industry 1 industry 2 Solutions 1
compared with 159 (56%) reporting at least some degree of FIGURE 8
satisfaction, and only 10% reporting being “very satisfied”. Satisfaction with tobacco selling
Similar proportions of satisfaction/dissatisfaction are
found for both contract and independent tobacco farmers, 100%
and for both tobacco leaf grading and sales, marking
82 87 16 84 15
a considerable improvement in satisfaction levels over 80%
134
our Wave 1 findings and likely due to the comparatively
higher prices being paid in this growing season. As with 60%
our Wave 1 findings, however, contract farmers are less 15
40% 127 129 21
likely to report being ‘very satisfied’ with their leaf grading. 135
This may reflect that, given the high cost of their inputs 67
20%
deducted at the end of the season, they rationally expected 12
their tobacco leaf to be graded higher than it was. 27 39 40 7
24
0%
Contract Farmer Independent Contract Farmer Independent
Farmer Farmer
Contract Contract Grading Sales
Negotiation
Position
Very Satisfied Somewhat Satisfied Dissatisfied
20 THE ECONOMICS OF TOBACCO FARMING IN ZAMBIAYou can also read