ZIMBABWE JOURNAL OF TECHNOLOGICAL SCIENCES
←
→
Page content transcription
If your browser does not render page correctly, please read the page content below
ZIMBABWE JOURNAL OF TECHNOLOGICAL
                           SCIENCES

                                        EDITORIAL BOARD

                                            Editor-in-Chief
                                     Professor A.B. Mashingaidze

                                       Deputy Editor-in-Chief
                                       Professor E. Jonathan

                                    EDITORIAL BOARD MEMBERS

                                              Dr. P.K. Kuipa
                                        Professor S.M. Makuza
                                             Mr. P. Pashapa
                                        Professor F.T. Mugabe
                                         Professor Y. Muzanila
                                        Professor E. Nyakatawa
                                          Professor H. Manwa
                                       Professor M.A. Makgopa
                                            Dr. C.P. Mubaya
                                       Dr. N. Mpofu-Hamadziripi

                           Copyright© 2013 Chinhoyi University of Technology

                                            ISSN: 2079-8997

Published by:                                                       Designed, originated and printed by
Chinhoyi University of Technology                                   Sable Press
P. Bag 7724                                                         Bluffhill, Harare
Chinhoyi
www.cut.ac.zw

                                                   1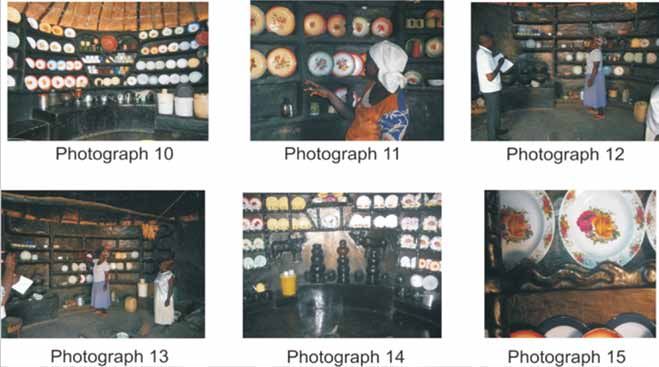
EDITORIAL

This special issue of the Zimbabwe Journal of Technological Science contains a selection of papers presented
at the International Research Conference held on 17-18 January 2013 at Chinhoyi University of Technology as
part of its 10th Year (2002-2012) Anniversary celebrations. In keeping with its new editorial policy, a number
of papers from other institutions in Zimbabwe and other institutions outside Zimbabwe that were presented at
the conference were selected for publication. The papers that are published in this special issue have undergone
the normal rigorous blind review process by regional and international reviewers that we subject papers that
we publish in regular issues of the Journal. This is the first issue that has been published under a new editorial
team for the Zimbabwe Journal of Technological Science. The commitment to editorial rigour and high quality
of published papers should be evident in this special issue and will be continued for all subsequent issues of this
Journal.

Professor A.B. Mashingaidze
Editor-in Chief

                                                         2
TABLE OF CONTENTS
Zimba J. and D. J. Simbi. Potential Nanomaterial and Nanotechnology Development Focus Areas for
Zimbabwe ..................................................................................................................................................... 4
Bere T. Toxicity of Cd, Cr III and Pb exposures on freshwater bio-films: implications of pulsed heavy
metal exposures for aquatic life protection.............................................................................................. 17
Makuza S. M. and B. Nyirandinkabandi. Level of inbreeding in Holstein dairy herds in Eastern
Province of Rwanda..................................................................................................................................... 29
Kupika O. L., B. Utete, G. Chibememe, C. Danha, C. Mapingure and W. Muzari. Climate change and
variability as perceived by river dependent rural communities in Makonde District, Chinhoyi,
Zimbabwe..................................................................................................................................................... 35
Chazovachii B. and H. S. Basure. Small scale gold panning and rural livelihoods development: the
case of Mberengwa district, Zimbabwe.................................................................................................... 47
.
Hove P. and R. Masocha. Electronic Marketing Capability the missing link in Small and Medium
Enterprises’ marketing performance in Developing Countries.............................................................. 55
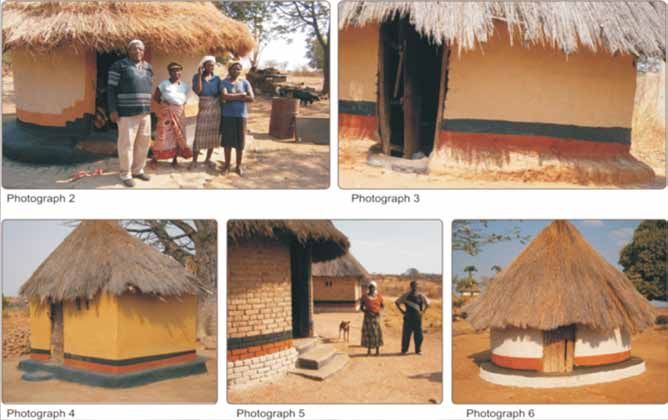
Pashapa P. and V. M. Dewa. The Vanishing Art of Home Decoration of the Korekore People of
Hurungwe District in Zimbabwe................................................................................................................ 67
3
Potential Nanomaterial and Nanotechnology Development Focus Areas for Zimbabwe

      Zimba1 J. and D. J. Simbi2

             1
                 Salene Technologies, Streathan House, Streatham Crescent, Bryanston, South Africa
                       2
                         Chinhoyi University of Technology, P. Bag 7724, Chinhoyi, Zimbabwe

           Corresponding author: Professor David Jambwa Simbi, Email address:dsimbi@gmail.com

                                                     ABSTRACT
The paper reviews the status of nanoscience and nanotechnology development globally with respect to basic
and applied research focus and areas of application in the health, water, environment and energy sectors.
Nanoscience and nanotechnology are opening some new avenues to fight and prevent diseases using atomic scale
tailoring of materials. The ability to uncover the structure and function of biosystems at nanoscale, for example,
stimulates research leading to improved biology, biotechnology, medicine and healthcare. The integration of
nanomaterials with biology has led to the development of diagnostic devices, contrast agents, analytical tools,
physical therapy applications and drug delivery vehicles. A case is made for Zimbabwe to exploit its mineral
wealth by focussing on nanoenabled materials in the energy, health and water purification related technological
applications. Nanoparticles, for example, improve chemical reactivity due to crystallographic surface structure
with their large surface to volume ratio, an aspect that is exploited in precious metal recovery pre-treatment
hydro-metallurgical processes. The paper further highlights the role of higher education institutions and
research centres such as the Institute of Mining Research, University of Zimbabwe, Invasive Species Research
and Management Unit, Chinhoyi University of Technology and Scientific Industrial Research and Development
Centre, in the promotion of nanoenabled research and development activities.

Key words: nanotechnology, nanomaterial, nanoenabled, nano value chain, mining, Zimbabwe

INTRODUCTION
Taniguchi (1974) first defined nanotechnology as comprising the processing of, separation, consolidation, and
sometimes deformation of materials by one atom or one molecule. The birth of cluster science and invention of
the scanning tunnelling microscope (STM) extended the use of nanotechnology to biological systems that exist
primarily in wet environments. Functional nanoscale structures of interest then comprised genetic material,
membranes, enzymes and other cellular components. Nanotechnology developments as derived from surface
science and physical chemistry have been extended to include the fabrication of structures in carbon, silicon,
and other inorganic materials. Generally, the development of nanotechnology is described either as ‘wet’ or
‘dry’ to reflect the operating environment (Singh et al., 2008).

Nanoscience and nanotechnology are considered as the next technology frontier after the silicon revolution
(Lane, 2000). Zimbabwe and Africa at largely missed the silicon revolution, but should not miss the nanoscience-
nanotechnology revolution. In generic terms, nanoscience refers to the study of phenomena and manipulation
of materials at atomic, molecular and macromolecular levels. At these levels, the properties differ significantly
from those at the larger scale. For example, it is well known that macro-sized (bulk) gold is yellowish in colour.
Nano-sized gold colloids on the other hand exhibit different colours due to local surface plasmon resonance.
Colloidal gold particles less than 100nm show an intense red colour while those greater than 100nm have a
blue/purple colour. Similarly, while bulk gold is inert, gold nanoparticles are excellent catalysts for oxidation of
CO to CO2. Nanoparticles exhibit a broad size distribution and morphologies with highly reactive facets.

The application of nanotechnology for treatment, diagnosis, monitoring, and control of diseases is referred to
as nanomedicine. The basic nanotechnology approaches for medical applications date back several decades
(Bangham et al., 1965; Langer and Folkman, 1976; Gref et al., 1994; Bruchez Jr., 1998; Chan, 1998). More

                                                         4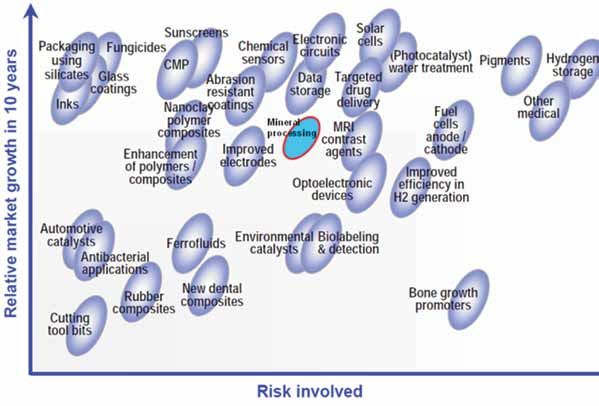
recent studies on new targeted nanoparticle contrast agents for the earlier characterisation of atherosclerosis
and cardiovascular pathology at cellular and molecular levels represent the next frontier that combine imaging
and rational drug delivery that will facilitate personalised medicine (Wickline and Lanza, 2002) In medicinal
preparations, nanoparticles in the range 1-10nm may attach to the surface of a cell membrane and drastically
disturb functions such as permeability and respiration

Nanotechnology is defined as the design, characterisation, production and application of structures, devices
and systems by controlling shape and size at the nanometre scale [Royal Society, 2004]. It is now generally
accepted that for a component or material to be considered as nano at least one critical dimension or manu-
facturing tolerances has to be below 100 nanometres, down to the size of atoms (~0.2nm) (Malanowski and
Zweck, 2007). Figure 1 shows everyday examples of things that fall in the macro- to nano- size range. Sadly,
the current equipment resolution in Zimbabwe does not allow for nano sized things to be observed. An ag-
gressive retooling of Zimbabwe’s institutions of high education and Research and Development centres is
therefore critical if the country is to tap into the huge promise of nanotechnology.

                               The Scale of Things – Nanometers and More (DoE)

                                                                                                                Head of a pin
                                                                                                                  1-2 mm
                              Ant
                            ~ 5 mm
                                                                   1 millimeter (mm)

                                                                                                                      MicroElectroMechanical
    Dust mite                                                                                                            (MEMS) devices
                                                                                                                          10 -100 µm wide
     200 µm
                           Fly ash
                         ~ 10-20 µm
      Human hair
   ~ 60-120 µm wide

    Red blood cells                                                                                                                            CAN SEE
      (~7-8 µm)

                                                                                       Limit of Zimbabwe’s technical analytical capability
                                                                   1 micrometer (µm)
                                                                                                                                          CAN NOT SEE
                                                     Ultraviolet

                                           10 -8 m
      ~10 nm diameter

                        ATP synthase

                        Atoms of silicon
          DNA           spacing 0.078 nm                                                                                        Carbon nanotube
   ~2-1/2 nm diameter                                                                                      Nanotube electrode   ~1.3 nm diameter

Figure 1: Scale of things from macro to nano size. Note that the current equipment capability in Zimbabwe
can only resolve things up to the micron size. To advance to the nano level, Zimbabwe will need a whole new
set of equipment. The figure is courtesy of the DoE, 2006 (Malanowski and Zweck, 2007).

                                                                                       5
Nanoscience and nanotechnology are not completely new. For example, chemists have been producing
 polymers over the last couple of decades, these are fundamentally large molecules made up of tiny nanoscale
 subunits. There are also other examples of naturally occurring nanostructures such as milk - a nanoscale colloid
 and more sophisticated systems like our DNA, which define who we are. The new nanotechnology revolution
 has been ushered by recent advances in tools which enable atoms and molecules to be probed with greater
 precision; these tools now offer an increased impetus for the advancement of nanoscience and nanotechnology.
 Nanotechnology promises to offer better, longer lasting, cleaner, safer, and smarter products for the home,
 communication, medicine, transportation and agriculture. Zimbabwe’s involvement in this field is thus timely.

 The highest return on investment will naturally lie in the ability to produce nano-enabled finished products
 such as solar cells and catalytic converters for automotives. Invariably these can only accrue on the backbone
 of a strong National Nanoscience Programme, for example, the Zimbabwe Nanotechnology Centre, which
 is expected to be adequately tooled to have the capability to synthesise and to probe nanoparticles. In this
 context, it is instructive to look at the entire nano-value addition chain.

 The Nano-Value Addition Chain
 Figure 2 shows the four-step nano value-addition chain comprising nanotools, nanomaterials, nanointermediates
 and nanoenabled products. While nanotools may not be considered as a classical value addition step, it is
 critical to have this underpinning the value addition process, as without it, the last three stages are built on a
 wobbly foundation. The word nanotool is used in a much broader sense here to represent both the equipment
 (Atomic Force Microscopy, Scanning Electron Microscopy, Transmission Electron Microscopy) and the human
 capacity necessary to drive the value chain towards Nanoenabled products.

Figure 2: The nano value addition chain

 According to (Sergent Jr, 2013), the global market value for nanotechnology will hit more than $2.5 trillion
 by 2014. Figure 3 shows the contribution of nanomaterials (nanoparticles, quantum dots, nanotubes, etc),

                                                         6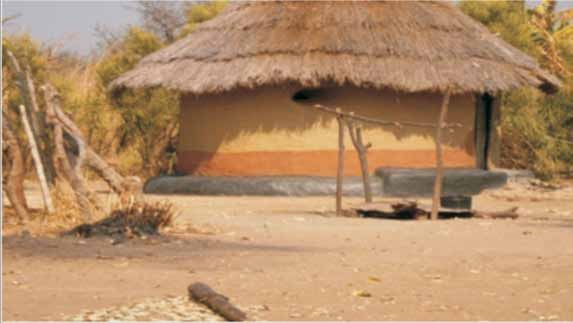
nanointermediates (coatings, nanocomposites) and Nanoenabled products (car bumpers, batteries, solar cells
and sporting goods) to this market value. It’s apparent that the greatest benefit lies in producing nanoenabled
products, and this must be Zimbabwe’s ultimate focus, yet invariably it must follow the entire value addition
chain starting from the Nanotools. In this regard, local higher education institutions (HEIs) such as Chinhoyi
University of Technology, University of Zimbabwe and National University of Science and Technology must
be strengthened in ways that allow them to undertake cutting-edge fundamental nanotechnology research.
Similarly, Research and Development (R & D) institutions like the Scientific Industrial Research and Development
Centre (SIRDC) must work with the local industry to transition the know-how developed to produce nano-
intermediates and nano-enabled products. To reduce the learning curve, it is key to form strategic linkages
with global institutions that have robust nanoscience/nanotechnology programmes. In addition, a functional
framework must also be developed that allows Zimbabweans in the diaspora, most of them are working in some
of the top laboratories across the globe, to funnel home the knowledge and expertise they have acquired.

Figure 3: Global market for nanomaterials, Nanointermediates and nanoenabled products up to 2014
(Sergent Jr, 2012).

 To illustrate the complimentary role of local HEIs and R and D institutions, consider for example, the value
addition of the platinum group metals (PGMs), which Zimbabwe’s resource is only second to that of South
Africa on the global scale. A comprehensive national nanotechnology programme could have the HEIs focus
on the synthesis of PGM nanoparticles, with SIRDC focusing on their integration into auto catalytic converters
and the local industry mass producing the catalytic converters. Other than catalytic converters, the question is
what else should Zimbabwe’s nanotechnology programme be focussing on? There is no simple answer to this,
but it is certainly helpful to look at this in light of the projected global growth areas for nanotechnology and
the associated level of risk as discussed below.

Projected Nanotechnology Growth Areas and Possible Focus Areas for Zimbabwe
Figures 4 to 6 show the nanotechnology application areas for 2005, 2010 and 2015, categorised in terms of
basic R and D, applied R and D, first applications and mass production (Blau, 2005). Figure 7 shows the perceived
risk for these application areas. It is helpful to group these areas into much broader themes such as energy (solar
cells), health, environment and manufacturing industry and discuss them under these broad themes.

                                                         7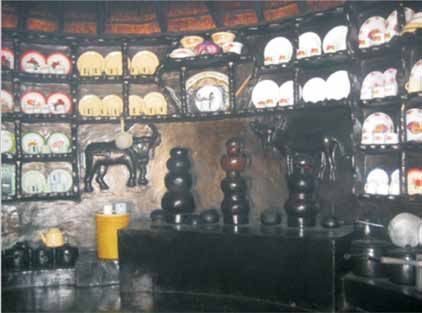
Figure 4: Overview of nanotechnology applications in 2005 (courtesy of NRM 2006).

       Figure 5: Overview of nanotechnology applications in 2010 (courtesy of NRM, 2006).

                                                    8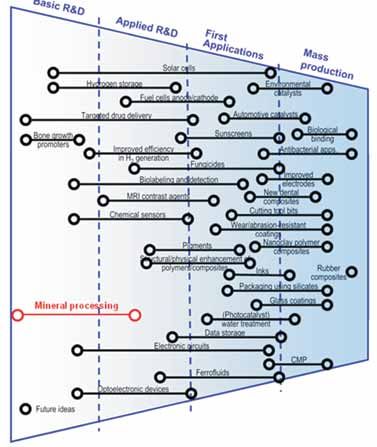
Figure 6: Overview of nanotechnology applications in 2015, (courtesy of NRM, 2006).

The most active energy focussed nanotechnology research areas are solar cells, fuel cells anodes and cathodes,
improved hydrogen generation and storage materials and battery materials. To a large extent these are driven
by the need to reduce the world carbon foot print, and associated global warming. Most of the research areas
are projected to see first applications round about 2015, with the possibility of mass production of nano-enabled
solar cells and fuel cells around that time. More realistically the mass production of fuel cells will likely happen
post 2020. Use of nano-inspired fabrication techniques for solar cells, such as those based on the copper-
indium-gallium diselenide (CIGS) is already starting to see commercial application. However, the dye-sensitised
solar cells still have stability and efficiency challenges, which must be overcome, before mass production can
be considered. For all type of solar cells, there exists scope to use nanotechnology approaches to improve
efficiency of the solar cells. Such approaches include the development of better anti-reflection coatings and
nano coatings which enable the solar cells to better utilise the full solar spectrum for electricity generation .
These are areas that the Zimbabwe nanotechnology programme should claim a stake in.

Energy Storage
Batteries for energy storage that are based on lithium ion are also key research focus areas; these are driven
largely by advances in hybrid and electric vehicles. Nanomaterial electrodes, with their large surface areas, could
allow for rapid charging of lithium batteries, this coupled with their high energy and power densities, would
make lithium ion batteries attractive for hybrid and electric vehicles. Similarly, lithium ion batteries are also
being considered for solar energy storage for both off-grid and grid stabilisation systems. Research on lithium
nanomaterials for battery manufacture is of particular interest to Zimbabwe in light of its petalite and possibly
spodumene lithium ore reserves. Zimbabwe’s petalite is considered as having probably the highest lithium
grades in the world.

On a relative growth versus risk graph, Figure 7, the solar cells are above the 45° line (not physically shown in
Figure 7), indicating that they have a high growth potential and a relatively low technological risk. Hydrogen
and fuel cells research has a good growth potential coupled with a fair measure of risk. This could mean that mass

                                                         9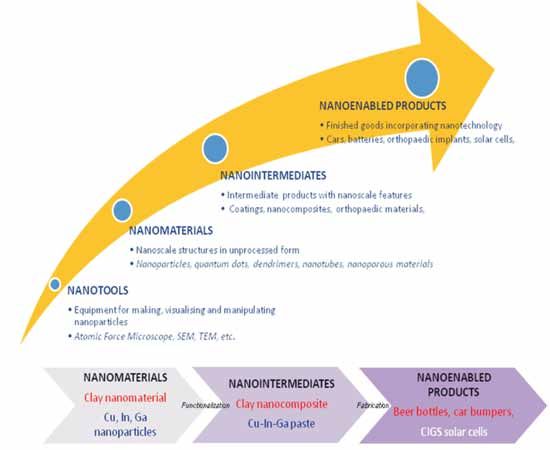
production of these could happen beyond 2020. However, the global drive for cleaner energy could shorten this
time frame. Zimbabwe’s endowment in PGMs should make this a key nanotechnology research focus area. To
hedge the risk, The PGM nanotech research also needs to feed into that of the automotive catalytic converters.

Figure 7: Relative market growth versus risk for various nanotechnologies (courtesy of NRM, 2006).

Health
Another growth area for nanotechnology is health. Key focus areas include bone growth promoters, targeted drug
delivery, bio-labelling and detection, sunscreens, new dental composites, fungicides, antibacterial applications
and MRI contrasting agents. Of these probably the most researched areas are antibacterial applications using for
example silver nanoparticles and targeted drug delivery for applications such as cancer treatment. Sunscreens,
typically made from TiO2 nanoparticles have already seen significant commercialisation (Luo et al., 2007). These
together with targeted drug delivery, and fungicides have the highest market growth potential and minimal risk.

A significant amount of research is still needed before a mass scale roll-out of targeted drug delivery. This will
possibly happen post 2020. As observed earlier, most natural processes occur in the nanoscale regime. Therefore,
a confluence of nanotechnology and biology that can address several biomedical problems is inevitable, and
can revolutionize the field of health and medicine (Curtis and Wilkinson, 2001). However, once the in vivo
and in vitro biomedical related side effects have been addressed, a more rapid growth of this market can be
expected. Bone growth promoters and new dental composites on the other hand have a low growth potential
and a relatively high risk. This, however, is not to say that these will not reach the market. If anything, these
materials could end up in highly specialised applications where a few companies that have made the necessary
investments will have some kind of market monopoly. For a developing country like Zimbabwe, targeted drug
delivery, antimicrobial applications, fungicides, bio-labelling and detection would be more important, especially
as they relate to treatment of everyday scourges such as malaria, HIV and AIDS and more recently cancer.

Water and Environment
Closely linked to health is water and environment. Nano-based photo-catalysts for water purification, especially
those based on TiO2, have continued to gain significant prominence (Luo et al., 2007). Titanium dioxide

                                                        10
nanoparticles are receiving wide attention in environmental and water treatment industries due to their good
antibacterial effect and their ability to photo-catalytically decompose many organic compounds. Titanium
dioxide can decompose carbonic acid gases, degrade organic pollutants and remove salts as well as heavy metals
from liquids (Kuchibhatla et al., 2007). The material, TiO2 is also widely used to prepare reduction/oxidation
and catalytically active nanoparticles for the reductive dehalogenation of chlorinated organic compounds in
aqueous solutions (Huang et al., 2007). Researchers have recently started exploring the possibility of using an
innovative TiO2 /FeO composite as a catalyst for the removal of arsenic from groundwater and for the treatment
of azo dye (Huang et al, 2007). Additional research is on the production of filters coated with TiO2 nanoparticles
that trigger a chemical reaction where harmful pollutants are changed into harmless carbon dioxide and water
(Khodja et al., 2001).
Other than TiO2, there are more nanostructured systems such as activated carbon and zeolite, which are also
useful for water purification. In this context, both natural and synthetic zeolites are potentially useful in the
removal of ammonium (NH4+) cations from water. Ammonia removal is essential to prevent algae bloom and
oxygen depletion, which compromise aquatic life (Jung et al., 2004). The ammonia is removed via a cation
exchange mechanism with zeolite’s biologically benign cations such as Na+, K+ or Ca2+. Zeolites also show a
significant promise for removal of heavy metals in post-mining environmental remediation (Diale et al, 2011).
Potable water is a global problem, which will continue to grow; in fact the pessimists argue that future wars will
be fought not for oil, but rather for potable water. Water remediation using nanotechnology must therefore
be one of the focus areas of Zimbabwe’s nanotechnology programme. The use of activated carbon in water
purification is gaining prominence. The smaller the activated carbon particle, the greater the surface area to
volume ratio, and the higher is its chemical reactivity and microbiological activity, and these provide remedial
solutions to both metal ion and bacterial contamination inherent most underground and groundwater bodies
arising from uncontrolled disposal of manufacturing and sewage materials (Lu and Su, 2007). Most human-
made nanoparticles do not appear in nature so much that no existing living organisms have the ability to deal
with such nanowaste (Amais et al., 2007).
Mining
The manufacturing industry, including possibly the mining/mineral processing industry is also set to be
revolutionised by nanotechnology. Outside of the use of activated carbon for gold recovery, it is not immediately
clear what the other growth areas for nanotechnology in the mineral processing industry are, but herein this
unbeaten path lies unique nanotechnology opportunities for a mining country like Zimbabwe (Amais et al,
2007). Possible ideas that warrant further research include the use of zeolites, functionalised nanoparticles,
magnetic and paramagnetic nanoparticles for selective recovery of valuable minerals. These approaches could
potentially augment existing mineral processing approaches such as floatation, or in some instances, give birth
to completely new mineral recovery technologies, hitherto unperceived (Stafiej and Pyrzynska, 2007).
Manufacture of nanomaterials
Another high growth area for nanotechnology in the manufacturing industry is the use of clay nanocomposites
and silicates; the latter is mostly by the packaging industry. The addition of the nano-clays to polymers has
been proven to improve their limiting properties, typically these are mechanical properties, thermal properties,
conductive and gas barrier properties (Giannelis, 1998; Lagally, 1999; Drown et al., 2007). Some of the pioneering
work on clay nanocomposites was undertaken by Toyota researchers, who reported in 1990, that the tensile
strength and modulus of polyamide 6 could be increased by 55% and 90%, respectively, with the addition of
only 4 wt. % of delaminated clay [Okada et al., 1990]. Since then there has been a proliferation of research and
publications in this area. Pigments and sunscreens, both of which are based mostly on TiO2 nanoparticles, are
other low risk high growth potential industry applications of nanotechnology.
The discussion of nanotechnology applications so far has primarily been a pseudo top-down approach. In a
somewhat implicit way, it should also have become apparent that there are several nanoparticles/nanomaterials
with a cross-cutting range of applications, such as TiO2 and ZnO. Nano ZnO, has very versatile properties in
11that it can be used in polymers, electronics, sensors, optoelectronics and piezoelectricity (Lu et al., 2006;
Miyatake et al., 2006; Giselle et al., 2007; Xing-Jiu and Yang-Kyu, 2007). Any country aspiring to be a
leader in nanotechnology must have the capacity to synthesise, characterise and develop new applications
for these nanoparticles/materials with cross-cutting applications. Research on these nanoparticles/
nanomaterials should be one of the key focus areas of Zimbabwe’s bottom-up nanoscience programme
and must be ideally spearheaded by the various Higher Education Institutions. Table 1 below summarises
some of the nanoparticles/nanomaterials and their applications.
Table 1: Nanoparticles/nanomaterials and their field of application
Field of Application
Manufacturing Water Energy Health Mining Environment
TiO2 TiO2 TiO2 TiO2 Fe3O4 TiO2
Nanoparticles/Nanomaterials
clays zeolites ZnO, SnO2 zeolites Activated zeolites
carbon
CeO2 Activated LiCoO2, LiFePO4, ZnO, clays Pt, (Pt group)
carbon Li4Ti5O12, Fe3O4 Au,
carbon nanotubes
Carbon ZnO Pt (Pt group) Fe3O4 Fe3O4
nanotubes
ZnO Ag, Cu Cu, In, Ga, Se, Zu, Ag, Cu ZnO
Sn
The transition from basic science to products in a developed economy often happens in a seamless way
due to the presence of what might be termed as commercialisation enablers, these include complementary
technologies, finance, etc as shown in Figure 8. On the other hand in a developing economy like Zimbabwe, the
lack of commercialisation enablers results in a large valley of death for some of the ideas (Figure 8), which would
otherwise easily see commercialisation in the developed world. It is thus critical for Zimbabwe to carefully
select nanotechnology and nanoscience focus areas. A frame-work for selecting these is presented in Figure 9,
which summarises what the broad drivers for Zimbabwe’s market focussed nanotechnology research and basic
nanoscience studies should be.
12Commercialization enablers:
(complementary technology, Valley of Death
commercialization culture,
capital, etc)
Developed Economy Developing Economy
Figure 8: Transition from basic and applied science to commercialisation in a developed and developing economy.
Notice the large valley of death in a developing economy due to lack of commercialisation enablers.
Figure 9: Summary of what the broad drivers for Zimbabwe’s market focussed nanotechnology research and
basic nanoscience studies should be.
SUMMARY
In summary, for the commercial application of nanotechnology, Zimbabwe’s focus should be in an area where
there is a product demand, a good market growth potential and promising return on investment. In addition,
the nanoenabled products must preferably provide an avenue for Zimbabwe to add value to its natural
resources. On this metric, autocatalytic converters and fuel cells, which utilise the platinum group metals and
lithium-ion batteries utilising Bikita’s petalite ores would be natural candidates for Zimbabwe’s market focussed
nanotechnology research. Similarly, the nanoscience research must be on nanoparticles/materials which can be
easily integrated into local products and have a wide range of applications. Notwithstanding that, there must
therefore be a healthy cross-pollination between the market-focussed nanotechnology research and the basic
nanoscience research. Figure 9 summarises this broad thinking.
13CONCLUDING REMARKS
This paper has highlighted the areas that Zimbabwe’s nanotechnology should focus on; the salient points can
be listed as:
1. The highest return on nanotechnology investment is on nanoenabled products, this is what Zimbabwe
must ultimately focus on. The nanotechnology R&D must have a clear path from Nanotools, Nanomaterials,
Nanointermediates to Nanoenabled products.
2. The nanotechnology domain is “new” to Zimbabwe and requires a set of tools that have traditionally not
been used in Zimbabwe. It is thus critical to leverage on existing capacity (both human resources and
tools) then strategically invest in the missing ones.
3. The Nanoparticles/nanomaterials to be focussed on should:
a) Have a wide field of applications, especially in areas critical to Zimbabwe, e.g. water, energy,
packaging industry, mining, health and environment.
b) Easily be assimilated into locally manufactured products or lead to the generation of new
industries. The research and development should be applications driven.
c) Easily produced/synthesised (e.g. chemical synthesis), leveraging on existing local capacity in
chemistry, metallurgy and physics. In parallel, appropriate national investments must be made to
acquire critical tools such as the: SEM, AFM and TEM.
d) Some of the Nanoparticles/nanomaterials which broadly fulfil this criteria include, TiO2, Fe3O4,
ZnO, Ag, Cu, In, Ga, Se, Zn, Sn, activated carbon, etc.
REFERENCES
Amais, R.S., J.S. Ribeiro, M.G. Segatelli, I.V.P. Yoshida, P.O. Luccas and C.R.T. Tarley 2007. Assessment of alumina
naocomposite alumina support on multi-wall carbon nanotubes as absorbent for on-line nickel pre-concentration
in water samples. Separation and Purification Technology 58: 122-128.
Bangham A.D., M.M. Standish and J. Watkins 1965. Diffusion of univalent ions across the lamellae swollen
phospholipids. Molecular Biology 13: 238-252.
Blau A. 2005. Progress and Expectations in Biomedical Nanoscience and -technology: A German Perspective.
Nanotechnology in Medicine and Bioengineering, Rostock, November 2005, 1-21.
Bruchez Jr. M., M. Moronne, P. Gin, S. Weiss and A.P. Alivisatos1998. Semi-conductor nanocrystals as fluorescent
Biological labels. Science 281: 2013-2016
Chan W.C. and S. Nie 1998. Quantum Dot Bioconjugates for ultrasensitive nonisotopic detection. Science 281:
2016-2018.
Curtis A. and C. Wikinson 2001. Nanotechniques and approaches in biotechnology. Trends in Biotechnology 19:
97-101.
Drown E.K., A.K. Mohanty, Y. Parulekar and J.V Kurian 2007. The surface characteristics of organoclays and
their effects on the properties of poly(trimethylene terephthalate) nanocomposites. Composites Science and
Technology 67: 3168-3175.
Diale P.P., S.S.L. Mkhize, E. Muzenda and J. Zimba 2011. The Sequestration of Heavy Metals Contaminating
the Wonderfonteinspruit Catchment Area using Natural Zeolite. World Academy of Science, Engineering and
Technology 50: 762-768.
Giannelis E. P. 1998. Polymer-layered silicate nanocomposites synthesis, properties and applications. Applied
Organometallic Chemistry 12: 675-680.
14Giselle Jime´nez-Cadena, Jordi Riu and F. Xavier Rius 2007. Gas sensors based on nanostructured materials.
Analyst 132: 1083–1099.
Gref R, Y. Minamitake M.T. Peracchia, V. Trubetskoy, V. Torchilin and R. Langer 1994. Biodegradable long-
circulating polymeric nanospheres. Science 263: 1600-1603.
Huang C., W. Hsieh, J.R. Pan, and S. Chang 2007. Characteristic of an innovative TiO2/Fe composite for treatment
of azo dye. Separation and Purification Technology 58:152-158.
Huang X-J., and Y-K. Choi 2007. Chemical sensors based on nanostructured materials. Sensors and Actuators
B 122: 659–671.
Khodja, A., T. Seheli, J-F. Pilichowski, and P. Boule 2001. Photocatalytic degradation of 2-phenylphenol on TiO2
and ZnO in aqueous suspensions. Journal of Photochemistry and Photobiology A: Chemistry 141: 231-239.
Kuchibhatla S. V. N. T., A.S. Karakoti, D. Bera and S. Seal 2007. One dimensional nanostructured materials.
Progress in Materials Science 52: 699-913.
Jung J.Y., Y.C. Chung, H.S. Shin and D.H. Son 2004. Enhanced ammonia nitrogen removal using consistent
biological regeneration and ammonium exchange of zeolite in modified SBR process, Water Research 38: 347-
354.
Lagally G. 1999. Introduction: from clay mineral-polymer interactions to clay mineral-polymer nanocomposites.
Applied Clay Science 15: 1-9.
Langer R. and J. Folkman 1976. Polymers for sustained release of proteins and other macromolecules. Nature
263: 797-800.
Lane N. 2000. National Nanotechnology Initiative: Leading to the next Industrial Revolution: A Report by the
Interagency Working Group on Nanoscience, Engineering and Technology, Committee on Technology, National
Science and Technology Council, The Whitehouse, February 2000, Washington, DC
Lu C. and F. Su 2007: Adsoprtion of activated organic matter by carnon nano-tubes. Separation and Purification
Technology 58: 113-121.
Lu J.G., P. Chang, and Z. Fan 2006 Quasi-one-dimensional metal oxide materials-synthesis, properties and
application. Materials Science and Engineering B 52: 49-91.
Luo, Z., H. Cai, X. Ren, J. Liu, W. Homg, and P. Zhang 2007. Hydrophilicity of titanium oxide coatings with the
addition of silica. Materials Science and Engineering B 138: 151-156.
Malanowski, N. and A. Zweck 2007. Bridging the gap between foresight and market research: integrating
methods to assess the economic potential of nanotechnology. Technological Forecasting and Social Change 74:
1805-1822.
Miyatake, N., H.J. Sue, Y. Li, and K. Yamaguchi 2006. Stabilization of polymers with zinc oxide nanoparticles, US
2006/0194910 A1, Aug. 31, 2006.
Okada A, M. Kawasumi, A. Usuki, Y. Kojima, T. Kurauchi, O. Kamigaito 1990. Nylon clay hybrid. Materials
Research Society Proceedings 171: 45–50.
Sargent Jr. J.F. 2013. The National Nanotechnology Initiative: Overview, Reauthorization and Appropriation
Issues, Congressional Research Service (CRS). August 29, 2013. Washington DC.
15Singh M, S. Singh, S. Prasad and I.S. Gambhir 2008. Nanotechnology in Medicine and antibacterial effect of
silver nanoparticles. Digest Journal of Nanomaterials and Biostructures 3 (3): 115-122.
Stafiej A and K. Pyrzynska 2007. Adsorption of heavy metals with carbon nanotubes. Separation and Purification
Technology 58: 49-52.
Taniguchi N. 1974. Proceedings of International Conference in Production Engineering, Tokyo, Part II, Japan
Society of Precision Engineering.
The Royal Society 2004. Nanoscience and Nanotechnologies: Opportunities and Uncertainities, Science Policy
Section, July 2004, pp1-116, The Royal Society and The Royal Academy of Engineering, ISBN: 0854036040
Wickline S.A. and G.M. Lanza 2002. Molecular imaging targeted therapeutic and nanoscience, Journal of Cellular
Biochemistry. Supplement 39: 90-97.
16Toxicity of Cd, Cr III and Pb exposures on freshwater bio-films: implications of pulsed
heavy metal exposures for aquatic life protection.
Bere, T.
Chinhoyi University of Technology, Department of Wildlife and Safari Management, P. Bag 7724, Chinhoyi,
Zimbabwe
Formerly of Univeridade Federal De São Carlos, Programa de Pós-Graduação em Ecologia e Recursos Naturais,
Rodovia Washington Luís, km 235 - SP-310 , São Carlos - São Paulo - Brazil
Corresponding author: Professor Taurai Bere, Email address: taubere@yahoo.com, tbere@cut.ac.zw
ABSTRACT
Patterns of metal exposure have obscured effects on periphyton communities in aquatic ecosystems. The objective
of this study was to investigate toxicity effects of pulsed heavy metal exposures on periphyton communities
with the overarching aim of discussing ecotoxicity in the context of increased realism in the exposure scenarios.
Natural periphyton communities were transferred to artificial stream chambers to study combined effects of
frequency, duration, recovery period, chemical type and timing of pulses with elevated Cd2+, Cr3+ and Pb2+
concentrations. Algal cell densities and diatom taxonomic composition were recorded. Changes in diatom
species composition and relative abundance with different exposure scenarios were recorded demonstrating
the usefulness of diatom communities in detecting high metal concentration mixtures in streams. The closer
the frequency and duration of the pulse is to a continuous exposure (continuous exposures resulting in greater
effects of the pollutant on test organisms than pulsed exposures), the greater the effects of the contaminant
on aquatic life. The higher the frequency of ‘short’ duration pulses the more likely they are to produce effects
similar to that of long duration exposures. Light plays an important role in modulating the effects of metal
toxicants on aquatic life. Thus, factors other than the traditionally used magnitude and duration of contaminants
must be considered in order to accurately predict response of aquatic life to pulsed exposures. To this effect,
better information is needed on effluent variability, and specifically, frequency, duration, timing and type of
pulses as well as the magnitude of the pulse.
Keywords: exposure scenarios, heavy metals, diatoms, water quality guidelines
INTRODUCTION
Sustainable management of the aquatic ecosystems requires a reliable heavy metal toxicity assessment in rivers.
Through standardized laboratory ecotoxicological procedures, test results for a given heavy metal are converted
to water quality criteria values that are used by environmental agents to set legally enforceable water quality
guidelines. These standard ecotoxicological tests are usually designed to evaluate the effects of a heavy metal
that is present at a constant concentration over a pragmatically determined time-frame. Unfortunately, such a
design does not reflect environmental pollution well, since pollution is erratic and concentrations fluctuate with
time (Zhao and Newman, 2004; Diamont et al., 2006a). Inputs of heavy metals to aquatic environments often
occur in pulses when peak concentrations temporarily, but greatly, exceeds the background level (Genter, 1996;
Diamont et al., 2006a). As pulses with elevated concentrations are brief, to calculate permit-limits for effluents
from averages of concentrations over time may not be protective enough (Zhao and Newman, 2004; Diamond
et al., 2006; Morin et al., 2008a, b).
The pattern of heavy metal exposure including the possible interaction between metals in complex mixtures,
timing, frequency, duration and magnitude of exposure plays an important role in governing aquatic life. The
results of the interplay of these factors can be difficult to predict. Previous studies examining pulsed-chemical
exposures offers contrasting results with higher effects (Van DerHoeven and Gerritsen, 1997; Brent and Hericks,
1998) or lesser effects (Hosmer et al., 1998) on test organisms compared to what would be predicted based
on results using a constant exposure at similar concentrations. However, it is noted that these results were
dependent on the chemical, test species, and test design used.
17From our personal experience, effluents with elevated concentrations of metals are normally discharged at night
and during the weekends without the knowledge of the law enforcement agents in developing countries. This
timing of effluent discharge is likely to affect the resultant periphyton communities of lotic systems as they have
developed complex systems, circadian clocks, to detect time and synchronize processes, actions, and behaviours
to the diel cycle (Roenneberg and Merrow, 2002). To the best of our knowledge, there is hardly any research
done yet to try to find out the potential effect of timing of high heavy metal concentration discharge, i.e. night
(dark) or day (light), on periphyton communities in receiving lotic systems. The objective of this study was to
investigate toxicity effects of intermittent discharge of heavy metals on periphyton communities in tropical
streams with the overarching aim of discussing ecotoxicity in the context of increased realism in the exposure
scenarios.
Materials and Methods
Field periphyton collection
Periphytic communities were collected from Monjolinho River in the southern part of Brazil at an undisturbed
site located between an ecological park and the city of São Carlos (21O 59'09.16" S; 47O 52'35.82" W; elevation
832m). Headwaters of the Monjolinho River and its tributaries fall within a mainly agricultural area characterised
by crop cultivation and animal husbandry. Previous research showed very low heavy metal concentrations at
the sampling site similar to background levels in the area (Bere and Tundisi, 2010). Sampling was done during
the dry season to reduce variations in water level and velocity, floods and inundations. These variations affect
diatom development, especially growth rate and relative abundance of different species (Biggs and Kilroy,
2000).
Four plastic racks, each fitted with 10 separate and vertical acid-cleaned glass materials (6 x 15 cm) to act as
surface for periphyton attachment were immersed at the sampling site parallel to the current, 20 to 30 cm
below the water surface. The racks were secured by ropes and pegs and left for 4 weeks prior to sampling. On
sampling, the plastic rakes were carefully removed from the river and bio-films colonizing the glass substrates
were brushed with a toothbrush into culture medium (Woods Hole culture medium modified according to Gold
et al. 2003). The bio-films from all the glass substrates were pooled into one sample of approximately 2 L of the
culture medium. This bio-film suspension was immediately transported to the laboratory in cooler box (4 OC).
Laboratory experiment design
Twelve closed experimental systems (hereafter referred to as experimental units; EUs) were set up to allow the
exposure of natural periphytic communities to pulses of elevated concentrations of Cd2+, Cr3+ and Pb2+ under
controlled conditions following Gold et al. (2003). Each EU consisted of three half-polyvinyl chloride (PVC)
tubes 50 cm long with a radius of 5 cm as artificial streams with a capacity of 2.8 L each. The three streams
were connected in parallel to a 30 L tank (Figure 1). Each stream was fitted with 6 clean glass substrates (6 x 15
cm) in a slightly slanting position for periphyton colonisation. Water level was kept at 0.5 cm above substrate. A
light intensity of 55 ± 5 µmol s-1 m-2 at the water-air interface for photosynthetically active radiations (400-700
nm) was maintained with a light: dark regime of 12h/12h. Prior to this experiment, various pilot studies were
carried out to determine the optimum experimental conditions required.
All systems were filled with diluted (4x) modified Woods Hole culture medium by Gold et al. (2003). This
culture medium was supplemented with silica, an essential diatom nutrient, by dissolving Na2SiO3.9H2O to final
concentration of 71 mg SiO3-L-1 Nutrient levels were between the high and optimal values found in culture
media, and corresponded to the lower values of natural river waters. Test medium were prepared from distilled
water. A pump allowed continuous circulation of the water through each system at a rate of 10 ± 0.25 ml s-1,
corresponding to a velocity of 0.2 cm s-1. Discharge was monitored daily and adjusted where necessary.
18Figure 1: Schematic representation of a closed experimental system, consisting of three artificial streams (50 cm
length, 5 cm radius), each containing 6-glass substrata (6 X 15 cm). Arrows indicate flow direction, (by: Ricardo
M. Degani).
Metal exposure
Pulse frequency ranged from two to seven pulses in a given test and recovery time between pulses ranged
between 12 and 60h (Table 1). Pulse durations were either 12h or 24h. The 12h pulses were carried out either
during the light or dark periods of the experiment for each type of metal treatment. Homogenised periphyton
suspension from the field was divided into 8 equal volumes (250 mL each). Each fraction was introduced into
the water column of the tank feeding 8 EUs as described below. The systems were equilibrated over night and
then the desired concentrations of Cd2+, Cr3+ or Pb2+ were obtained by addition of aliquots of the stock solutions
to different systems. The stock solutions were prepared as cadmium chloride (CdCl2, 10 mg.L-1), lead nitrate
(Pb(NO3)2 10 mg.L-1) and chromium (III) chloride hexahydrate CrCl3.6H2O, 10 mg.L-1 all from Merck, Darmstadt,
Germany.
EU1 was left uncontaminated throughout the experiment to act as a control. EUs 2, 3, 4 and 5 had two
duplicates each that were differentiated as contaminated and uncontaminated depending on heavy metal
inclusion. Contaminated systems for EU2 and 3 were contaminated with a mixture of 0.1 mg.L-1 Cd2+ + 0.1
mg.L-1 Pb2+, whilst those for EU4 and 5 were contaminated with a mixture of 0.1 mg.L-1 Cd2+ + 0.2 mg.L-1 Cr3+.
After overnight equilibration, EU6, 7 and 8 were continuously contaminated with 0.1 mg.L-1 Cd2+; 0.1 mg.L-1
Cd2+ + 0.1 mg.L-1 Pb2+; and 0.1 mg.L-1 Cd2+ + 0.2 mg.L-1 Cr3+ respectively (Table 1).
The uncontaminated units were not inoculated with periphyton and had no glass slides fitted in it. Sets of
two glass slides from each stream from the contaminated EUs were subjected to metal pulse exposures based
on scheme in Table 1. Chemical pulses were achieved by transferring glass slides from contaminated EUs to
uncontaminated EUs and vice verse for a prescribed duration to achieve the desired exposure duration, timing,
recovery period and frequency (Table 1). Pulse concentration was constant for a given treatment when multiple
pulses were applied during a test. The concentrations of Cd2+, Cr3+ and Pb2+ used in this study were chosen to
reflect pulses discharge regime typical of field observations where peak concentrations temporarily, but greatly,
exceeds the background level.
19Table 1: A Schematic depiction of the general experimental design for a given metal treatment and
pulsing regimes used in experiments involving 2, 4 or 7 pulses and different recovery times between
pulses. Gray, chemical exposure; white, no chemical exposure; cont, continuous; reps, replicas; L, light;
D, dark.
Bio-film sampling and analysis
Bio-films were collected after a colonization period of 1 week in all the experimental units. During sampling,
two glass substrates (section 2.3) were separately removed from each stream of each EU (n = 3 for each EU).
The bio-films from the two glasses were brushed with a toothbrush into mineral water and the resultant bio-film
suspensions from the two glasses were pooled to make one sample and making the volume of the suspension
to 50 ml. The bio-film suspension was preserved with 4% (final concentration) formalin for identification and
cell density determination. Cells in the 100µL subsample were counted in a Nageotte counting chamber at
X400 with algal cell densities expressed as living algal cells per unit area (cells.cm-2). For diatom identification
to species level, sub-samples of the suspensions were cleaned of organic material using wet combustion with
concentrated sulphuric acid and mounted in Naphrax (Northern Biological Supplies Ltd. UK. RI = 1.74) as
described by (Biggs and Kilroy, 2000). A total of 250 – 600 valves per sample were identified and counted using
the phase contrast light microscope (1000 X) (Leica Microsystems, Wetzlar GmbH, Type - 020-519.503 LB30T,
Germany). The diatoms were identified to species level based on studies by Metzeltin et al. (2005), Bicudo and
Menezes (2006) and Metzeltin and Lange-Bertalot (1998, 2007).
Data analysis
Statistical significance of main effects (i.e., pulse frequency, duration, recovery period, timing and chemical
type) that were varied within a given experiment on algal cell densities, species richness and diversity were
analyzed using analysis of variance (ANOVA) after testing for homogeneity of variances (Levene`s test, p <
0.05) and normality of distribution (Shapiro-Wilk test, p < 0.05) and log transforming where necessary. Tukey’s
pairwise comparison test (p < 0.05) was used to test for significant differences in periphyton response among
treatments in a given experiment if ANOVA indicated significant effects. Separate ANOVAs and a Tukey’s
pairwise comparison tests were conducted for each type of response (algal cell densities, species richness
and diversity) for each treatment. Taxonomic differences among the different treatments were revealed using
principal component analyses (PCA). ANOVA, Tukey’s pairwise comparison test, Shapiro-Wilk test and Levene`s
test were performed using PAlaeontological STatistics (PAST) software version 2.01 (Hammer et al., 2009).
20Results and Discussion
All the response variables (algal cell densities, species richness and diversity) elicited significant differences
among the 16 treatments assigned to periphyton communities (ANOVA, p < 0.05). This emphasises the
importance of metal pulse frequency, duration, recovery period, timing and chemical type on aquatic life as has
been previously reported (Diamond & Butcher, 2002; Diamond et al., 2006a, 2006b).
Algal cell densities in relation to exposure scenarios
Periphyton response was partly a function of pulse frequency and recovery time. Increasing pulse frequency from
4 to 7 pulses (decreasing recovery period between pulses from 36 to 12hr) for 12 hr pulse duration experiment
resulted in significant decrease in algal cell densities both for Cd2+/Pb2+ and Cd2+/Cr3+ mixtures regardless of
the timing of exposure (ANOVA, p < 0.05; Figure 2). On the other hand, increasing pulse frequency from 2 to 4
pulses (decreasing recovery period between pulses from 60 to 24 hr) for 24 hr pulse duration experiment also
resulted in decrease in algal cell densities but the decrease was only significant for Cd2+/Cr3+ mixture (ANOVA, p
< 0.05; Figure 2). This emphasizes the importance of pulse frequency, recovery period, exposure duration and
chemical type and is consistent with previous research observations that the closer the frequency and duration
of the pulse it is to a continuous exposure, the greater the effects of the contaminant on aquatic life (e.g. Zhao
and Newman, 2004; Diamond et al., 2006a, b).
Figure 2: Algal cell densities obtained after developing on glass substrates in 17 treatments over a period of one
week. L = light, D = dark, cont = continuous, P = pulse, R = recovery.
Response of periphyton communities to increased pollutant pulse durations was also demonstrated. Increasing
metal pulse duration from 12 to 24 hr resulted in significant decrease in algal cell densities (ANOVA, p < 0.05;
Figure 2). Similar work has demonstrated the importance of pollutant pulse duration in aquatic systems in
agreement with the results of this study (Diamond et al., 2006a, b). However, densities were only significantly
high in 12h pulse/36h recovery period experiments compared to the all the 24 hr pulse experiments (ANOVA,
p < 0.05; Figure 2). On the other hand, there were no significant differences in algal cell densities between 12h
21pulse/12h recovery period experiments and all the 24 hr pulse experiments (ANOVA, p > 0.05; Figure 2). Thus,
the higher the frequency of ‘short’ duration pulses the more likely they are to produce effects similar to that of
long duration pulses suggesting an interaction of pollutant pulse frequency and duration in shaping aquatic life,
which is poorly reflected in regional and international water quality guidelines.
For 12 and 24hr pulse treatments (regardless of pulse frequency, recovery period timing, and chemical type), algal
cell densities were significantly higher than in all continuous exposure treatments (ANOVA, p < 0.05; Figure 2).
Other researcher (e.g. Erickson et al., 1986; Diamond et al., 2006a) observed that continuous exposures results
in greater effects of the pollutant on test organisms than pulsed exposures of the same concentrations similar to
our results in this study. In the light of the significant differences in the measured variables between pulsed and
continuous exposures recorded in this study, it would make intuitive sense to suggest that infrequent and widely
separated metal pulses of low concentration are likely to have little effects on aquatic life. Indeed, from our
field studies, we observed that Cd2+, Pb2+ and Cr3+ levels slightly exceeding regional accepted levels (Comana,
2005) on water quality at some points in streams around São Carlos city were not closely associated with the
observed changes in diatom communities (Bere and Tundisi, 2010). These results suggest that factors other than
the traditionally used magnitude and duration of contaminants may be considered in order to accurately predict
response of aquatic life to contaminants.
Algal cell densities were significantly (ANOVA, p < 0.05) and generally higher in dark pulse exposures compared
to light pulse exposures of the same duration and frequency for all the contaminants (Figure 2). This suggests
a potential role of light in modulating the effect of toxicants as was obtained by Guasch et al. (2003); Laviale
et al.(2010). This is quite understandable considering that most aquatic organisms have developed complex
systems, circadian clocks, to detect time and synchronize processes, actions, and behaviours to the diel cycle
(Roenneberg and Merrow, 2002). In addition, the metabolism-dependent phase of uptake of some metal such
as Cd2+ by some algal species is inhibited by absence of light (Garnham et al., 1992). Pulse timing is currently
not explicitly considered in aquatic life water quality criteria paradigm.
Increasing pulse frequency from 2 to 4 pulses for 24 hr exposure experiments only resulted in significant
(ANOVA, p < 0.05) decrease in algal cell densities for Cd2+/Cr3+ mixture and not for Cd2+/Pb2+ mixture experiment
(Figure 2). This difference in algal response to the two combinations of heavy metals demonstrates the need
to consider pollutant type in formulating water quality guidelines for protection of aquatic life as has been
widely recognized. In addition, for continuous exposures experiments algal cell densities were higher in Cd2+/
Cr3+ followed by Cd2+/Pb2+ and then Cd2+ experiment. Depending on factors like pH and water hardness, Cd2+
is generally more toxic than Pb2+, which is in turn more toxic than Cr3+ (Genter, 1996). Thus, Cd2+ plays a more
important role in regulating periphyton community development compared to Pb2+ and Cr3+. The negative
effects of high Cd2+ levels on periphyton growth and development have been widely reported (Morin et al.,
2008a, b; Duong et al., 2008, 2010).Continuous exposure of Cd2+ alone proved to be more toxic than the
continuous exposures of Cd2+/Pb2+ and Cd2+/Cr3+ mixtures suggesting an ameliorative effect of Pb2+ and Cr3+
on the toxicity of Cd2+ i.e. antagonistic interference of Pb2+ and Cr3+ on the toxic effects of Cd2+. This, as far
as we know, has not been demonstrated in the literature and is an important observation given the fact that
metals usually occur as mixtures in nature (Bere and Tundisi, 2010). Devi Prasad and Devi Prasad (1982) have
demonstrated this antagonism between Ni2+/Cd2+ and Pb2+/Cd2+ mixtures for three freshwater green algae, but
not at community level.
Diatom community composition in relation to exposure scenarios
Differences in metal exposure scenarios manifested themselves through corresponding changes in diatom
community composition. Relatively similar patterns to those of algal cell densities were observed for diatom
species richness and diversity with increasing pulse frequency and duration (decreasing recovery period), and
with different pulse timing and metal mixtures (Figure 3). This is due to reasons discussed in the previous
sections (sections 3.1 to 3.4) emphasising the importance of metal pulse frequency, duration, recovery period,
timing and chemical type on aquatic life. However, contrary to the case of algal cell densities, differences in
diatom species richness and diversity were not statistically significant among some exposure scenarios (ANOVA,
p > 0.05) reinforcing the unreliability of diversity indices in biological monitoring of aquatic systems (de la Rey
et al., 2008).
22Figure 3: The mean values and standard deviations (n = 3) of diatom species richness (S) (gray bars)
and diversity (H`) (black circles) developed on glass substrates in 17 treatments during the course of
the experiment. L = light, D = dark, cont = continuous, P = pulse, R = recovery.
Of the 118 diatom species belonging to 45 genera that were recorded in all the treatments during the course
of the study, 12 dominant diatom species, with mean relative abundances >5% and present in at least two
communities, were described as characteristic of each diatom community developed throughout the experiment
(Figure 4). Increasing pulse frequency and duration (decreasing recovery period) resulted in corresponding
increase in Achnanthidium minutissimum (Kützing) Czarnecki and Nitzschia palea (Kützing) Smith and decrease
in Encyonema silesiacum (Bleisch) Mann, Eunotia bilunaris (Ehrenberg), Gomphonema angustatum (Kützing)
Rabenhorst, G. gracile Ehrenberg, G. parvulum (Kützing) Kützing, Navicula cryptocephala (Grunow) Cleve,
Nitzschia amphibia Grunow, and N. linearis (Agardh) Smith (Figure 4). The relative abundances of A. minutissimum
and N. palea were highest in continuous exposure scenarios, especially Cd2+ treatment. A. minutissimum and N.
palea were generally higher in dark pulse exposures compared to light pulse exposures of the same duration
and frequency for all the contaminants.
Changes in relative abundance of dominant diatom taxa with increasing pulse frequency and duration (decreasing
recovery period) (Figure 4) were also confirmed by the PCA conducted to investigate taxonomic differences
among the different treatments (Figure 5). The PCA clearly separated communities from 12 hr pulse/12 hr
recovery, 24 hr pulse/24 hr recovery period and continuous exposures from the rest of the communities
regardless of pulse timing and metal mixture (Figure 5a). These communities were positively associated with
the first axis of the PCA that accounted for 78.6 % of the total variation, with communities from continuous
exposure treatments being more positively associated to this axis compared to other communities. The first PCA
axis was also strongly positively associated with A. minutissimum followed by N. palea emphasising the strong
association of these species with increased frequency and duration of metal pulses. The remaining communities
(all negatively associated to the first PCA axis) were in turn separated in to two groups i.e. the control, Cd2+/
Cr3+ 12 hr pulse/36 hr recovery (light and dark) and Cd2+/Cr3+ 24 hr pulse/60 hr recovery were separated from
23You can also read