100 North Main Memphis, TN - www.flco.com OFFICE: 317.819-1572 CELL: 317-679-3854 - Downtown Memphis Commission
←
→
Page content transcription
If your browser does not render page correctly, please read the page content below
100 North Main
 Memphis, TN

 For More Information Contact:
         Ryan Cronk
          Principal
Flaherty & Collins Properties
     rcronk@flco.com
   OFFICE: 317.819-1572
    CELL: 317-679-3854

     www.flco.com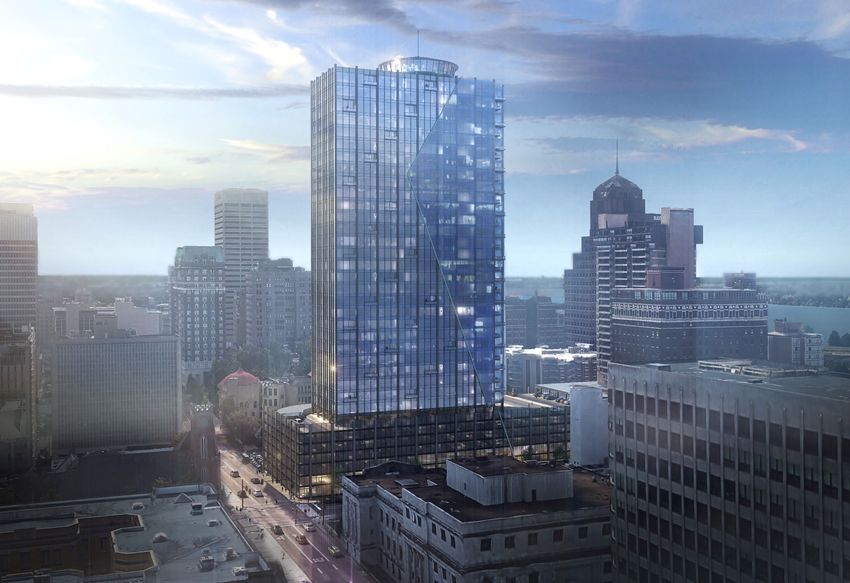
TABLE OF
 CONTENTS
1.   Project Team Overview                 03
      1. Flaherty & Collins Development    04
      2. Construction Lending Partners     14
      3. Moody-Nolan Architecture          15
      4. HOAR Construction                 17
2.   Commitment to Diversity & Inclusion   19
3.   Project Scope                         23
4.   Site Plans
      1. Location                          25
      2. Site Plans                        26
      3. Renderings                        30
5.   Financials
      1. Summary                           33
      2. Income                            34
      3. Expenses                          35
      4. Sources & Uses                    36
      5. Cash Flow                         37
      6. Hard Costs                        38
6.   Project Timeline                      40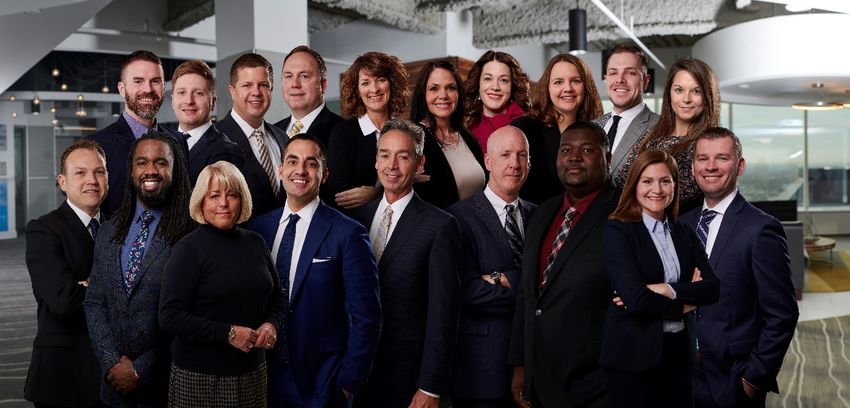
1.
PROJECT TEAM
OVERVIEW

1.1 Flaherty & Collins Development
Flaherty & Collins Properties (F&C) is a full-service, fully integrated company, consisting of three
main departments: Development, Construction and Management. The talented and experienced
professionals at F&C specialize in complex infill deals that have a public-private component.

Formed in 1993 by David. M. Flaherty and Jerry Collins, F&C has been consistently ranked as a
Top 50 developer nationally for the past eight years for multi-family developments based on
number of units built. Currently, F&C operates 75 properties and 11,948 units residential units
and approximately 500,000sf of commercial space

F&C has earned Accredited Management Organization (AMO®) designation from the Institute of
Real Estate Management (IREM®). This designation is given to an exclusive group of companies
that meets rigorous standards.
With over 450 employees, Flaherty & Collins focuses on building trust, managing long-term
partnerships and developing strong communication channels.

F&C develops to hold properties for the long term, and NOT merchant building. A typical deal for
F&C is procuring conventional construction financing with personal guarantees for the
construction period and converting to permanent debt once the property stabilizes. On the
permanent debt side, we do a lot of HUD, Fannie Mae and Freddie Mac loans on our stabilized
properties.

Development Team for 100 North Main

               David Flaherty                CEO
               Ryan Cronk                    Principal
               David Wingerson               Development Associate
               Brian Prince                  Principal
               Brandon Bogan                              Vice President, Preconstruction &
Design
               Anthony Heygood               Developer
               Kathy Desautels                            Director of Development Services
               Kyra Rimsans                  Corporate Counsel
                                                   4
DAVID FLAHERTY
                                                           Chief Executive Officer, Principal
                                                           38 Yearsof Experience

                                                           dflaherty@flco.com
                                                           “My visionfor Flaherty & CollinsPropertiesis
                                                           continuinggrowth – and we have the right people
                                                           in place tomake that happen. We have a proven
                                                           track record of performance, the experience
                                                           required, and the drive tobesuccessful inan ever
                                                           changingreal estate market.”

                                                           PROFESSIONAL EXPERIENCE
                                                           After graduating from law school in 1984, David
                                                           joined Revel Companies, an Indianapolis- based
                                                           full service real estate company, until 1993, when
                                                           he and Jerry Collins founded Flaherty & Collins
RESPONSIBILITIES                                           Properties.
David, along with his partner Jerry Collins, is
responsible for the strategic direction, operation,        EDUCATION
and profitability of Flaherty & Collins Properties.        BS Business, concentration in real estate, 1981
Working with his experienced development team,             Indiana University - Bloomington, Indiana
David is instrumental in seeking out real estate
opportunities and leading the process that turns           JD, School of Law, 1984
those opportunities into successful transactions for       Indiana University - Indianapolis, Indiana
his clients and his company. He has been
responsible for the completion of hundreds of real         PERSONAL
estate transactions including acquisitions,                Dave is married with two children. Dave enjoys
dispositions, development, and financing.                  snow skiing, running, and coaching children’s
                                                           athletics.
ACCREDITATIONS /
ORGANIZATIONS
National Association of Home Builders Multifamily
Division-Leadership Board
National Multi Housing Council
Board of Visitors/Indiana University School of
Business, Indianapolis
Indianapolis Bar Association
Indiana Real Estate Broker
Vision Communities, Inc. - Board Member

                                                       5
RYAN CRONK
                                                           Vice President, Development
                                                           Principal
                                                           24 Yearsof Experience
                                                           rcronk@flco.com
                                                           “Flaherty & CollinsPropertiesisthe leader in
                                                           Public-Private partnershipsin our industry.
                                                           Through strongpartnershipswith municipalities
                                                           throughout the Midwest, wedeliver on the
                                                           specificand unique development goalsof each
                                                           municipality by workingasa teamand respecting
                                                           the needsand desiresof the local community. ”

                                                           PROFESSIONAL EXPERIENCE
RESPONSIBILITIES                                           Ryan started his professional real estate career
Ryan’s responsibilities include identifying and            immediately after college, with a primary focus on
executing new development opportunities,                   retail and mixed-use developments throughout the
providing retail expertise on all Flaherty & Collins       country. His experience includes:
Properties projects which include retail
components, providing design and development               Premier Properties USA – Indianapolis, Indiana
ideas on all Flaherty & Collins Properties projects,               Executive Vice-President of
and explore new business opportunities that align                  Development & Acquisitions
with Flaherty & Collins Properties goals and
objectives.
                                                           PERSONAL
EDUCATION                                                  Ryan is married with three children. He has served
Bachelor’s degree in Kinesiology                           on Spring Mill School’s Executive Committee PTO
Indiana University - Bloomington, Indiana                  Board, as well has been Co-President of the PTO.
                                                           Ryan currently works in various supportive roles
                                                           with the Washington Township School District.
ACCREDITATIONS /                                           Ryan enjoys traveling, running, skiing, and learning
ORGANIZATIONS                                              from his kids.
Indiana Real Estate Salesperson License
International Council for Shopping Centers (ICSC)
Indiana Apartment Association (IAA)

                                                       6
BRIAN R. PRINCE II
                                                           Vice President, Development
                                                           12 Yearsof Experience

                                                           bprince@flco.com
                                                           “By combiningmy legal background with my
                                                           knowledge of commercial real estate, I hope to
                                                           bringvalue toeach project. Additionally, I will use
                                                           these acquired skillstocontinue tohelp Flaherty &
                                                           CollinsPropertiesobjective totransform
                                                           communitiesacrossthe country.”

                                                           PROFESSIONAL EXPERIENCE
                                                           Brian is responsible for site selection for mixed-use
                                                           multifamily opportunities across the country. As VP
RESPONSIBILITIES                                           of Development, Brian oversees every aspect of
                                                           development from the entitlement phase through
Brian is responsible for identifying new markets for
                                                           construction and lease up. Brian has extensive
development opportunities as well as assisting in
                                                           experience working with communities on true Public
procuring tax credits for projects. Additionally,
                                                           Private Partnership projects. Brian is currently
Brian analyzes financial projections, budgets, and
                                                           overseeingseveral largescaleP3 developments that
overall feasibility of a project, while also working
                                                           are urban infill opportunities that will transform the
with local communities and property management
                                                           communities they are located in. Brian has worked
to ensure the overall success of projects.
                                                           with Ambrose Property Group and the Indiana
                                                           Economic Development Corporation (IEDC) prior
EDUCATION
                                                           to joining F&C. His experience at the IEDC allowed
                                                           him to leave with a vast knowledge of development
J.D.
                                                           related tax credits.
Indiana University -
Robert H. McKinney School of Law
                                                           Thomas Law Group (Zionsville, IN)
Indianapolis, IN
                                                                  Law Clerk
B.A, General Studies
                                                           Indiana Economic Development Corporation
Indiana University - Indianapolis, IN
                                                           (Indianapolis, IN)
                                                                    Legal Intern
ACCREDITATIONS
Urban Land Institute (ULI)                                 Ambrose Property Group
ULI National Public/Private Partnership Panel              (Indianapolis, IN)
Licensed Indiana Real Estate Broker                                 Development Intern

PERSONAL
Brian enjoys playing sports and attending sporting
events.

                                                       7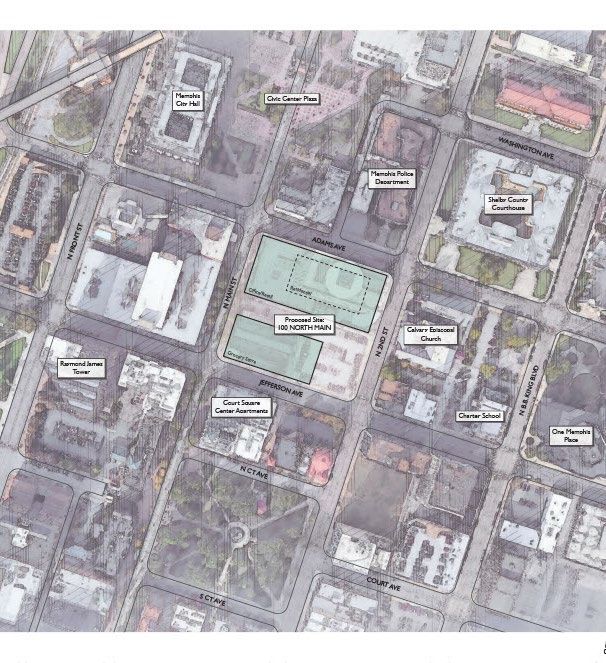
BRANDON D. BOGAN,
                                                         AIA, LEED AP
                                                         Vice President,
                                                         Preconstruction & Design Services
                                                         19 Yearsof Experience

                                                         bbogan@flco.com
                                                         “In order toachieve true success, the visionand
                                                         strategiesnecessary for achievement must be
                                                         established at the very onset of every project.
                                                         Through collaborationand focusonthese, we can
                                                         achieve not only project success, but ultimately
                                                         achievement of our mission toCreate a Lasting
                                                         Legacy. ”

                                                         PROFESSIONAL EXPERIENCE
RESPONSIBILITIES                                         After graduating from Ball State University in
Brandon oversees all design and preconstruction          2002, Brandon spent over 10 years in the
services at Flaherty & Collins Properties as a key       architectural industry developing and honing his
team member of our construction and                      design and management skills on a wide range of
development teams, collaborating with project            public and private sector projects. Brandon is well
partners, managers and developers to ensure the          versed in all aspects of project delivery from initial
overall vision of a project is not only met, but         concept through project implementation.
exceeds expectations, while monitoring budget
goals and quality aspects of selections.                 Flaherty & Collins Properties (Indianapolis, IN)
                                                                  Director, Design & Preconstruction
EDUCATION                                                         Services
Bachelor of Architecture
Bachelor of Science, Environmental Design                CSO Architects (Indianapolis, IN)
Ball State University – Muncie, IN                              Principal

ACCREDITATIONS                                           PERSONAL
National Council of Architectural Registration           Brandon is married with two daughters. Brandon
Boards (NCARB)                                           enjoys boating, kayaking, running and all types of
American Institute of Architects (AIA)                   outdoor activities.
LEED Accredited Professional

                                                     8
ANTHONY HEYGOOD
                                                            Developer
                                                            7 Yearsof Experience

                                                            aheygood@flco.com
                                                            “Developinga truly sustainable future isthe will
                                                            of today'ssociety. It iswith foresight,
                                                            determination and the intent of the courageous
                                                            tosecure thisreality. I will help lead the focused
                                                            path forward.”

                                                            PROFESSIONAL EXPERIENCE
                                                            After graduating from Purdue University and
                                                            pursing an injury shortened career as a professional
RESPONSIBILITIES                                            athlete, Anthony developed a college campus
                                                            concierge business while building a career as a
Anthony initiates Public Private Partnerships with
                                                            Realtor and Real Estate Investor in Indianapolis.
municipalities who are looking to develop catalyst
                                                            Having managed asset portfolios, acquired single
infill multifamily development projects. In
                                                            family investment properties for portfolios and
developing these projects, Anthony focuses on net-
                                                            rehabbed several single-family homes, Anthony
zero and solar applications to increase the viability
                                                            learned multi-family development through a
and longevity of the project. Additionally, Anthony
                                                            master’s program before interning in the industry.
analyzes financial projections, budgets, use of
                                                            Growing two successful businesses before entering
social, climate and green infrastructure bonds, while
                                                            the development world allows Anthony to develop
also working with local communities to reduce the
                                                            efficient strategic processes to deliver complex
carbon footprint in new and existing developments.
                                                            projects effectively.
EDUCATION
                                                            Flaherty & Collins Properties (Indianapolis, IN)
Bachelor of Liberal Arts, Kinesiology                                Development Associate
Bachelor of Liberal Arts, Women’s Studies                            Intern
Purdue University - West Lafayette, IN
                                                            FC Tucker Co. (Indianapolis, IN)
ACCREDITATIONS                                                     Realtor
Indiana Licensed Real Estate Broker
                                                            Highgarden Real Estate (Indianapolis, IN)
PERSONAL                                                            Realtor
Anthony enjoys weightlifting, recreational sports,
cryptocurrency trading, entrepreneurial advising            Professional Athlete - NFL
and training athletes. Anthony cites his family as                   Carolina Panthers
the driving force behind his dedication to develop a                 Seattle Seahawks
better and more sustainable planet.

                                                        9
KATHY DESAUTELS
                                                          Director of Development Services
                                                          35 Yearsof Experienced

                                                          kdesautels@flco.com
                                                          “Sometimes, development can seemlike a cookie
                                                          cutter business. But at Flaherty & Collins
                                                          Properties, we customize our projects.
                                                          Everythingfromthe bathroomfloor tothe
                                                          outside patios, we provide a product that best
                                                          fitsthe community.”

                                                          PROFESSIONAL EXPERIENCE
                                                          Kathy has over 30 years of experience in all facets
                                                          of property development and management. Her
                                                          experience includes:
RESPONSIBILITIES
Kathy serves as liaison between the development,          Pinnacle Properties Management Group
management, and construction teams during                 (Bloomington, IN)
multifamily project development. She is directly                  Senior Property Manager
involved with the design of site layouts, floor plans,
and clubhouses; the unit mix; and selection of            Revel Real Estate Services (Indianapolis, IN)
interior and exterior finishes. She directs the                   Property Manager
project marketing strategy, including theme and
logo development and leasing materials design.            F.C. Tucker Company (Indianapolis, IN)
She works with the construction team as                            Sales Associate
modifications are made to original building plans
and selected materials. She ensures all phases of         PERSONAL
the development process work together so that the         Kathy enjoys family vacations in Florida and
end product exceeds expectations.                         Colorado, and spending time with her nieces and
                                                          nephews.
EDUCATION
Ball State University - Muncie, Indiana

ACCREDITATIONS /
ORGANIZATIONS
Indiana Real Estate License
Continuing Education: Certified Property
Management Courses 310, 400, 500, 800

                                                         10
KYRA RIMSANS
Corporate Counsel
12 Yearsof Experience
krimsans@flco.com
“I enjoy devisingcreative solutionswhich
facilitatesa transactionand furthersthe
company’svisiontocontinuetogrow.”
PROFESSIONAL EXPERIENCE
While in private practice, Kyra handled complex real
estate transactions including acquisition and disposition
of commercial real estate, development, financing,
RESPONSIBILITIES leasing, and land use. Prior to law school, Kyra worked
As Corporate Counsel, Kyra works directly with the as a bank examiner for the Indiana Department of
company’s CEO, CFO, and the development team Financial Institutions.
on all real estate and contractual matters.
Barnes & Thornburg LLP (Indianapolis, IN)
Partner
ACCREDITATIONS / ORGANIZATIONS
Licensed Attorney in Indiana Indiana Department of Financial Institutions
U.S. District Court, Southern District of Indiana (Indianapolis, IN)
IndyBar Association Bank Examiner
LEED® Green Associate – United States Green
Building Council EDUCATION
USGBC Indiana – Central Chapter Doctor of Jurisprudence
IndyCREW Indiana University School of Law – Indianapolis, IN
Leadership Indianapolis Graduated manga cum laude
Stanley K. Lacy Executive Leadership Series – Class
XXXVI Bachelor of Science - Business Administration
United Way of Central Indiana Executive Women’s Butler University – Indianapolis, IN
Leadership Series Graduated cum laude and with High Honors in
Women’s Fund of Central Indiana OPTIONS – Finance
Class XXIII
FBI Indianapolis Citizens’ Academy HONORS
Starfish Initiative
The Best Lawyers in America – Real Estate Law –
Dress for Success
2019
Butler University Young Alumni Board of Directors
Junior Achievement Indy’s Best and Brightest
Finalist – Law – 2014
PERSONAL Indiana Lawyer’s Leadership in Law Award, Up and
Kyra enjoys attending concerts, traveling, and hot air Coming Lawyer - 2012
ballooning.
11Public Private Partnerships
Project Name Total Development Municipality Partner
Cost
360 Market Square $121,000,000 City of Indianapolis, IN
4th & Race $80,000,000 City of Cincinnati, OH
Ninety7Fifty $65,000,000 Village of Orland Park, IL
Axis $74,483,000 City of Indianapolis, IN
The Heights at Linden $26,333,000 City of Gladstone, MO
Square
The Depot at Nickel Plate $40,753,232 City of Fishers, IN
The Boulevard at Oakley $39,200,000 City of Cincinnati, OH
Station
Cosmopolitan on the Canal $38,500,000 City of Indianapolis, IN
The Residence at the COR $33,875,000 City of Ramsey, MN
2700 University $53,671,846 City of St. Paul, MN
Union | Berkley Riverfront $80,000,000 City of Kansas City, MO
Park
The Breakwater (New $24,937,849 City of New Albany, IN
Albany)
The Cove at 47th $70,000,000 Cape Coral, FL
12Public Private Partnerships
Project Name Total Development Municipality Partner
Cost
306 Riverfront $25,970,026 City of Kokomo, IN
Diane’s House $13,262,787 Washington, D.C.
Steelpointe Harbor $174,000,000 City of Bridgeport, CT
Stonewater at the Riverwalk $28,000,000 City of Elkhart, IN
The Mill at Ironworks Plaza $42,000,000 City of Mishawaka, IN
The Arbuckle $37,500,000 City of Brownsburg, IN
The Annex $85,000,000 City of Tulsa, OK
River Haus $42,000,000 City of Covington, KY
St. Elizabeth $110,810,300 Washington, D.C.
The Yards $41,000,000 City of Kansas City, MO
The Yards Phase II $50,000,000 City of Kansas City, KS
Jazz Hill $30,375,000 City of Kansas City, MO
The Ascent at Top of the Hill $80,000,000 City of Cleveland
Heights, OH
The Banks $38,770,000 City of La Porte, IN
ONE at The Peninsula $85,000,000 City of Columbus OH &
Franklin County
Finance
Whiskey River $31,500,000 City of Lawrenceburg,
IN
131.2 Construction Lending Partners
Construction Lending Partners
BMO Harris Bank
Bank OZK
Goldman Sachs
Merchants Bank
First Financial
PNC
Fifth Third Bank
First Merchants
National Bank of Omaha
Busey Bank
Huntington Bank
Citizens Bank
Lake City Bank
Centier Bank
1st Source Bank
Regions Bank
141.3 Mody-Nolan Architecture
151.3 Moody-Nolan Architecture
161.4 HOAR Construction
172. COMMITMENT TO DIVERSITY & INCLUSION
2. COMMITMENTPTO DIVERSITY & INCLUSION
                                ROFORMA

The Flaherty & Collins Properties (FCP) team is fully committed to
maximizing economic opportunities for residents and businesses
corporately and in the communities in which we develop properties.
F&C has extensive experience and involvement working with
Minority and Women Business Enterprise firms, local construction
trade groups and local governments to ensure our projects promote a
high level of diversity from beginning to end.

This commitment begins during the design phase. Moody Nolan, the
largest African American owned and managed architecture firm in
the country, has been engaged by FCP to lead the design efforts.
Furthermore, it is the goal of the FCP team to fill out the remainder
of the design team with a high percentage of local, MBE and WBE
design team members.

This commitment will be carried through into the construction phase
by our construction partner, HOAR construction. This includes
specifically meeting Local Hiring and MBE/WBE goals through the
Business Enterprise Participation plan (outlined in the following
pages). A significant percentage of the FCP developments have
these requirements and we strive to meet or exceed these established
goals. You can expect the same commitment from the Flaherty &
Collins Properties team on this project as well.

                                   19
2. COMMITMENT TO DIVERSITY & INCLUSION
Construction Team
202. COMMITMENT TO DIVERSITY & INCLUSION
Construction Team
213. PROJECT SCOPE
3.
PROJECT SCOPE
Residential Units: 310 Residential Units (453,594 total square feet)
• 67 Studio Units (Averaging 639 square feet per unit – 22%)
• 109 One Bedroom Units (Averaging 900 square feet per unit – 35%)
• 122 Two Bedroom Units (Averaging 1,299 square feet per unit – 39%)
• 12 Three Bedroom Units (Averaging 1,892 square feet per unit – 4%)
Grocery:
• 25,000 square foot urban format grocer
Commercial Space (Restaurant/Retail/Office/Other)
• 53,500 square feet of office space and 18,000 square feet of
retail/commercial space
Structured Parking:
• 604 Total Parking Garage Stalls
- 310 Dedicated Residential Spaces
- 294 Garage Stalls for additional commercial space users
Surface Parking:
• Approximately 60-80 additional surface parking stalls
234. SITE PLANS
4.1 Location

               25
4.2 Site Plans
264.2 Site Plans
274.2 Site Plans
284.2 Site Plans
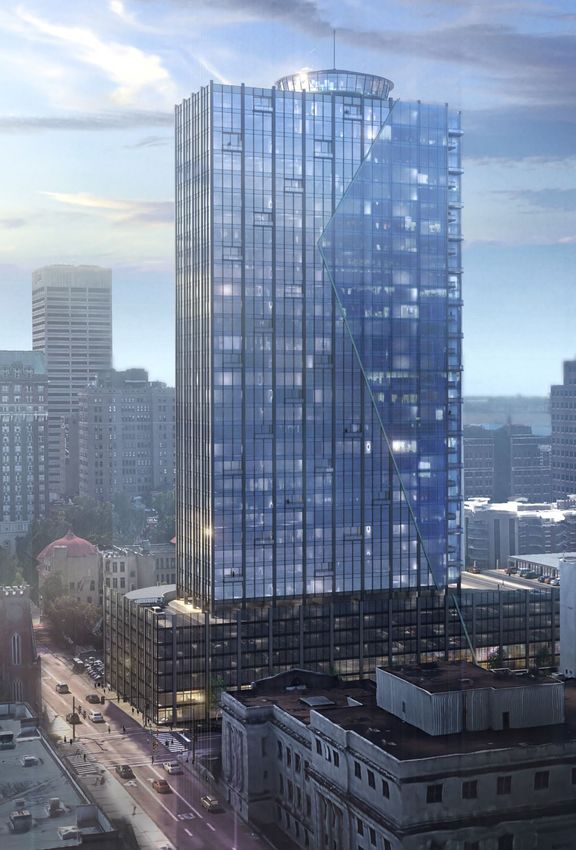
294.3 Renderings
304.3 Renderings
315. FINANCIALS
5.1 Summary
MULTIFAMILY INCOME Unit SF Units Unit Mix Rents Monthly Annual RSF Rent/SF DEVELOPER PROJECT COSTS Total /Unit /NSF
Land $4,116,000 $13,277 $12.78
One Bedroom / One Bath 801 176 57% $1,781 313,430 3,761,160 140,913 2.22 Hard Construction Costs $120,268,500 $387,963 $373.39
Two Bedroom / Two Bath 1,299 122 39% $2,950 359,900 4,318,800 158,478 2.27 Architectural & Engineering
Three Bedroom / Three Bath 1,892 12 4% $3,250 39,000 468,000 22,704 1.72 AArchitectural & Engineering Fees 4,780,337 15,420 14.84
TOTAL / AVERAGE 1,039 310 100% $2,298 $712,330 $8,547,960 322,095 $2.21 Legal & Organizational
Vacancy 6.77% ($48,255) ($579,055) Real Estate Attorney / Legal Fees 300,000 968 0.93
EFFECTIVE INCOME - MULTIFAMILY $664,075 $7,968,905 Organizational - Partnership 5.00% 10,000 32 0.03
Title Insurance & Recording 55,000 177 0.17
COMMERCIAL INCOME SF Rent/SF Monthly Annual Marketing & Lease-Up
Retail Gross Income 96,500 $6.47 52,000 624,000 Furniture, Fixtures & Equipment 845,025 2,726 2.62
Less: Vacancy 10.0% $ (0.65) (9,623) (115,475) PWorking Capital, Pre-Leasing, Travel 325,000 1,048 1.01
NNN Reimbursable $ 5.50 44,229 530,750 Commercial Leasing Commissions - 6.00%/10 yrs 336,960 1,087 1.05
EFFECTIVE INCOME - COMMERCIAL 96,500 $ 10.77 $86,606 $1,039,275 Leasing Incentive Fee - $300/unit $300 93,000 300 0.29
Less: Expenses (incl. Taxes) $ (6.00) (48,250) (579,000) Lease-Up Operating Deficit / Working Capital 226,678 731 0.70
NET OPERATING INCOME - COMMERCIAL $ 4.77 $38,356 $460,275 Financing
INet Construction Interest - 5.00% 3,738,027 12,058 11.61
OLender Inspections 25,000 81 0.08
OTHER INCOME Units Rents Monthly Annual COrigination Fee Senior Debt - 0.75% 0.00% 562,500 1,815 1.75
Garages 279 120.00 33,480 401,760 Origination Fee F&C - 0.25% 0.00% 187,500 605 0.58
Miscellaneous 310 105.75 32,783 393,390 Miscellaneous Financing Fees /sq. ft. - - -
TOTAL $66,263 $795,150 General & Administrative
Vacancy 6.77% (4,489) (53,865) Third Party Reports 15,000 48 0.05
EFFECTIVE OTHER INCOME $61,774 $741,285 Insurance 175,000 565 0.54
33
Property Taxes 100,000 323 0.31
TOTAL EFFECTIVE INCOME $725,849 $9,749,465 DLand Broker Fee - 0.00% - - -
CMunicipality Fees 150,000 484 0.47
OPERATING EXPENSES - MULTIFAMILY Unit/Year Annual Construction Administration Fee - 0.00% - - -
Operating Expenses - Non-Controllable 5,124 1,588,532 Tenant Improvements - $30/sq. ft. 540,000 1,742 1.68
Property Insurance 350 108,500 Other Development Fees
Real Estate Taxes 3,650 1,131,500 Development Contingency - 5.00% 6,013,425 19,398 18.67
OPERATING EXPENSES (BEFORE RESERVES) $9,124 $2,828,532 TDeveloper Overhead - 5.00% 6,956,246 22,440 21.60
Replacement Reserves 200 62,000 TOTAL PROJECT COSTS $149,819,199 $483,288 $465.14
OPERATING EXPENSES % of Gross Income 29.65% $9,324 $2,890,532
SOURCES OF FUNDS Total /Unit /SF
TOTAL OPERATING EXPENSES $3,469,532 CEquity 50% 74,819,199 241,352 232.29
Construction Loan 50% 75,000,000 241,935 232.85
NET OPERATING INCOME $6,279,933 Other Sources 0% - - -
TOTAL SOURCES $149,819,199 $483,288 $465.14
ECONOMIC VALUE Value Return
Net Operating Income 6,279,933 UNDERWRITING LTV/Cost Max Loan
Market Capitalization Rate 5.50% Income Based Value 114,180,597 80% 91,344,478
Income Based Value 114,180,597 Maximum Development Cost 149,819,199 65% 97,382,479
Total Development Cost 149,819,199 4.19% Debt Service Coverage 30 6.00% 5,202,065 1.20 72,305,074
Land (4,116,000) Debt Service Coverage Less Taxes 30 5.25% 6,333,565 1.25 95,580,148
Office (12,358,500) Maximum Loan Proceeds $72,305,074
Net Development Cost 133,344,699 4.71% 73,881,563
Additional Incentives (40,750,000) SUBSIDY REQUIREMENTS
$ 92,594,699 6.78% Required Yield 6.75%
Max Dev Cost 92,481,162
Actual Dev Cost 149,819,1995.2 Income
RESIDENTIAL INCOME # of Unit Unit Rentable Rent / Rent / Monthly Annual
Units Mix % Net SF SF Unit SF Income Income
1 Bedroom / 1 Bath 67 22% 639 42,813 $1,465 $2.29 $98,155 $1,177,860
1 Bedroom / 1 Bath 109 35% 900 98,100 $1,975 $2.19 $215,275 $2,583,300
2 Bedroom / 2 Bath 122 39% 1,299 158,478 $2,950 $2.27 $359,900 $4,318,800
3 Bedroom / 2 Bath 12 4% 1,892 22,704 $3,250 $1.72 $39,000 $468,000
TOTAL / AVERAGE 310 100% 1,039 322,095 $2,298 $2.21 $712,330 $8,547,960
GROSS POTENTIAL RENTS $712,330 $8,547,960
Less: Apartment Vacancy @ 6.77% (48,255) (579,055)
EFFECTIVE RENTAL INCOME $664,075 $7,968,905
COMMERCIAL INCOME Rentable Rent / Monthly Annual
SF SF Income Income
Grocery 25,000 $12.00 $25,000 $300,000
Retail 18,000 $18.00 $27,000 $324,000
Office 53,500
TOTAL / AVERAGE 96,500 $6.47 $52,000 $624,000
GROSS POTENTIAL INCOME $52,000 $624,000
N/N/N Reimbursement $5.50 $44,229 $530,750
Less: Commercial Vacancy - Rent @ 10.00% (0.65) (5,200) (62,400)
Less: Commercial Vacancy - N/N/N @ 10.00% (0.55) (4,423) (53,075)
EFFECTIVE INCOME $86,606 $1,039,275
PREMIUM / OTHER INCOME Number Fee / Income / Monthly Annual
of Units Unit Unit Income Income
Parking 279 $120 $97.20 $30,132 $361,584
View Premiums 139 $75 $33.70 $10,448 $125,370
Storage Units 30 $25 $2.42 $750 $9,000
Trash Revenue 279 $25 $20.25 $6,278 $75,330
Utility Reimbursement 279 $3 $2.23 $691 $8,286
Premium Bike Parking 10 $30 $0.97 $300 $3,600
Application Fees 23 $50 $3.71 $1,150 $13,800
Administration Fees 23 $150 $11.13 $3,450 $41,400
Late & NSF Fees 310 $50 $2.00 $620 $7,440
Flat Pet Fees 78 $25 $6.25 $1,938 $23,250
Pet Registration Fees 7 $250 $5.65 $1,750 $21,000
Guest Suite 310 $15 $12.00 $3,720 $44,640
Cable Income 310 $50 $3.20 $992 $11,904
Short Term Premim 310 $75 $2.25 $698 $8,370
TOTAL / AVERAGE $202.95 $62,915 $754,974
GROSS OTHER INCOME $62,915 $754,974
Less: Other Income Vacancy @ 6.77% (4,262) (51,143)
EFFECTIVE OTHER INCOME $58,653 $703,831
TOTAL EFFECTIVE INCOME $809,334 $9,712,011
345.3 Expenses
RESIDENTIAL OPERATING EXPENSES % Effective
Per Unit Annual Income
Management Fee $839 $260,182 3.00%
General & Administrative $250 $77,500 0.89%
Payroll $1,800 $558,000 6.44%
Maintenance & Repair $250 $77,500 0.89%
Utilities $785 $243,350 2.81%
Painting & Decorating $245 $75,950 0.88%
Contracted Services $255 $79,050 0.91%
Advertising & Marketing $200 $62,000 0.72%
Annual Garage Expense $500 $155,000 1.79%
Insurance $350 $108,500 1.25%
RESIDENTIAL OPERATING EXPENSES $5,474 $1,697,032 19.59%
Real Estate Taxes $3,650 $1,131,500 13.06%
TOTAL RESIDENTIAL EXPENSES $9,124 $2,828,532 32.64%
COMMERCIAL OPERATING EXPENSES
Per Sq. Ft Annual
Management Fee $0.50 $48,250
Common Area Maintanence (CAM) $2.00 $193,000
Insurance $0.50 $48,250
Other
COMMERCIAL OPERATING EXPENSES $3.00 $289,500
Real Estate Taxes (Full Assessment) $3.00 $289,500
TOTAL COMMERCIAL EXPENSES $6.00 $579,000
TOTAL EXPENSES $10,992 $3,407,532
355.4 Sources & Uses
USES OF FUNDS Total Per Unit Per Net SF
LAND $4,116,000 $13,277 $12.78
HARD CONSTRUCTION COSTS $120,268,500 $387,963 $373.39
SOFT COSTS $25,434,699 $82,047 $78.97
Architectural & Engineering
Architectural 4,630,337 14,937 14.38
Engineering - - -
Miscellaneous A & E - - -
A & E Services Fee 150,000 484 0.47
Legal & Organizational
Real Estate Attorney 150,000 484 0.47
Construction Loan - Borrower 75,000 242 0.23
Lenders Legal - Construction Loan 75,000 242 0.23
Organizational - Partnership 10,000 32 0.03
Title Insurance & Recording 55,000 177 0.17
Marketing & Lease-Up
Furniture, Fixtures & Equipment 845,025 2,726 2.62
Pre-Leasing Marketing 150,000 484 0.47
Start-Up Costs / Travel 175,000 565 0.54
Commercial Leasing Commissions - 6.00%/10 yrs 336,960 1,087 1.05
Leasing Incentive Fee - $300/unit 93,000 300 0.29
Lease-Up Operating Deficit / Working Capital 226,678 731 0.70
Financing
Net Construction Interest - 5.00% 3,738,027 12,058 11.61
Lender Inspections 25,000 81 0.08
Origination Fee Senior Debt - 0.75% 562,500 1,815 1.75
Origination Fee F&C - 0.25% 187,500 605 0.58
Parse Fee - - -
Equity Interest - - -
Other - - -
General & Administrative
Third Party Reports 15,000 48 0.05
Insurance 175,000 565 0.54
Property Taxes 100,000 323 0.31
Land Broker Fee - 0.00% - - -
Municipality Fees 150,000 484 0.47
Tenant Improvements - $30/sq. ft. 540,000 1,742 1.68
Other Development Fees
Development Contingency - 5.00% 6,013,425 19,398 18.67
Developer Overhead - 5.00% 6,956,246 22,440 21.60
TOTAL USES OF FUNDS $149,819,199 $483,288 $465.14
SOURCES OF FUNDS
Equity $74,819,199
Investor Equity 74,819,199
Developer Equity 17,594,699
Office - City Owned 12,358,500
Additional Incentives 40,750,000
Land Contribution 4,116,000
Non-Cash Equity / Deferred Fees -
Deferred Developer Overhead -
Land Contribution -
Other Contributed Fees -
Construction Loan $75,000,000
Deferred Developer Overhead (0)
TOTAL SOURCES OF FUNDS $149,819,199
365.5 Cash Flow
Construction & Lease-up Period
1 2 3 4 5 6 7 8 9 10
* Fiscal Period beginning March 1 2023 2024 2025 2026 2027 2028 2029 2030 2031 2032
Occupied Units (at year end) 0 0 122 122 122 122 122 122 122 122
% Occupied 0.00% 0.00% 39.35% 39.35% 39.35% 39.35% 39.35% 39.35% 39.35% 39.35%
Commercial Sq. Ft. Occupied - - 86,850 86,850 86,850 86,850 86,850 86,850 86,850 86,850
% Commercial Occupied 0.00% 0.00% 90.00% 90.00% 90.00% 90.00% 90.00% 90.00% 90.00% 90.00%
EFFECTIVE INCOME - - 3,892,474 $9,712,011 9,857,691 10,005,556 10,155,639 10,307,974 10,462,594 10,619,532
Operating Expenses - - (397,124) ($3,407,532) (3,458,645) (3,510,525) (3,563,183) (3,616,630) (3,670,880) (3,725,943)
INCOME FROM OPERATIONS - - 3,495,349 6,304,478 6,399,046 6,495,031 6,592,457 6,691,344 6,791,714 6,893,590
Capital Reserves - - - (62,000) (62,000) (62,000) (62,000) (62,000) (62,000) (62,000)
NET OPERATING INCOME - - 3,495,349 6,242,478 6,337,046 6,433,031 6,530,457 6,629,344 6,729,714 6,831,590
DEBT SERVICE - - 298,928 5,202,065 5,202,065 5,202,065 5,202,065 5,202,065 5,202,065 5,202,065
Interest - - 298,928 4,435,855 4,388,597 4,338,424 4,285,156 4,228,603 4,168,562 4,104,818
Principal - - - 766,210 813,469 863,641 916,909 973,462 1,033,503 1,097,247
37
Beginning First Mortgage Balance - 36,691,457 72,642,863 75,000,000 74,233,790 73,420,321 72,556,680 71,639,771 70,666,309 69,632,806
Loan-to-Value 60.07% 58.57% 57.07% 55.55% 54.03% 52.50% 50.96%
CASH FLOW - - 3,196,422 1,040,413 1,134,980 1,230,966 1,328,391 1,427,278 1,527,648 1,629,524
SALES PROCEEDS
Gross Sales Price - - - - - - - - - 136,631,790
Transaction Costs - - - - - - - - - (2,049,477)
Net Sales Proceeds - - - - - - - - - 134,582,313
Outstanding Debt - - - - - - - - - (69,632,806)
Gross Excess Sales Proceeds - - - - - - - - - 64,949,507
DISTRIBUTABLE CASH FLOW (17,594,699) - - 3,196,422 1,040,413 1,134,980 1,230,966 1,328,391 1,427,278 1,527,648 66,579,032
Cash-on-Cash 17,594,699 0.00% 0.00% 18.17% 5.91% 6.45% 7.00% 7.55% 8.11% 8.68% 9.26%
IRR (Levergaed) 17.77%
NET CASH FLOW 1,040,413 1,134,980 1,230,966 1,328,391 1,427,278 1,527,648 1,629,5245.6 Hard Costs
Number of Units 310 Rentable Sq. Ft. Residential 322,095
Number of Beds 456 Gross Sq. Ft. Clubhouse / Amenities 28,500
Number of Garage Spaces 604 Rentable Sq. Ft. Commercial 96,500
Total Per Unit Per Net SF
Division 1 General Conditions 0.00% - - -
Division 2 Sitework 2,500,000 8,065 7.76
Division 3 Concrete 82,000,000 264,516 254.58
Division 4 Masonry - - -
Division 5 Metals - - -
Division 6 Woods & Plastics - - -
Division 7 Thermal / Moisture Protection - - -
Division 8 Doors & Windows - - -
Division 9 Finishes - - -
Division 10 Specialties - - -
Division 11 Equipment - - -
Division 12 Furnishings - - -
Division 13 Special Construction - - -
Division 14 Conveying - - -
Division 15 Mechanical - - -
Division 16 Electrical - - -
SUBTOTAL $84,500,000 $272,581 $262.34
Other Costs
Office 11,770,000 37,968 36.54
Parking Structure 9,500,000 30,645 29.49
Grocery 5,000,000 16,129 15.52
Retail 3,960,000 12,774 12.29
0 - - -
BUILDING COST $114,730,000 $370,097 $356.20
Hard Cost Contingency 0.00% - - -
Builder's Overhead 2.50% 2,769,250 8,933 8.60
Builder's Profit 2.50% 2,769,250 8,933 8.60
TOTAL HARD COST $120,268,500 $387,963 $373.39
386. PROJECT TIMELINE
6. Project Timeline
Date               Milestone
February 1, 2022   Commence Development
                   Agreement Negotiations
June 1, 2022       Execute Development
                   Agreement
June 1, 2022       Commence Project
                   Construction Documents
January 1, 2023    Bid Construction
                   Documents
April 1, 2023      Close on Property –
                   Commence Construction
March 2025         Project Opening Date

                   40
One Indiana Square
Suite 3000
Indianapolis, IN 46204
317.816.9300
www.flco.comYou can also read