1H17 RESULTS PRESENTATION - Open Briefing
←
→
Page content transcription
If your browser does not render page correctly, please read the page content below
1H17 RESULTS
PRESENTATION
VILLA WORLD LIMITED
15 FEBRUARY 2017

                      1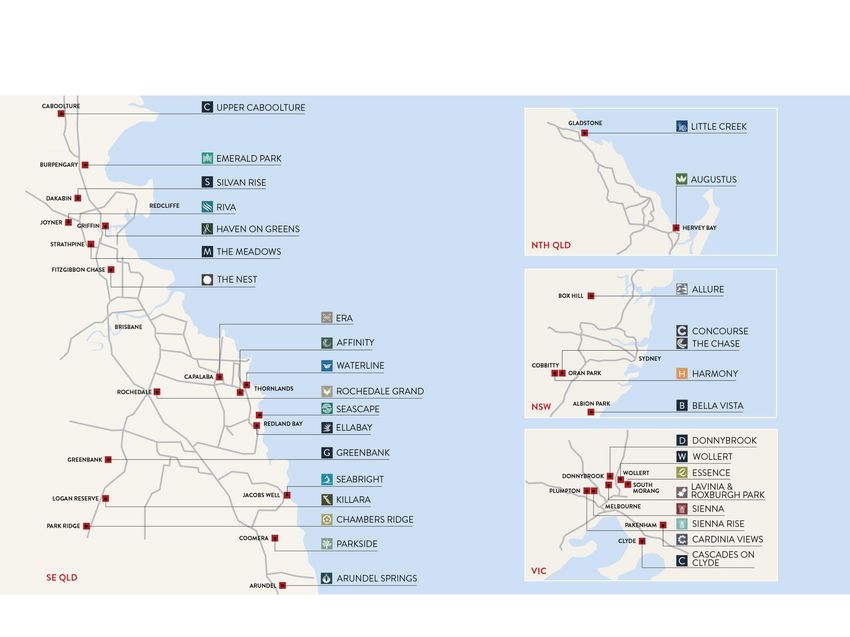
AGENDA

INTRODUCTION                   Craig Treasure, MD & CEO

COMPANY OVERVIEW               Craig Treasure, MD & CEO

1H17 RESULTS                   Paulene Henderson, CFO

MARKET CONDITIONS              Craig Treasure, MD & CEO

OUTLOOK                        Craig Treasure, MD & CEO

ANNEXURES

                                                          2
   1H17 RESULTS PRESENTATION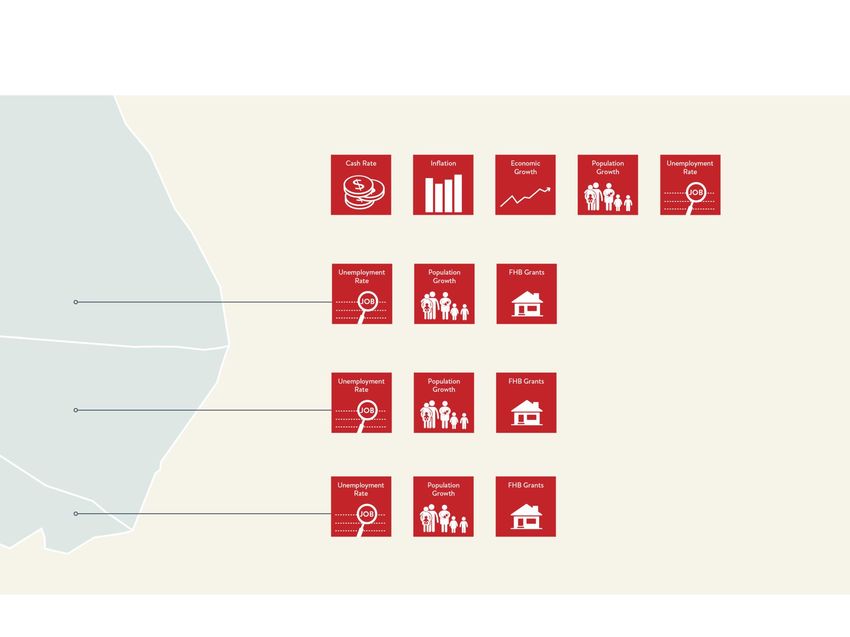
COMPANY OVERVIEW

Villa World acquires, develops and markets residential land and house and land estates.

Villa World is a leading east coast residential developer with development and construction operations across New South Wales, Queensland
and Victoria; and is proudly an ASX 300 company.

Villa World offers well-located land only product; as well as affordable to mid-priced ‘house and land’ packages under a no-variations, turnkey
model.

Today, more than 40,000 Australians call a Villa World address their home.

Villa World’s turnkey house and land model maintains a solid position across its core customers in the retail market (comprising owner
occupiers including first home buyers), as well as predominantly local investors. Villa World’s land estates are also sold to contract builders.

Villa World has delivered a track record of earnings growth and strong fully franked dividends under an experienced and proven management
team.

Villa World is committed to achieving its long-term goal of being recognised as a leading Australian property company. Villa World has
refined its strategy around three key themes: focus, grow and lead. These themes provide clear direction for Villa World’s approach to its
development portfolio, sales, operational delivery and capital management.

                                                                                                                                              3
     1H17 RESULTS PRESENTATION
COMPANY OVERVIEW
Portfolio and Acquisitions Strategy
Portfolio diversified by product type, price point and geography (across and within east coast States).
Targeting a portfolio of 5-6 years sales:
• 1H17 – 6,386 lots1; equivalent to 5.4 years sales2
Seeking to grow the portfolio, through disciplined and targeted acquisitions to:
• Grow New South Wales predominantly through partnering
• 218 lots3 acquired in 1H17
• Replenish Queensland
• 1,052 lots acquired in 1H17
• Grow Victoria
• 226 lots acquired in 1H17
Targeting NSW 20% / QLD 40% / VIC 40% geographical mix as cycles, markets and opportunities
allow.
• 1H17 – 4% / 72% / 24% respectively
Utilising capital efficient structures (including joint ventures and capital lite):
• 1H17 – 71% wholly owned, 29% capital efficient structures
1 Donnybrook englobo sale adjusted down from 510 lots to 2 lots (at 50% share).
2 Based on FY16 sales of 1,185 lots.
3Including 93 lots pursuant to a project management arrangement with Greenfield Development Corporation in Oran Park,
SW Sydney. Commercial terms agreed and development application lodged for initial ~90 lots, subject to finalising formal
documentation and satisfaction of conditions.
4
INTERIM FINANCIAL REPORT FOR THE YEAR ENDED 31 DECEMBER 2016COMPANY OVERVIEW
Sales and Delivery Strength
FY FY
16 17 GUIDANCE
at least 1185
FY FY
14 15 FY FY FY
15 16 17
FY
14
≠
SALES 1H17
HOMES 1H17
PER FY 831 843 1185 673 BUILT 425 654 632
291
LAND FY14 618
DELIVERED
FY15 840
FY16 1060
1H17
1H17
324
5
INTERIM FINANCIAL REPORT FOR THE YEAR ENDED 31 DECEMBER 2016RESULTS SUMMARY
Compound EPS growth of 14.9%
FY FY
FY
17 17
16 FY GUIDANCE
FY
37.5
FY 15 FY 16
14 FY 15
14
REVENUE NPAT
1H17 1H17
$(M) 229.5 321.6 387.0 209.4
$(M) 19.1 25.6 33.7 19.6
FY FY
FY
17 FY 17
GUIDANCE
FY
FY 16 33.1 FY 16 GUIDANCE
18.5
15 15
14 FY
14
EPS DIVIDEND
1H17
(CPS) 21.8 25.6 30.6 17.4 (CPS) 15 16 18
1H17
8
6
INTERIM FINANCIAL REPORT FOR THE YEAR ENDED 31 DECEMBER 20161H17 RESULTS
Profit & Loss
1H17 1H16
r%
Strong sales momentum (average of 112 per month) and excellent
($m) ($m) delivery resulted in strong revenue growth.
Revenue 209.4 200.2 5%
Gross margin of $54.7 million (26.1%).
Underlying Gross Margin 54.2 55.0 -2%
Underlying Gross Margin (%) 25.9% 27.5% -6% Project management fees - ongoing revenue stream.
Significant Items 0.5 0.0
Strong 1H17 profit, combined with strong carried forward sales, result
Gross Margin 54.7 55.0 -1% in an increased full year guidance.
Gross Margin (%) 26.1% 27.5% -5%
Interim dividend of 8 cps. Guidance of full year dividend of 18.5 cps,
Revenue from Joint Ventures and Associates 1.9 4.6 -59% representing a yield of ~7.7%, fully franked.
- Development and project management fee 1.0 1.2 -12%
- Share of profits 0.9 3.5 -74%
EBITDA 32.2 34.9 -8%
Statutory net profit before tax 28.0 28.5 -2%
Tax Expense (8.4) (8.1)
Statutory net profit after tax 19.6 20.4 -4%
1H17 1H16
r%
cps cps
EPS2 17.4 18.5 -6%
3
Dividend (cps) fully franked 8.0 8.0 0%
1
All aspects of the Silverstone proceedings w ere conlcuded in 1H17, w ith $0.5 million released back into profit
2
Basic earnings per share based on w eighted averages shares on issue of 112,728,788 (1H1: 110,344,277)
3
Ex dividend date 8 March 2017; Record date 9 March 2017; Payment date 31 March 2017
7
1H17 RESULTS PRESENTATION1H17 RESULTS
Operational Performance
Sales strengthened to an average of 112 sales per month.
Performance 1H17 1H16 Change
With projects at various points in the life cycle selling during the
Sales (lots)1 673 497 p 35% remainder of FY17, the Company expects to better its FY16 sales
Mean rate of sale pcm - HY 112.2 82.8 p 35%
performance of 1,185 sales.
Number of projects contributing to profit 19 17 p 12%
$191.6 million sales carried forward1 into 2H17 (554 lots) (1H16:
Settlements (# lots)2 - inc. Joint Ventures 592 550 p 8% $107.7 million / 311 lots).
Settlements (# lots) - ex. Joint Ventures 576 550 p 5%
Strong sales coupled with efficient delivery, resulted in a growing
- House and Land (# lots) 306 373 q -18%
number of settlements.
- Land Only (# lots) 269 176 p 53%
- Englobo Sale (# lots) 1 1 n/m n/m Revenue mix remains weighted towards house and land – 66%
(1H16: 76%).
- House and Land (%) 53% 68% q
- Land Only (%) 47% 32% p QLD was the main contributor to revenue – 84% (1H16: 86%).
Revenue - property sales ($m) 209.4 200.2 p 5%
- House and Land ($m) 138.7 151.2 q -8%
Average revenue per lot reflective of product mix.
- Land Only ($m) 68.5 43.0 p 60%
Price growth of 2-5% (like for like) at select estates.
- Englobo ($m) 2.2 6.0 n/m n/m
- House and Land (%) 66% 76% q
- Land Only (incl englobo) (%) 34% 21% p
Revenue - property sales ($k/Lot) 360.4 353.6 p 2%
- House and Land 453.3 405.3 p 12%
- Land Only (ex englobo) 254.7 244.0 p 4%
1
Sales - executed co ntracts, no t necessarily unco nditio nal.
2
A cco unting Settlements require cash settlement in New So uth Wales. In Queensland and Victo ria an unco nditio nal sales co ntract
1Totalsales value (including GST) for conditional and unconditional contracts not yet
and fo r land o nly, land registratio n; fo r ho use and land, land registratio n and a certificate o f building co mpletio n is required.
recognised as revenue, inclusive of proportional share of joint ventures.
3
Underlying Gro ss M argin is exclusive o f pro visio n fo r litigatio n.
8
1H17 RESULTS PRESENTATION1H17 RESULTS
Balance Sheet
1H17 FY16 Gearing target of 15–30%.
Balance Sheet
($m) ($m)
Assets Interest cover strong.
Cash 14.1 8.4
Receivables 52.0 72.4 Undrawn facility $65.1 million and strong cash flows.
Inventories 342.9 373.7
$190m Diversified debt facility with long term, staggered maturity.
Investments accounted for using the equity
22.7 18.5
method
• $140 million ANZ facility
Other 4.8 5.1
Total Assets 436.6 478.0 • $10 million maturing on 16 August 2018
Liabilities
Trade and other payables 35.4 45.1 • $80 million maturing on 1 March 2019
Land acquisitions payable 26.2 46.9
• $50 million maturing on 30 October 2020.
Interest bearing liabilities 111.1 128.6
Other 14.1 20.5 • $50 million Westpac facility
Total Liabilities 186.8 241.1
Net Assets 249.8 236.9 • maturing on 31 March 2019.
Net tangible assets 249.8 236.9
NTA ($ / Share) 2.20 2.15 Ongoing consideration will be given to capital management
Net Debt 97.0 120.2 strategies, including the diversification and maturity of the Company’s
debt facilities.
Net Debt : Equity (%) 38.8% 50.8%
Gearing1 23.0% 25.6%
Look Through Gearing2 23.2% 27.2%
3
Interest Cover 8.08 x 6.06 x
Capitalised borrowing costs (% of Inventory) 2.99% 2.63%
1
(Interest bearing liabilities - cash)/(To tal assets - cash)
2
Gearing when jo int ventures are pro po rtio nally co nso lidated.
3
Interest Co ver = EB ITDA / net cash interest (per Club facility)
9
1H17 RESULTS PRESENTATION1H17 RESULTS
Cash Flow
1H16 1H16 Strong cash flow from operating activities enabled
($m) ($m) the Company to:
Cash flows from operating activities
• Pursue growth opportunities through the
Receipts from customers (inc. GST) 249.8 209.8 development of existing portfolio
Receipts from the transfer of development rights - 25.4
Payments to suppliers and employees (inc. GST) (132.5) (128.6) • Reinvest in the business through value accretive
Cash generated from operating activities 117.3 106.6 acquisitions
Payments for land acquired (66.6) (53.1)
Net Interest paid (2.8) (3.4) • Continue the payment of strong dividends
Borrowing costs (0.0) (0.3)
• Maintain a strong balance sheet.
Corporate Tax Paid1 (5.1) -
GST (Paid) / Refund (8.5) (6.3)
Net cash inflow / (outflow) from operating activities 34.3 43.5
Net cash (outflow) / inflow from investing activities (3.0) (1.9)
Cash flows from financing activities
Net borrowings (repaid) / drawn (17.8) (45.8)
Proceeds from exercise of options 4.1 -
Payments for shares acquired by Employee Share Scheme Trust (0.4) -
Dividends paid (11.4) (11.0)
Net cash (outflow) / inflow from financing activities (25.5) (56.8)
Net (decrease) in cash and cash equivalents 5.8 (15.2)
Cash & cash equivalents at the beginning of the financial year 8.4 22.6
Cash & cash equivalents at the end of half year 14.1 7.4
1
The Company utilised all carried forw ard tax losses, and began paying cash tax in 2H16.
10
1H17 RESULTS PRESENTATIONMARKET CONDITIONS
Residential market drivers expected to remain positive
NATIONAL
1.5% 1.3% 1.8% 1.4% 5.6%
QLD
Key drivers remain in place:
6.0% 1.6% $20,000 • First home buyer grants
• Interest rates
NSW • Consumer confidence, driven by
employment.
5.0% 1.7% $10,000
Source:
1NationalStatistics - RBA snapshot (updated 7 December 2016)
VIC 2State Unemployment Rates - Queensland Treasury, Labour Force,
December 2016 (based on ABS 6202.0, released 19 January 2017)
3State Population Growth - Regional Population Growth, 2014-2015 (based
on ABS 3218.0, released 30 March 2016)
4 FHB Grants – Queensland Treasury, Office of State Revenue New South
Wales, State Revenue Office Victoria
5.9% 2.1% $10,000
11
INTERIM FINANCIAL REPORT FOR THE YEAR ENDED 31 DECEMBER 2016MARKET CONDITIONS
NEW SOUTH WALES
Consistent with diversification strategy, the Company has acquired 4 well-located projects offering 218 lots in SW Sydney and the Illawarra.
Intention to grow predominantly through partnering and capital lite.
Civil construction has commenced at Allure (NW Sydney), with first house and land settlements expected in 2H18.
Housing construction has commenced at Harmony and Concourse (SW Sydney); sales to commence upon completion of construction with
first house and land settlements expected in 2H17.
QUEENSLAND
Strong sales across all active projects in SE-QLD and Hervey Bay in 1H17, benefitting from positive economic conditions and jobs growth.
Median house price in Sydney is now double that of Brisbane – expected to result in increased interstate migration.
New flagship projects to be released in FY17 (Seascape, Arundel Springs and Killara), with first settlements anticipated in 2H17.
Anticipate growth in volumes and prices into FY18.
Acquisition of 750 lots (50% share) in Greenbank adds to strong pipeline of future projects – first settlements expected in 2H18.
VICTORIA
Positive residential market conditions continue benefitting from very strong population and jobs growth.
High level of sales and settlements across land, and house and land product, with strong carried forward sales at Cardinia Views and Sienna.
Market conditions anticipated to remain strong going into FY18.
Consistent with diversification strategy, the Company has acquired 2 well-located projects offering 226 lots in N and NE Melbourne.
Intention to grow through targeted acquisitions.
12
1H17 RESULTS PRESENTATION2017 OUTLOOK
FY17 GUIDANCE INCREASED
Full year guidance increased to $37.5 million (from $35.4 million), representing NPAT growth of 11% (FY16: $33.7 million). EPS of 33.1 cps
(FY16: 30.6 cps).
Guidance based on:
• Strong carried forward sales of $191.6 million (554 lots), with 86% of contracts (479 lots valued at $161.0 million) expected to settle in 2H17
• Strong 1H17 sales, averaging 112 per month. With projects at various points in the life cycle selling during the remainder of FY17, the
Company expects to better its FY16 sales performance of 1,185 sales
• Development program on track, with disciplined project execution and delivery.
FY17 PROFIT MIX
• Gross margin of 24-26%.
• Joint ventures to contribute $3.4 million (comprising development fees and share of profit) – strong ROI.
STRATEGIC RESTOCKING TO BUILD MEDIUM TERM EARNINGS PROFILE
• Replenish the medium term pipeline, to maintain 5 years sales. Focus on east coast growth corridors.
• Targeting NSW 20% / QLD 40% / VIC 40% geographical mix as cycles, markets and opportunities allow.
• Expected cash outflow for acquisitions of $60 – 85 million in FY17 plus $40 million in capital lite.
CAPITAL MANAGEMENT
• Continuing focus on diversification of funding and extension of tenure to support the Company’s growth objectives.
CONTINUED SHAREHOLDER RETURNS
• FY17 dividend expected to be 18.5 cents per share fully franked.
• Dividend policy of paying out 50-75% of annual NPAT, paid semi annually.
13
1H17 RESULTS PRESENTATION14 14
QUESTIONS

                                        15
1H17 RESULTS PRESENTATION
PORTFOLIO MAP
Growth Pipeline
16
INTERIM FINANCIAL REPORT FOR THE YEAR ENDED 31 DECEMBER 2016PORTFOLIO TABLE
Growth Pipeline
Calendar 1H17
Project Name Region Suburb State Status Year Starting Price
Acquired Yield Unsettled Lots Contracted Lots Unsold Lots FY17 FY18 FY19 1H 2H17 1H 2H18 1H 2H19 1H 2H20 2021+
Land
Little Creek1 Regional QLD Kirkwood QLD Construction 2007 688 398 398 P P P 1 1 1 1 1 1 1 1 1 $190k+
Waterline Bayside BrisbaneThornlands QLD Construction 2013 & 2014 227 51 25 26 P 1 1 $320k+
Affinity Bayside BrisbaneThornlands QLD Complete 2015 & 2016 118 50 20 30 P 1 1 $308k+
Riva N-Brisbane Joyner QLD Complete 2014 81 18 6 12 P 1 1 $262k+
[], Caboolture 1 N-Brisbane Caboolture QLD Planning5 2016 291 291 291 P 1 1 1 1 1 LO $179k+; H&L $400k+
Killara, Logan Reserve Logan Logan Reserve QLD Construction 2016 721 721 2 719 P P P 1 1 1 1 1 1 1 1 LO $200k+
Arundel Springs1 Gold Coast Arundel QLD Construction 2015 393 393 393 P P P 1 1 1 1 1 1 1 LO $315k+; TH $460k+
10
Bella Vista Estate Illawarra NSW Albion Park NSW DA 2016 87 87 36 51 P P 1 1 $380k+
Sienna Rise NW-Melbourne Plumpton VIC Planning5 2014 255 255 255 P P 1 1 1 $245k+
5
[], Wollert N-Melbourne Wollert VIC Planning 2016 166 166 166 P 1 1 1 $205k+
1
Cascades on Clyde SE-Melbourne Clyde VIC Construction 2006 1,138 44 44 P P 1 1 LO $220k+; H&L $384k+
Cardinia Views SE-Melbourne Pakenham VIC Construction 2013 320 182 145 37 P P 1 1 1 $185k+
Subtotal - Land 4,485 2,656 234 2,422
House and Land
Augustus2,3 Regional QLD Hervey Bay QLD Construction 2005 730 411 17 394 P P P 1 1 1 1 1 1 1 1 1 $339k+; LO $142k+
Emerald Park4 N-Brisbane Burpengary QLD Construction 2016 54 54 54 P P 1 1 $425k+
2,6
Park Vista N-Brisbane Mango Hill QLD Complete 2010 & 2014 533 7 4 3 P 1 1 LO remaining $243k+
The Nest4 N-Brisbane Fitzgibbon QLD Construction 2015 12 12 4 8 P 1 $366k+
Meadows N-Brisbane Strathpine QLD Planning5 2015 383 383 383 P P 1 1 1 1 1 1 $461k+
2,4
Haven on Greens, Griffin N-Brisbane Griffin QLD Construction 2016 70 70 5 66 P P 1 1 $495k+; LO $262k+
Silvan Rise N-Brisbane Dakabin QLD DA 2016 108 108 108 P 1 1 $471k+
Era Bayside BrisbaneCapalaba QLD Complete 2013 200 25 16 9 P 1 1 $537k+
2
Ellabay Bayside BrisbaneRedland Bay QLD Complete 2014 84 14 5 9 P 1 1 $548k+; LO $279k+
2
Seascape Bayside BrisbaneRedland Bay QLD Construction 2015 187 187 14 173 P P P 1 1 1 1 TH $448k+; LO $263k
Chambers Ridge (previously Cottonwood) Logan Park Ridge QLD Planning5 2016 300 300 300 P P 1 1 1 1 1 1 1 $429k+
Parkside 7 Gold Coast Coomera QLD Complete 2014 & 2015 179 4 1 3 P 1 1 $484k+
Seabright Gold Coast Jacobs Well QLD Construction 2014 107 107 43 64 P P 1 1 1 $426k+
Essence NE-Melbourne South Morang VIC DA 2016 60 60 60 P 1 1 $430k+
Lavinia 4 N-Melbourne Greenvale VIC Construction 2014 131 65 61 4 P P 1 1 $483k+
Roxburgh Park Central 4 N-Melbourne Roxburgh Park VIC Construction 2013 30 22 16 6 P P 1 1 1 $407k+
2
Sienna NW-Melbourne Plumpton VIC Construction 2014 166 94 90 4 P 1 1 $468k+; LO $243k+
4
Harmony SW-Sydney Cobbitty NSW Construction 2016 10 10 10 P P 1 1 $676k+
Concourse 4 SW-Sydney Oran Park NSW Construction 2016 28 28 28 P P 1 1 1 $689k+
Allure NW-Sydney Box Hill NSW Construction 2015 44 44 44 P 1 $715k+
Subtotal - House and Land 3,416 2,005 276 1,729
Total (wholly owned projects) 0 7901 4661 510 4151
Contract Build
Rochedale Grand S-Brisbane Rochedale QLD Construction 2015 167 163 40 123 P P P 1 1 1 1 1 1 $314k
Subtotal 167 163 40 123
Total (projects contributing to Revenue) 8,068 4,824 550 4,274
Joint Ventures
5
[], Donnybrook (51% share) N-Melbourne Donnybrook VIC Planning 2015 650 650 650 1 1 1 TBC
Englobo parcel, Donnybrook (51% share)7 N-Melbourne Donnybrook VIC Planning5 2015 2 2 2 P 1 1 1 Contracted
Rochedale Grand (50% share) S-Brisbane Rochedale QLD Construction 2015 84 68 5 63 P P P 1 1 1 1 1 $396k+
[], Greenbank (50%) Logan Greenbank QLD DA 2016 750 750 750 P P 1 1 1 1 1 1 TBC
The Chase (Development agreement @100%)8 SW-Sydney Oran Park NSW Planning5 2016 93 93 93 P 1 1 TBC
Subtotal 1,579 1,563 5 1,558
Total (all categories) 9,647 6,386 554 5,832 24 23 18
Completed in 1H179 961 - - -
5
Notes: Planning - Residential use allowed. Progressing with any necessary approvals from relevant authorities. Low risk.
1 6
Predominantely land only. Remaining lots to be sold as land only.
2 7
Predominantly house and land. Conditional contract to sell ~67.9 ha. Yield decreased from 510 lots to 2 lots (51% share). The JV intends to retain and develop the remaining parcel of land (~206.1 ha).
3 8
The long term strategy at this project is to continue developing the land, with the balance sold as an englobo parcel when the market demand for the site presents itself. Commercial terms agreed and development application lodged for initial ~90 lots, subject to finalising formal documentation and satisfaction of conditions.
4 9
Contracted under Put and Call option. Land paid out of settlement proceeds from third party sales. Projects completed in 1H17 - 90 settlements over 6 projects - Lacosi, Circa, Griffin (englobo), Mt Cotton, The Sanctuary and Emminence.
10
Purchased with 36 pre-sales.
17
1H17 RESULTS PRESENTATIONACQUISITIONS
Continuing to replenish growth portfolio
Purchase Price
Project Name Location State Region Product # Lots
($m)
Harmony (capital lite) Cobbitty NSW SW Sydney H&L 10 $4.0m
Concourse (capital lite) Oran Park NSW SW Sydney H&L 28 $8.8m
i
The Chase (development agreement) Oran Park NSW SW Sydney H&L 93 tba
Silvan Rise Dakabin QLD N-Brisbane H&L 108 $7.0m
ii
Chambers Ridge (adjoining site) Park Ridge QLD Logan H&L 140 $7.3m
[], Greenbank (50% share) Greenbank QLD Logan H&L 750 $27.5m
Essence, South Morang South Morang VIC NE-Melbourne TH 60 $4.4m
[], Wollert Wollert VIC N-Melbourne LO 166 $7.7m
Bella Vista Estate Albion Park NSW Illawarra LO 87 $14.3m (inc GST)
Emerald Park Burpengary QLD N-Brisbane H&L 54 $8.4m
1H17 Acquisitions 1496
(i) Announced on 17 August 2016. Commercial terms agreed and development application lodged for initial ~90 lots, subject to finalising formal documentation and
satisfaction of conditions.
(ii) Previously named Cottonw ood
18
1H17 RESULTS PRESENTATIONCOMMITMENTS
The adjacent chart shows $97.2 million in anticipated total cash
Land Acquisition Spend -
outlay for land through to 31 December 2019 comprising:
by Funding Type ($ million)
60.0
• $26.2 million1 recorded as land acquisitions payable on the
balance sheet at 31 December 2016
50.0
• $48.5 million in “capital lite” acquisitions to be settled through
third party settlement proceeds not yet shown on the balance
40.0 sheet as a payable as land is not yet registered
•
48.5
$22.5 million in joint venture land commitments.
30.0
20.0
In total, the $97.2 million in anticipated total cash outlay for land
2.5
10.0
20.0
through to 31 December 2019 will be funded as follows:
12.4
3.9
4.6 5.3
• $44.8 million from operating cash flow and existing debt facilities
0.0
2HY17 1HY18 2HY18 1HY19 2HY19 1HY20
Funded by working capital & debt - Committed at 31 December 2016
• $52.4 million funded from third party settlement proceeds
Capital lite funded at cash settlement of lots - Registered
Capital lite funded at cash settlement of lots - Committed
(“capital lite” model).
Joint Venture Land commitments (VW share only)
1 $3.9 million “capital lite” purchases which have registered and will be funded
through settlement proceeds. $22.3 million to be funded through strong operating
cash flows and existing debt facilities.
19
1H17 RESULTS PRESENTATIONSHARE REGISTER
BROAD, SUPPORTIVE SHAREHOLDER BASE
Shareholders at 31 December 2016
• 50.1% of shares held by Top 20 investors
• 25+ institutions on the share register
Unisuper1
6%
Westpac2
6%
Brazil
6%
IFM
5%
Other
50% Directors
1%
Other Top 20
26%
1Held through Quest and Discovery Asset Management. Quest ceased to be a
substantial holder on 7 February 2017.
2 Westpac ceased to be a substantial holder on 25 January 2017.
20
1H17 RESULTS PRESENTATIONYou can also read