2017 Air Quality Report for the Austin-Round Rock Metropolitan Statistical Area - CapCOG
←
→
Page content transcription
If your browser does not render page correctly, please read the page content below
2017 Air Quality Report for the Austin-Round
 Rock Metropolitan Statistical Area
 Prepared by the Capital Area Council of Governments

 July 31, 2018

 The preparation of this report was financed through funding provided by local governments
 participating in the Central Texas Clean Air Coalition. The content, findings, opinions, and conclusions
are the work of the author(s) and do not necessarily represent findings, opinions, or conclusions of the
 individual members of the Coalition.

 Page 1 of 68
2017 Air Quality Report for the Austin-Round Rock MSA, July 31, 2018 Executive Summary This is the annual air quality report for the Austin-Round Rock Metropolitan Statistical Area (MSA) prepared by the Capital Area Council of Governments (CAPCOG) for the members of the Central Texas Clean Air Coalition (CAC), the Texas Commission on Environmental Quality (TCEQ), and the U.S. Environmental Protection Agency (EPA). This report serves as the region’s annual “check-in” with EPA as part of the Clean Air Coalition’s participation in the Ozone Advance Program (OAP). The report covers January 1, 2017, through December 31, 2017. Under the most recent MSA definitions promulgated by the Office of Management and Budget (OMB) in 2015, the Austin-Round Rock MSA consists of Bastrop, Caldwell, Hays, Travis, and Williamson Counties. The report is intended to do the following: Provide an update on the status of air quality in the Austin-Round Rock MSA through the end of 2017 (Section 1); Provide an update on the latest understanding of the contribution of the region’s emissions to high ozone (O3) levels when they occur (Section 2); The status of emission reduction measures implemented in the region in 2017 (Section 3); Ongoing planning activities in the region (Section 4); and Planning for the future (Section 5). Except for the following organizations, all Clean Air Coalition members provided a report on 2017 activities to CAPCOG: Caldwell County City of Bastrop City of Hutto City of Luling City of San Marcos City of Taylor CapMetro CAPCOG will provide an addendum to this report to Clean Air Coalition members, TCEQ, and EPA if these organizations provide reports after this report has been submitted. Supplemental spreadsheets provide details of each organization’s reported activities. Page 2 of 68
2017 Air Quality Report for the Austin-Round Rock MSA, July 31, 2018

Table of Contents
Executive Summary....................................................................................................................................... 2
List of Acronyms ............................................................................................................................................ 7
1 Air Quality Status .................................................................................................................................. 9
 1.1 Compliance with the NAAQS ...................................................................................................... 10
 1.2 O3 Design Value Trend ................................................................................................................ 11
 1.3 Maximum Daily 8-Hour O3 Averages in the Region .................................................................... 13
 1.4 Daily Pollution Levels Compared to EPA’s AQI ........................................................................... 15
 1.4.1 High AQI Days by Pollutant ................................................................................................. 16
 1.4.2 High O3 AQI Days by Monitoring Station ............................................................................ 18
 1.4.3 High PM2.5 AQI Days by Monitoring Station ........................................................................ 18
 1.4.4 Distribution of “Moderate” or Worse AQI Days by Month................................................. 19
 1.5 Seasonal O3 Exposure.................................................................................................................. 20
 1.6 Near-Road Monitoring ................................................................................................................ 21
 1.7 Air Quality Forecasting ................................................................................................................ 22
 1.7.1 O3 Action Days..................................................................................................................... 22
 1.7.2 Daily Air Quality Forecasts .................................................................................................. 24
2 2017 Regional O3 Season Weekday NOX Emissions Profile................................................................. 25
 2.1 NOX Emissions by Source Type by County .................................................................................. 26
 2.2 On-Road Sector ........................................................................................................................... 26
 2.3 Non-Road Sources ....................................................................................................................... 27
 2.4 Point Sources .............................................................................................................................. 28
 2.5 Area Sources ............................................................................................................................... 30
3 Implementation of O3 Advance Program Action Plan and Other Measures ...................................... 30
 3.1 Regional and State-Supported Measures ................................................................................... 30
 3.1.1 Vehicle Emissions Inspection and Maintenance Program .................................................. 31
 3.1.2 Drive a Clean Machine Program ......................................................................................... 34
 3.1.3 Texas Emission Reduction Plan Grants ............................................................................... 36
 3.1.4 Commute Solutions Program .............................................................................................. 38
 3.1.5 Clean Air Partners Program................................................................................................. 42
 3.1.6 Outreach and Education Measures..................................................................................... 43
 3.1.7 Property-Assessed Clean Energy (PACE) Program .............................................................. 48
 3.1.8 CAPCOG Regional Air Quality Grants .................................................................................. 49
 3.2 Organization-Specific Measures and Updates ............................................................................ 50
 3.2.1 Texas Lehigh Cement Company .......................................................................................... 50
 3.2.2 Commuter Programs ........................................................................................................... 54
 3.2.3 Development Measures ...................................................................................................... 54

 Page 3 of 68

2017 Air Quality Report for the Austin-Round Rock MSA, July 31, 2018

 3.2.4 Energy and Resource Conservation .................................................................................... 54
 3.2.5 Fleet and Fuel Efficiency Measures..................................................................................... 55
 3.2.6 Outreach and Awareness .................................................................................................... 55
 3.2.7 Regulation and Enforcement .............................................................................................. 55
 3.2.8 Sustainable Procurement and Design ................................................................................. 56
4 Ongoing Planning Activities ................................................................................................................ 56
 4.1 Clean Air Coalition Meetings....................................................................................................... 56
 4.2 CLEAN AIR Force Meetings.......................................................................................................... 57
 4.3 Lone Star Clean Fuels Alliance (LSCFA) ....................................................................................... 58
 4.4 Regional Air Quality Technical Research Activities ..................................................................... 58
 4.5 Statewide Collaborative Initiatives ............................................................................................. 59
 4.5.1 Regional Air Quality Planning Group................................................................................... 59
 4.5.2 Texas Clean Air Working Group .......................................................................................... 59
5 Planning for the Future ....................................................................................................................... 59
 5.1 Mobile Source Emissions Trends ................................................................................................ 60
 5.2 Luminant Plant and Mine Closures ............................................................................................. 61
 5.3 Implications of Veto of Regional Air Quality Planning Funding .................................................. 63
 5.4 Implications of Veto of Drive a Clean Machine and Local Initiative Project Funding ................. 63
 5.5 Texas Emission Reduction Plan ................................................................................................... 64
 5.6 Commute Solutions Program ...................................................................................................... 64
 5.7 VW Mitigation Plan ..................................................................................................................... 65
 5.8 May 9, 2018, EPA NAAQS Review Memo.................................................................................... 66
 5.9 New Regional Air Quality Plan .................................................................................................... 67
6 Conclusion ........................................................................................................................................... 68

Table 1-1. Summary of Criteria Pollutant Measurement Periods at Federal Reference Method (FRM)
Monitors in the Austin-Round Rock MSA, 2015-2017 ................................................................................ 10
Table 1-2. Fourth-highest MDA8 Measurements at All O3 Monitoring Stations in the CAPCOG Region,
2015-2017 (ppb) ......................................................................................................................................... 14
Table 1-3. Summary of AQI for NO2, O3, and PM2.5..................................................................................... 16
Table 1-4. OAD Dates and Dates when O3 Exceeded Level of NAAQS, 2015-2017 .................................... 23
Table 2-1. 2017 O3 Season Weekday NOX Emissions by Source Type and County ..................................... 26
Table 2-2. 2017 Austin-Round Rock O3 Season Weekday NOX Emissions by Source Use Type .................. 27
Table 2-3. 2017 O3 Season Weekday Non-Road NOX Emissions by County (tpd) ....................................... 27
Table 2-4. Estimated 2017 O3 Season Weekday Point Source NOX Emissions by County (tpd) ................. 28
Table 2-5. 2016 O3 Season Day Point Source Emissions in the Austin-Round Rock MSA from TCEQ EIQs 28

 Page 4 of 68

2017 Air Quality Report for the Austin-Round Rock MSA, July 31, 2018

Table 2-6. 2017 Austin-Round Rock MSA Electric Generating Unit O3 Season Day NOX Emissions by
Facility Reporting to AMPD (tpd) ................................................................................................................ 30
Table 2-7. 2017 Area Source NOX Emissions by County and Type (tpd) ..................................................... 30
Table 3-1. I-M Program Statistics for 2017 ................................................................................................. 32
Table 3-2. 2016 and 2017 I-M Program Waivers ........................................................................................ 34
Table 3-3. FY 2017 TERP Grants Awarded in the Austin Area in FY 2017 ................................................... 37
Table 3-4. MyCommuteSolutions.com Data for 2017 ................................................................................ 38
Table 3-5. Commute Solution Newsletter Distribution .............................................................................. 41
Table 3-6 Summary of myCommuteSolutions Contest/Incentives ............................................................. 41
Table 3-7 Top 5 Air Central Texas Website Pages by Page views, 2017 ..................................................... 44
Table 3-8 Air Central Texas Newsletter Distribution Summary, 2017 ........................................................ 47
Table 3-9 2017 Air Central Texas Nominees and Recipients ...................................................................... 47
Table 3-10. PACE Project Summary for Austin-Round Rock MSA as of July 10, 2018 ................................ 49
Table 3-11. Summary of CAPCOG Regional Air Quality Grant Emission Reductions through 9/30/2017 .. 49
Table 3-12. Days Texas Lehigh Highlighted on its 2017 Report .................................................................. 52
Table 3-13. Jurisdictions Implementing Idling Restrictions in the Austin-Round Rock MSA ...................... 55
Table 5-1. Estimated Impact of Closing Sandow, Big Brown, and Monticello on C3 Based on 2017 Source
Apportionment Modeling (ppb).................................................................................................................. 62
Table 5-2. May 2018 LBB TERP Data ........................................................................................................... 64
Table 5-3. Austin-Round Rock Population and Violating VW Vehicles Comparison ................................... 65

Figure 1-1. 2017 Air Quality Monitors in the Austin-Round Rock MSA and Nearby Counties ................... 10
Figure 1-2. Austin-Round Rock MSA Design Values as a percentage of NAAQS ........................................ 11
Figure 1-3. Austin-Round Rock MSA 8-Hour O3 Design Value 1999-2017 .................................................. 12
Figure 1-4. CAMS 3 4th-Highest MDA8 O3 Values, Trendline, and 95% Confidence Intervals, 1997-2017 13
Figure 1-5. Map of CAMS 1605 and vicinity ................................................................................................ 15
Figure 1-6. Number of "Moderate" or ”Unhealthy for Sensitive Groups” Air Pollution Days in the CAPCOG
Region in 2017 by Pollutant ........................................................................................................................ 16
Figure 1-7. Days in 2017 When AQI Levels in the MSA Were "Moderate" or Worse ................................. 17
Figure 1-8. Number of Days when O3 Pollution was "Moderate" or Worse by Monitoring Station and
County, 2017 ............................................................................................................................................... 18
Figure 1-9. Number of Days when PM2.5 Pollution was "Moderate" or Worse by Monitoring Station and
County, 2017 ............................................................................................................................................... 19
Figure 1-10. Number of Days when Air Pollution was "Moderate" or Worse in the Austin-Round Rock
MSA by Month, 2017 .................................................................................................................................. 20
Figure 1-11. Weighted Seasonal O3 Exposure by Monitoring Station and 3-month period, 2017 (W126
ppm-hrs)...................................................................................................................................................... 21
Figure 1-12. 2015-2017 Near-Road Monitoring Data Compared to NAAQS .............................................. 22
Figure 1-13. OAD Forecast Accuracy and Success, 2015-2017 ................................................................... 24
Figure 1-14. Accuracy and Success of AQI Forecasts for 2017 ................................................................... 25
Figure 2-1. 2017 O3 Season Weekday NOX Emissions for the Austin-Round Rock MSA (tpd) .................... 26

 Page 5 of 68

2017 Air Quality Report for the Austin-Round Rock MSA, July 31, 2018

Figure 3-1. Trend in Emissions Inspections Compared to Population in Travis and Williamson Counties
2006-2017 ................................................................................................................................................... 32
Figure 3-2. Initial Emissions Inspection Failure Rate Trend 2006-2017 ...................................................... 33
Figure 3-3. Initial Emissions Test Failure Rate by Model Year .................................................................... 34
Figure 3-4. DACM Repair and Replacement Voucher Trends 2009-2017................................................... 36
Figure 3-5 Commute Solutions Advertisement Graphics ........................................................................... 39
Figure 3-6 Commute Solutions Delivered Gross Impressions by Method .................................................. 40
Figure 3-7 Commute Solutions Advertising Engagement by Platform ....................................................... 40
Figure 3-8 Cost per 1,000 Impressions by Platform Target ........................................................................ 40
Figure 3-9 Commute Solutions Website Acquisition by Method, 2017 ..................................................... 41
Figure 3-10 Air Central Texas Website Acquisition Method, 2017 ............................................................. 44
Figure 3-11 Air Central Texas Advertisement Graphics .............................................................................. 45
Figure 3-12 Air Central Texas Delivered Gross Impressions by Method, 2017........................................... 46
Figure 3-13 Air Central Texas Advertising Engagement by Platform, 2017 ................................................ 46
Figure 3-14. Cost per 1,000 Impressions by Platform Target ..................................................................... 46
Figure 3-15. Texas Lehigh NOX Emissions by Hour on NOX Reduction Days and Regular Days, 2017 ........ 53
Figure 5-1. Mobile Source NOX Emissions Trends (tpd) .............................................................................. 60
Figure 5-2. Luminant Facility Closures Announced October 2017 and Austin-Round Rock MSA .............. 61
Figure 5-3. 2016 and 2017 OSD NOX Emissions at Closing Luminant Power Plants ................................... 62

 Page 6 of 68

2017 Air Quality Report for the Austin-Round Rock MSA, July 31, 2018

List of Acronyms
AACOG: Alamo Area Council of Governments
AFFP: Alternative Fueling Facilities Program
AQI: Air Quality Index
CAC: Clean Air Coalition
CACAC: Clean Air Coalition Advisory Committee
CAMPO: Capital Area Metropolitan Planning Organization
CAPCOG: Capital Area Council of Governments
CapMetro: Capital Metropolitan Transit Authority
CAMS: Continuous Air Monitoring Station
CAPP: Clean Air Partners Program
CO: Carbon Monoxide
CSB: Clean School Bus
CTRMA: Central Texas Regional Mobility Authority
CTT: Clean Transportation Triangle
DACM: Drive a Clean Machine
DERI: Diesel Emission Reduction Incentive
DFW: Dallas-Fort Worth
DTIP: Drayage Truck Incentive Program
EAC: Early Action Compact
EE/RE: Energy efficiency and renewable energy
EPA: U.S. Environmental Protection Agency
ERIG: Emission Reduction Incentive Grant Program
I/M: Inspection and maintenance
ILA: Inter-Local Agreement
LCRA: Lower Colorado River Authority
LSCFA: Lone Star Clean Fuels Alliance
LIP: Local Initiative Project
LIRAP: Low-Income Vehicle Repair, Retrofit, and Accelerated Vehicle Retirement Program
MDA8: Maximum Daily 8-Hour Average
µg/m3: Micrograms per cubic meter
MOVES: Motor Vehicle Emissions Simulator
MSA: Metropolitan Statistical Area
NAAQS: National Ambient Air Quality Standards
NOX: Nitrogen oxides
NO2: Nitrogen dioxide
NTIG: New Technology Implementation Grant
O3: Ozone
OAD: Ozone Action Day
OAP: Ozone Advance Program
PACE: Property-Assessed Clean Energy

 Page 7 of 68

2017 Air Quality Report for the Austin-Round Rock MSA, July 31, 2018

Pb: Lead
PM2.5: Particulate matter with a diameter of 2.5 microns or less
PM10: Particulate matter with a diameter of 10 microns or less
PPB: Parts per billion
PPM: Parts per million
SIP: State Implementation Plan
SO2: Sulfur dioxide
TCEQ: Texas Commission on Environmental Quality
TERP: Texas Emission Reduction Plan
TCFP: Texas Clean Fleet Program
TMRS: Texas Municipal Retirement System
TNGVGP: Texas Natural Gas Vehicle Grant Program
TxDOT: Texas Department of Transportation
TexN: Texas NONROAD Model
VOC: Volatile Organic Compound

 Page 8 of 68
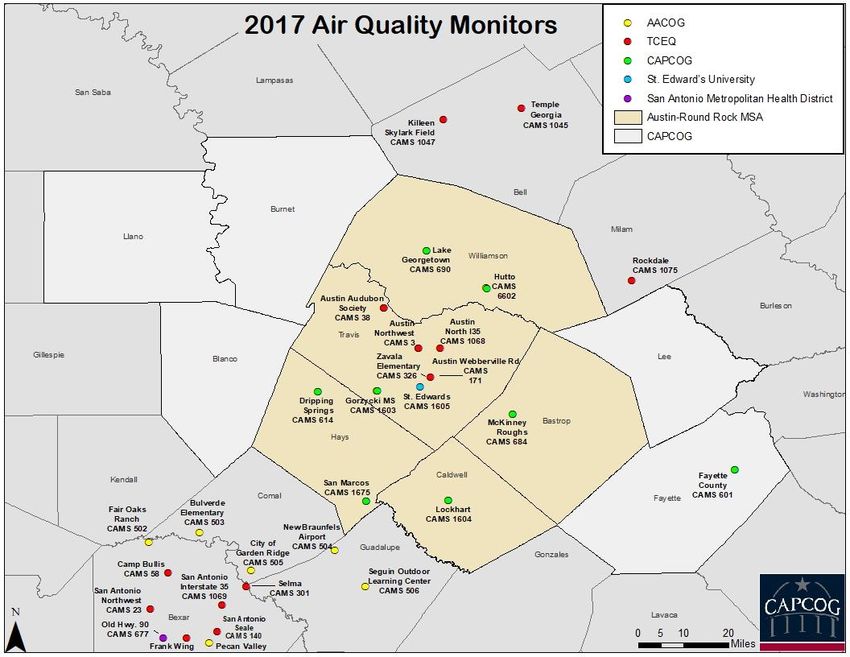
2017 Air Quality Report for the Austin-Round Rock MSA, July 31, 2018 1 Air Quality Status The following bullet points summarize the status of the Austin-Round Rock MSA’s air quality status as of the end of 2017: Air pollution levels remained in compliance with all National Ambient Air Quality Standards (NAAQS), although the region’s 2015-2017 O3 levels were just 1% below the 2015 O3 NAAQS In November 2017, EPA designated all five of the counties in the Austin-Round Rock MSA as “attainment/unclassifiable” for the 2015 O3 NAAQS. The region recorded seven days when O3 levels were considered “unhealthy for sensitive groups,” as well as an additional 110 days when either NO2, O3, or PM2.5 levels were considered “moderate,” based on EPA’s AQI. The region’s cumulative seasonal O3 levels were 55% below the levels that EPA considers harmful to vegetation. TCEQ’s most recent Toxicological evaluation of air toxics monitoring data in the CAPCOG region was released in November 10, 2017, and indicated that the region’s 2016 air monitoring data would not be expected to cause adverse health effects or vegetation effects. One of TCEQ’s two OAD forecasts correctly predicted O3 levels > 70 ppb, but OAD forecasts were not made for six other instances when O3 levels exceeded 70 ppb. Overall, TCEQ’s daily AQI forecasts correctly predicted “moderate” or worse air quality 60% of the time, but they only were able to predict 34% of all days when the AQI levels were “moderate” or worse within the region. While the region was able to narrowly remain in compliance with the NAAQS through the end of 2017, there were a total of seven days when air pollution levels within the region was considered “unhealthy for sensitive groups,” for ground-level O3. The following map shows the locations of all of the Continuous Air Monitoring Stations (CAMS) that collect air pollution samples in and near the Austin-Round Rock MSA, including the monitors operated by TCEQ, CAPCOG, St. Edward’s University, and the Alamo Area Council of Governments (AACOG). Page 9 of 68
2017 Air Quality Report for the Austin-Round Rock MSA, July 31, 2018

Figure 1-1. 2017 Air Quality Monitors in the Austin-Round Rock MSA and Nearby Counties

1.1 Compliance with the NAAQS
The Austin-Round Rock MSA’s 2017 design values for CO, NO2, O3, PM2.5, PM10, and SO2 were all in
compliance with the applicable NAAQS. Lead is not monitored within the region. There are four
“regulatory” monitoring stations in the Austin-Round Rock MSA, all located in Travis County, that
reported data to EPA and were used for comparisons to the NAAQS.
Table 1-1. Summary of Criteria Pollutant Measurement Periods at Federal Reference Method (FRM) Monitors in the Austin-
Round Rock MSA, 2015-2017

 CAMS 3 CAMS 38 CAMS 171 CAMS 1068
 Pollutant (AQS Site Number (AQS Site Number (AQS Site Number (AQS Site Number
 484530014) 484530020) 484530021) 484531068)
 CO n/a n/a n/a Dec. 2016 – 2017
 NO2 2015 – 2017 n/a n/a 2015 – 2017
 O3 2015 – 2017 2015 – 2017 n/a n/a
 PM2.5 n/a 2015 – 2017 2015 – 2017 2017
 PM10 n/a 2015 – 2017 2015 – 2017 n/a
 SO2 2015 – 2017 n/a n/a n/a

 Page 10 of 68
2017 Air Quality Report for the Austin-Round Rock MSA, July 31, 2018

The following figure shows the metro area’s 2016 and 2017 design values compared to each primary
NAAQS. Except for PM10, the design values used for this figure were all obtained from reports on EPA’s
website at https://www.epa.gov/air-trends/air-quality-design-values.1
Figure 1-2. Austin-Round Rock MSA Design Values as a percentage of NAAQS

 2016 2017

 99%
 94%

 80% 80%

 60% 57%

 48% 48% 47%
 43%

 28%
 25%
 14%
 6% 5% 5%

 CO 1-hr CO 8-hr NO2 annual NO2 1-hr O3 8-hr PM2.5 PM2.5 daily PM10 daily SO2 1-hr
 annual

In addition to having air quality that meets the NAAQS, all five counties in the Austin-Round Rock MSA
were formally designated as “attainment/unclassifiable” for the 2015 O3 NAAQS on November 6, 2017,
in “Round 1” of EPA’s designations for the NAAQS (82 FR 54232). Despite the region’s proximity to Bexar
County, which was designated “nonattainment” for the 2015 O3 NAAQS on July 17, 2018, EPA only
considered counties that were adjacent to Bexar County as “nearby” for the purpose of evaluating
whether or not a San Antonio nonattainment area needed to extend beyond Bexar County.

1.2 O3 Design Value Trend
The figure below shows the trend in the Austin-Round Rock MSA’s 8-hour O3 design values from 1999-
2017 compared to the 1997, 2008, and 2015 8-hour O3 NAAQS. Over this time, the region’s design value
has decreased an average of 1.1 ppb per year. Key design values that were used in the area designation

1
 Note that for PM10, the % of the NAAQS reflects the value of the maximum 4th-highest 24-hour PM10 value
recorded at a station over a three-year period divided by 150 µg/m3, which is the level of the PM10 NAAQS. The
actual form of the PM10 NAAQS uses “expected exceedances” (i.e., the avg. number of times per year the PM 10
levels exceed 150 µg/m3. In practice, this means that if the 4 th highest 24-hour PM10 value measured over a 3-year
period is over 150 µg/m3, the monitor is violating the NAAQS.

 Page 11 of 68
2017 Air Quality Report for the Austin-Round Rock MSA, July 31, 2018 process for these NAAQS are highlighted in green, and applicable O3 NAAQS are shown as red horizontal bars: The region’s 2003 design value was used as the basis for the EPA’s initial area designation for the 1997 O3 NAAQS in April 2004, although through the Early Action Compact (EAC) process, final action on this designation was deferred until after 2007. The region’s 2007 design value was required to be in attainment of the 1997 O3 NAAQS as part of the EAC. The region’s 2010 design value was used as the basis for the region’s designation for the 2008 O3 NAAQS following EPA’s delay in issuing initial area designations due to its reconsideration of the 2008 O3 NAAQS. The region’s 2016 design value was uses as the basis for the region’s designation for the 2015 O3 NAAQS. Figure 1-3. Austin-Round Rock MSA 8-Hour O3 Design Value 1999-2017 95 90 89 89 8-Hour Ozone Design Value (ppb) 88 85 85 85 84 82 82 80 80 77 75 75 75 74 74 73 70 69 69 68 65 66 60 1997 Standard 2008 Standard 2015 Standard Design Value The 3 ppb increase in the region’s design value from 2016 to 2017 raised many concerns among stakeholders, particularly in light of the fact that the region had not seen more than a 1 ppb increase in a design value year-to-year within this timeframe. However, it should be noted that this increase has more to do with the three-year averaging of data. Both 2014 and 2016 had unusually low O3 levels and 2015 had unusually high O3 levels, so when the very low O3 data from 2014 dropped out of the three- year average for 2015-2017, it caused an abnormally large increase in the O3 design values from 2016 to 2017. As the figure below shows, the 4th-highest MDA8 O3 value in 2014 was lower than the confidence interval associated with the 2014-2016 three-year average. Page 12 of 68
2017 Air Quality Report for the Austin-Round Rock MSA, July 31, 2018

Figure 1-4. CAMS 3 4th-Highest MDA8 O3 Values, Trendline, and 95% Confidence Intervals, 1997-2017

 C3 4th-high Trendline

 95

 90
 4th-Highest MDA8 O3 (ppb)

 85

 80

 75

 70

 65

 60

As of the date of this report, the region’s preliminary 2016-2018 design value is 66 ppb, which is in line
with expectations if this trend were to continue. Since the 2015 4th-high MDA8 O3 was several ppb over
70 ppb, once that data drops out of the three-year average for the 2016-2018 period, a 4th-high of 79
ppb at C3 or 84 ppb at C38 would be needed for the region’s 2016-2018 design value to reach 71 ppb.
These O3 levels have not been seen since 2006 and 2000, respectively. Based on the variability year-to-
year and projected 2018 MDA8 O3, CAPCOG estimates that the probability of both C3 and 38 having
2016-2018 averages below 71 ppb is 74%, compared to just 50% for the 2015-2017 design values, and
63% for 2014-2016.

1.3 Maximum Daily 8-Hour O3 Averages in the Region

While compliance with the O3 NAAQS is based on readings recorded at “regulatory” Federal Reference
Method (FRM) or Federal Equivalent Method (FEM) O3 samplers, there are also a number of non-
regulatory O3 monitoring stations in the region that can be used to understand regional O3 levels.
In addition to the two regulatory O3 monitors that TCEQ operates, CAPCOG collected O3 data at eight
monitoring stations and St. Edwards University collected data at one additional O3 monitoring station
between 2015 and 2017. These monitoring stations use EPA-approved O3 sampling methods and data
collected during this period followed a Quality Assurance Project Plan (QAPP) approved by TCEQ, but
were not operated as FRM or FEM monitors, and are not reported to EPA.

 Page 13 of 68
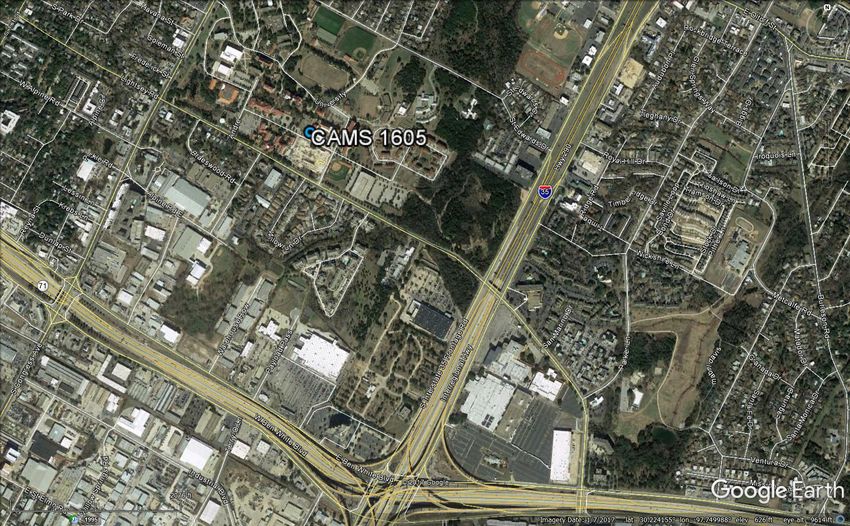
2017 Air Quality Report for the Austin-Round Rock MSA, July 31, 2018

The following table summarizes the fourth-highest MDA8 O3 measurements collected at each
monitoring station in the CAPCOG region in 2015, 2016, and 2017, as well as the three-year average for
each station. CAMS 3 and 38 are the “regulatory” monitoring stations operated by TCEQ, while CAMS
601, 614, 684, 690, 1603, 1604, 1605, 1675, and 6602 are research monitoring stations operated by
CAPCOG. Reports documenting the quality-checks performed at these sites can be found on CAPCOG’s
website at http://www.capcog.org/divisions/regional-services/aq-reports.
Table 1-2. Fourth-highest MDA8 Measurements at All O3 Monitoring Stations in the CAPCOG Region, 2015-2017 (ppb)

 2015- 2015-
 AQS Site
 CAMS County 2015 2016 2017 2017 2017 St.
 Number
 Average Dev.
 3 484530014 Travis 73 64 70 69.0 4.6
 38 484530020 Travis 73 62 67 67.3 5.5
 601 481490601 Fayette 70 59 64 64.3 5.5
 614 482090614 Hays 71 65 67 67.7 3.1
 684 480210684 Bastrop 69 59 57 61.7 6.4
 690 484910690 Williamson 75 61 70 68.7 7.1
 1603 484531603 Travis 72 63 59 64.7 6.7
 1604 480551604 Caldwell 67 60 67 64.7 4.0
 1605 484531605 Travis N/A *52 *51 *51.5 0.7
 1675 482091675 Hays 70 62 63 65.0 4.4
 6602 484916602 Williamson 71 58 65 64.7 6.5

CAMS 1605 was installed by St. Edward’s University at their campus in Austin ahead of the 2016 O3
season in order to support scientific research involving the launching of “ozonesondes” to collect
vertical measurements of O3 on predicted high O3 days. Throughout the 2016 O3 season, the monitor
recorded lower than expected ambient O3 measurements for the vicinity based on analysis of modeling
data and comparisons to the nearby CAMS 1603 monitor. Following a series of quality-checks, St.
Edward’s University researchers determined that the O3 data at CAMS 1605 was accurate and precise,
but believed that values were likely lower than expected due to some NOX titration issues on campus
where the monitor is located (less than 1 kilometer from IH-35, U.S.-71, and Congress Avenue, causing a
potentially high localized concentration of NOX on campus).2 As the table above shows, 2017 O3 levels
were similarly low. The CAMS 1605 data are therefore reliable for ground-level verification of the
ozonesonde measurements, but not a good indication of neighborhood-level exposure of O3 in the
vicinity of the monitor.
A Google earth map of CAMS 1605 illustrates the proximity to nearby roadways.

2
 On days in 2016 when at either CAMs 1603 or CAMS 1605 had MDA8 values of 55 ppb or higher, CAMS 1605 had
MDA8 values that were, on average, 10.6 ppb lower than CAMS 1603, with a range of 2-19 ppb below the values at
CAMS 1603. Modeling results from release 2 of the June 2012 episode available from TCEQ, on the other hand,
showed that CAMS 1605 was only 1.1 ppb lower, on average, than CAMS 1603 when either site had MDA8 values
of 55 ppb or higher, ranking from 3.5 below to 10.6 ppb above.

 Page 14 of 68
2017 Air Quality Report for the Austin-Round Rock MSA, July 31, 2018

Figure 1-5. Map of CAMS 1605 and vicinity

These data generally show that the 2015-2017 three-year average of the fourth highest MDA8 values in
the region ranged from 59 ppb – 70 ppb, with two monitors recording fourth-highest MDA8 values at
the upper end of that range (C3 and C690).

1.4 Daily Pollution Levels Compared to EPA’s AQI

While regulatory compliance is an important indicator of a region’s air quality, it is possible for an area
to experience numerous exceedances of an air pollution level that exceed the level of the NAAQS
multiple times in a given year and still have a compliant design value. A design value also does not
directly indicate how frequently a region experienced high pollution levels. Another indicator that can
be used to characterize a region’s air quality is the number of days a region experiences air pollution
levels fall within each of the AQI categories established by EPA. The following table shows the
concentrations of NO2, O3, and PM2.5 that correspond to each AQI level.3

3
 There were no days in 2017 when PM10, SO2, or CO AQIs were above 50, so those values are excluded from this
table.

 Page 15 of 68
2017 Air Quality Report for the Austin-Round Rock MSA, July 31, 2018

Table 1-3. Summary of AQI for NO2, O3, and PM2.5

 NO2 O3 PM2.5
 AQI Level AQI Number
 (1-Hr., ppb) (8-Hr., ppb) (24 hr., µg/m3)
 Good 0-50 0-53 0-54 0.0-12.0
 Moderate 51-100 54-100 55-70 12.1-35.4
 Unhealthy for Sensitive Groups 101-150 101-360 71-85 35.5-55.4
 Unhealthy 151-200 361-649 86-105 55.5-150.4
 Very Unhealthy 201-300 650-1,249 106-200 150.5-250.4
 Hazardous 301-500 1,250-2,049 201-600 250.5-500

This report includes data from all of the air pollution monitoring stations in the region, not just the TCEQ
regulatory monitors that are used for formal AQI reporting to TCEQ. Therefore, the number of days in
the “moderate” category described below are higher than if only the TCEQ regulatory monitors were
used.

1.4.1 High AQI Days by Pollutant
The following figures show the number of days in 2017 when NO2, PM2.5, or O3 concentrations measured
in the CAPCOG region were high enough to be considered “moderate” or “unhealthy for sensitive
groups.”
Figure 1-6. Number of "Moderate" or ”Unhealthy for Sensitive Groups” Air Pollution Days in the CAPCOG Region in 2017 by
Pollutant

 Moderate Unhealthy for Sensitive Groups

 7

 7 110

 79

 45

 2

 NO2 PM2.5 O3 Any Pollutant

 Page 16 of 68
2017 Air Quality Report for the Austin-Round Rock MSA, July 31, 2018

While high levels of O3 are responsible for all of the days when the region experienced air pollution
levels considered “unhealthy for sensitive groups,” high levels of PM2.5 were responsible for a majority
of the days when air pollution levels were considered at least “moderate,” and there was one day when
the near-road monitor C1068 recorded a high 1-hour NO2 measurement when O3 and PM2.5 levels were
otherwise considered “good.” The following figure shows the distribution of days when air pollution was
considered at least “moderate” by pollutant.
Figure 1-7. Days in 2017 When AQI Levels in the MSA Were "Moderate" or Worse

 NO2 Only NO2 and O3
 1 1

 O3 Only
 36

 PM2.5 Only
 64

 O3 and PM2.5
 15

 Page 17 of 68
2017 Air Quality Report for the Austin-Round Rock MSA, July 31, 2018

1.4.2 High O3 AQI Days by Monitoring Station

The following figures show the number of days when O3 levels were considered “moderate” or
“unhealthy for sensitive groups” at each monitoring station in the region in 2017.

Figure 1-8. Number of Days when O3 Pollution was "Moderate" or Worse by Monitoring Station and County, 2017

 Moderate Unhealthy for Sensitive Groups

 3
 2
 3 1
 1
 40
 31 32 34
 25 27
 23
 15 12
 8

1.4.3 High PM2.5 AQI Days by Monitoring Station

The figure below shows the number of days when PM2.5 levels were considered “moderate” at each
monitoring station. These data are based on daily average PM2.5 levels collected from continuous
samplers at CAMS 3, 38, 171, and 326.4The highest 24-hour PM2.5 average in 2015 was 28.8 µg/m3,
which is 82% of the level of the 24-hour PM2.5 NAAQS.

4
 Note that CAMS 38’s continuous PM2.5 monitor only collected daily averages on 318 days during 2017, and none
after 11/14/2017, while CAMS 171’s continuous PM 2.5 only collected daily averages on 249 days in 2017, with data
collection not beginning until 4/27/2017.

 Page 18 of 68
2017 Air Quality Report for the Austin-Round Rock MSA, July 31, 2018

Figure 1-9. Number of Days when PM2.5 Pollution was "Moderate" or Worse by Monitoring Station and County, 2017

 Moderate

 58

 43

 24 21

 CAMS 3 (Travis Co.) CAMS 38 (Travis Co.) CAMS 171 (Travis Co.) CAMS 326 (Travis Co.)

1.4.4 Distribution of “Moderate” or Worse AQI Days by Month
Air pollution levels vary significantly by month in the CAPCOG region. In 2017, air pollution levels were
considered “moderate” or worse on over as much as 61% of the days in May, while air pollution was
considered “moderate” or worse on only 6% of the days in January. The following figure shows the
number of days when air pollution levels were “moderate” or “unhealthy for sensitive groups” within
the region by month.

 Page 19 of 68
2017 Air Quality Report for the Austin-Round Rock MSA, July 31, 2018

Figure 1-10. Number of Days when Air Pollution was "Moderate" or Worse in the Austin-Round Rock MSA by Month, 2017

 Moderate Unhealthy for Sensitive Groups

 1

 3

 18 2
 1
 12 13
 10 9 9
 8 7 8 8
 6
 2

 Jan. Feb. Mar. Apr. May Jun. Jul. Aug. Sep. Oct. Nov. Dec.

1.5 Seasonal O3 Exposure

While EPA set the 2015 secondary O3 standard identical to the 2015 primary O3 standard, the preamble
to the rulemaking states that, “the requisite protection will be provided by a standard that generally
limits cumulative seasonal exposure to 17 ppm-hours (ppm-hrs) or lower, in terms of a 3-year W126
index.”5 EPA did not set a separate secondary standard set to protect public welfare, as opposed to
public health, because, “such control of cumulative seasonal exposure will be achieved with a standard
set at a level of 0.070 ppm, and the same indicator, averaging time, and form as the current standard.”6
The region’s peak seasonal O3 exposure levels were 55-88% below the 17 ppm-hr levels EPA referenced
in the final 2015 O3 NAAQS rulemaking. The figure below shows the 3-month seasonal exposure levels at
each monitoring station by month.

5
 80 FR 65294
6
 Ibid.

 Page 20 of 68
2017 Air Quality Report for the Austin-Round Rock MSA, July 31, 2018

Figure 1-11. Weighted Seasonal O3 Exposure by Monitoring Station and 3-month period, 2017 (W126 ppm-hrs)

 18

 16
 Season O3 Exposure (ppm-hrs)

 14

 12

 10

 8

 6

 4

 2

 0
 Jan-Mar Feb-Apr Mar-May Apr-Jun May-Jul Jun-Aug Jul-Sep Aug-Oct Sep-Nov Oct-Dec

 2015 Ozone NAAQS - Equivalent Level CAMS 3
 CAMS 38 CAMS 614
 CAMS 684 CAMS 690
 CAMS 1603 CAMS 1604
 CAMS 1605 CAMS 1675
 CAMS 6602

1.6 Near-Road Monitoring
In December 2016, the near-road monitor at CAMS 1068 started sampling CO, and in January 2017, the
monitoring station started sampling PM2.5. The figure below shows the CO, NO2, and PM2.5 data
collected at CAMS 1068 from 2015-2017 compared to the NAAQS. Since the PM2.5 NAAQS requires three
years of data, there is not a 2017 design value, and will not be one until the end of 2019. As the figure
below shows, concentrations of all three pollutants are well below the levels of their respective NAAQS,
with the annual PM2.5 concentration in 2017 measuring 78% of the 12.0 µg/m3 level of the annual PM2.5
NAAQS.

 Page 21 of 68
2017 Air Quality Report for the Austin-Round Rock MSA, July 31, 2018

Figure 1-12. 2015-2017 Near-Road Monitoring Data Compared to NAAQS

 100%

 90%

 80%

 70%

 60%

 50%

 40%

 30%

 20%

 10%

 0%
 CO 1-hour CO 8-hour NO2 1-hour NO2 Annual PM2.5 24-hour PM2.5 Annual

 2015 2016 2017 2017 Design Value

1.7 Air Quality Forecasting

One of the factors that influences the risks associated with air pollution is the extent to which air
pollution can be accurately and successfully predicted. For the Austin area, there are two types of
forecasting tools that can be used to help reduce the exposure of sensitive populations to high air
pollution levels –OADs and daily Air Quality Forecasts.

1.7.1 O3 Action Days
TCEQ issues OADs the afternoon before a day when it believes that O3 levels may exceed the level of the
NAAQS. While the level of the O3 NAAQS changed on October 1, 2015, states were required to start
reporting AQI in terms of the new O3 NAAQS starting January 1, 2016. Therefore, 2016 was the first year
for which the new O3 AQI thresholds were used. Therefore, it is important to understand that the data
analysis in this section includes both forecast data using the 2008 O3 AQI and forecast data using the
2015 AQI.
There are two ways CAPCOG measures the performance of OAD forecasting for the region over the past
several years – accuracy in correctly predicting an OAD, and success in predicting when actual
monitored O3 levels were high enough to be considered “unhealthy for sensitive groups.”
Using the new AQI for O3, CAPCOG calculates these metrics as follows:
 ℎ 8 > 70
 =

 Page 22 of 68
2017 Air Quality Report for the Austin-Round Rock MSA, July 31, 2018

 ℎ 8 > 70
 =
 ℎ 8 > 70

Using these metrics means that TCEQ’s OAD forecasting efforts for the region in 2017 were accurate
50% of the time (one out of the two OAD forecasts coincided with an actual MDA8 O3 value >70 ppb),
but OAD forecasting missed 86% of the days when MDA8 O3 levels actually exceeded 70 ppb (six out of
seven). These metrics are only accounting for days when either a forecast was for > 70 ppb or actual O3
was >70 ppb, and does not account for the other days when TCEQ correctly did not issue an OAD and O3
did not exceed 70 ppb.
Note that, to the extent that TCEQ’s two OADs may prompt individuals in the region to take action to
reduce emissions, it is possible that the O3 AQI levels would have exceeded 100 if not for the OAD. For
example, on– April 23, 2016, the highest O3 MDA8 in the region was 69 ppb, corresponding to an AQI
level of 99. It is possible that the action taken by residents of Central Texas on this date accounted for
the difference between this day’s O3 levels being 69 ppb and 71 ppb. This is less likely for the “false
positive” on May 5, 2017, when the highest MDA8 value recorded in the region was 61 ppb.
From 2015-2017, TCEQ issued a total of five OAD alerts for the Austin-Round Rock area – one in 2015,
two in 2016, and two in 2017. During this time frame, there were a total of 12 days when O3 levels
exceeded the level of the relevant O3 NAAQS: four in 2015, one in 2016, and seven in 2017. The
following table lists each of these dates.
Table 1-4. OAD Dates and Dates when O3 Exceeded Level of NAAQS, 2015-2017

 Highest O3 MDA8 Station where
 OAD Issued for this O3 NAAQS Level in
 Date Value Recorded in Highest O3 MDA8
 Date? Effect
 MSA Value Recorded
 8/14/14 Yes 75 ppb 63 ppb CAMS 614
 8/13/15 No 75 ppb 76 ppb CAMS 3
 8/27/15 Yes 75 ppb 82 ppb CAMS 3
 8/28/15 No 75 ppb 85 ppb CAMS 3
 8/29/15 No 75 ppb 83 ppb CAMS 3
 4/23/16 Yes 70 ppb 69 ppb CAMS 38
 5/6/16 Yes 70 ppb 62 ppb CAMS 1603
 10/3/16 No 70 ppb 72 ppb CAMS 3
 6/5/17 No 70 ppb 73 ppb CAMS 690
 6/7/17 No 70 ppb 74 ppb CAMS 1604
 6/8/17 No 70 ppb 75 ppb CAMS 690
 5/5/17 Yes 70 ppb 61 ppb CAMS 1604
 8/1/17 No 70 ppb 72 ppb CAMS 614
 9/1/17 No 70 ppb 71 ppb CAMS 3
 9/12/17 Yes 70 ppb 74 ppb CAMS 1604
 9/13/17 No 70 ppb 73 ppb CAMS 690

 Page 23 of 68
2017 Air Quality Report for the Austin-Round Rock MSA, July 31, 2018

Two of the five OAD forecasts correctly predicted O3 levels over the applicable NAAQS – a 40% accuracy
rate over the three-year period. Conversely, there was a 17% “success rate” in predicting actual MDA8
O3 levels over the applicable NAAQS from 2015-2017.
Figure 1-13. OAD Forecast Accuracy and Success, 2015-2017

 100%
 90%
 80%
 70% 3
 60% 10
 50%
 40%
 30%
 20% 2
 10% 2
 0%
 OAD Days Days when MDA8 > NAAQS

 Forecast Correct Forecast Not Correct

1.7.2 Daily Air Quality Forecasts
Unlike OADs, which are only issued for days when TCEQ believes O3 will reach levels considered
“unhealthy for sensitive groups;” daily air quality forecasts include forecasts for “good” and “moderate”
air pollution levels as well, and include forecasts for pollutants other than O3. The performance of these
forecasts can also be measured using the same type of metrics used above for OADs – accuracy and
success. In this case, CAPCOG evaluated the accuracy and success rate in terms of the number of days
when air quality was forecast to be “moderate” or worse. The equations below explain these terms in
terms of the daily AQI forecast.

 ℎ
 =

 ℎ
 =
 ℎ

 Page 24 of 68
2017 Air Quality Report for the Austin-Round Rock MSA, July 31, 2018

Since the daily AQI forecasts for the region included forecasts for both O3 and PM2.5, it is possible to
analyze these accuracy and success rates by pollutant, as well as for the overall AQI. The figure below
shows the results of this analysis for 2017.
Figure 1-14. Accuracy and Success of AQI Forecasts for 2017

 100%
 90%
 80% 26
 23 28
 70%
 15 75
 60%
 64
 50%
 40%
 30% 38
 27 27
 20%
 7 38
 10%
 7
 0%
 Moderate or Actual Ozone Moderate or Actual PM2.5 Moderate or Actual AQI
 Worse Ozone Levels Moderate Worse PM2.5 Levels Moderate Worse Overall Moderate or
 Forecast or Worse Levels Forecast or Worse AQI Forecast Worse

 Forecast Correct Forecast Not Correct

Overall, TCEQ’s forecasts for “moderate” or higher O3 levels were 54% accurate and 49% successful,
while forecasts for “moderate” or higher PM2.5 forecasting were 39% accurate and 10%. Overall AQI
forecasts were 60% accurate and 34% successful.

2 2017 Regional O3 Season Weekday NOX Emissions Profile
The following pie chart shows the estimated average 2017 O3 season weekday anthropogenic NOX
emissions in the region by major source type – on-road mobile, non-road mobile, point source, and area
source emissions.

 Page 25 of 68
2017 Air Quality Report for the Austin-Round Rock MSA, July 31, 2018

Figure 2-1. 2017 O3 Season Weekday NOX Emissions for the Austin-Round Rock MSA (tpd)

 Total = 70.14 tpd NOX Emissions
 Area
 6.06
 9%

 Point
 16.93 On-Road
 24% 30.51
 43%

 Non-Road
 16.64
 24%

2.1 NOX Emissions by Source Type by County
The following table shows the break-down of the region’s NOX emissions by county and source type.
Table 2-1. 2017 O3 Season Weekday NOX Emissions by Source Type and County

 County On-Road Non-Road Point Area Total
 Bastrop 1.90 1.41 3.16 0.37 6.84
 Caldwell 1.08 1.1 0.96 1.86 5.00
 Hays 4.09 1.33 6.90 0.41 12.73
 Travis 16.63 8.57 5.75 2.61 33.56
 Williamson 6.81 4.25 0.17 0.81 12.04
 TOTAL 30.51 16.64 16.93 6.06 70.14

2.2 On-Road Sector
The on-road sector includes mobile sources that are registered to operate on public roads. On-road
vehicles remain the largest source of NOX emissions within the region, accounting for 30.51 tons per day
(tpd) of NOX emissions on a typical 2017 O3 season weekday, based on TCEQ’s most recent “trends”
emissions inventories. The table below shows the typical 2017 O3 season weekday NOX emissions for the
region by source use type.

 Page 26 of 68
2017 Air Quality Report for the Austin-Round Rock MSA, July 31, 2018

Table 2-2. 2017 Austin-Round Rock O3 Season Weekday NOX Emissions by Source Use Type

 Source Use Type NOX (tpd)
 Motorcycle 0.03
 Passenger Car 8.85
 Passenger Truck 6.15
 Light Commercial Truck 1.80
 Intercity Bus 0.16
 Transit Bus 0.23
 School Bus 0.45
 Refuse Truck 0.40
 Single-Unit Short-Haul Truck 1.92
 Single-Unit Long-Haul Truck 0.21
 Motor Home 0.20
 Combination Short-Haul Truck 3.90
 Combination Long-Haul Truck 6.20
 TOTAL 30.51

Passenger cars and passenger trucks combined to account for 15.00 tpd of NOX emissions, while
commercial trucking accounted for 12.63 tpd NOX emissions, and the remaining sources accounting for
2.88 tpd NOX emissions, most of which come from light commercial trucks.

2.3 Non-Road Sources
The non-road sector consists of any mobile source that is not registered to be operated on a public road,
including sources such as agricultural equipment, construction and mining equipment, locomotives,
aircraft, and drill rigs. Non-road sources made up the 3rd-largest source of NOX emissions within the
region in 2017, accounting for 16.64 tpd of NOX emissions on a typical O3 season weekday. The non-road
sector includes any mobile source not registered to operate on a public roadway. There are four
different TCEQ “trends” data sets from which CAPCOG extracted non-road emissions estimates:
equipment modeled in the “Texas NONROAD” (TexN) model, locomotives/rail equipment, aircraft
(including ground support equipment), and drill rigs.
Table 2-3. 2017 O3 Season Weekday Non-Road NOX Emissions by County (tpd)

 County TexN Rail Aircraft Drill Rigs Total
 Bastrop 0.95 0.46 0.00 0.00 1.41
 Caldwell 0.58 0.49 0.01 0.02 1.1
 Hays 0.88 0.45 0.00 0.00 1.33
 Travis 5.80 0.45 2.32 0.00 8.57
 Williamson 3.68 0.55 0.02 0.00 4.25
 TOTAL 11.88 2.39 2.35 0.02 16.64

 Page 27 of 68
2017 Air Quality Report for the Austin-Round Rock MSA, July 31, 2018

2.4 Point Sources
The point source sector consists of any stationary source that reports its emissions to TCEQ. The most
recent point source data that is publicly available from TCEQ is for 2016. In that year, there were 29
facilities from the Austin-Round Rock MSA that reported their emissions to TCEQ, accounting for a total
of 16.65 tpd of NOX emissions. Since EPA makes data for EGUs available online more quickly than TCEQ
publishes the annual emissions data it collects, 2017 EGU data are already available. Substituting the
2017 EGU data from EPA for the 2016 TCEQ emissions data brings the total to 16.93 tpd from point
sources. The following table combines the 2016 non-EGU emissions with the 2017 EGU emissions for an
estimated 2017 point source emissions estimate by county.
Table 2-4. Estimated 2017 O3 Season Weekday Point Source NOX Emissions by County (tpd)

 County EGU Non-EGU TOTAL
 Bastrop 3.03 0.13 3.16
 Caldwell 0.00 0.96 0.96
 Hays 0.55 6.35 6.90
 Travis 2.04 3.71 5.75
 Williamson 0.00 0.17 0.17
 TOTAL 5.61 11.31 16.93

The table below shows the 2016 OSD NOX emissions by facility as reported to TCEQ.
Table 2-5. 2016 O3 Season Day Point Source Emissions in the Austin-Round Rock MSA from TCEQ EIQs

 NOX
 RN COMPANY SITE COUNTY
 (tpd)
 LOWER COLORADO RIVER
 RN102038486 SIM GIDEON POWER PLANT BASTROP 1.66
 AUTHORITY
 RN100212034 MERIDIAN BRICK LLC ELGIN FACILITY BASTROP 0.08
 RN100225846 ACME BRICK COMPANY ELGIN PLANT BASTROP 0.05
 GENTEX POWER
 RN100723915 LOST PINES 1 POWER PLANT BASTROP 0.49
 CORPORATION
 BASTROP ENERGY PARTNERS
 RN101056851 BASTROP ENERGY CENTER BASTROP 0.93
 LP
 RN100212018 DAVIS GAS PROCESSING, INC LULING GAS PLANT CALDWELL 0.29
 PRAIRIE LEA COMPRESSOR
 RN100220177 OASIS PIPELINE CO TEXAS LP CALDWELL 0.66
 STATION
 FLINT HILLS RESOURCES
 RN105366934 MUSTANG RIDGE TERMINAL CALDWELL 0.00
 CORPUS CHRISTI LLC
 TEXAS LEHIGH CEMENT
 RN102597846 TEXAS LEHIGH CEMENT CO HAYS 6.35
 COMPANY LP
 RN100211689 HAYS ENERGY LLC HAYS ENERGY FACILITY HAYS 0.64
 CITY OF AUSTIN ELECTRIC
 DECKER CREEK POWER
 RN100219872 UTILITY DEPARTMENT DBA TRAVIS 1.46
 PLANT
 AUSTIN ENERGY
 RN100214337 AUSTIN WHITE LIME COMPANY MCNEIL PLANT & QUARRY TRAVIS 1.11

 Page 28 of 68
2017 Air Quality Report for the Austin-Round Rock MSA, July 31, 2018

 NOX
 RN COMPANY SITE COUNTY
 (tpd)
 RN105074561 OLDCASTLE MATERIALS TEXAS AUSTIN HOT MIX TRAVIS 0.01
 RN100843747 NXP USA INC ED BLUESTEIN SITE TRAVIS 0.03
 UNIVERSITY OF TEXAS AT HAL C WEAVER POWER
 RN102533510 TRAVIS 1.62
 AUSTIN PLANT
 RN100723741 SPANSION LLC SPANSION AUSTIN FACILITY TRAVIS 0.02
 INTEGRATED CIRCUIT MFG
 RN102752763 NXP USA INC TRAVIS 0.02
 OAK HILL FAB
 AUSTIN AMERICAN AUSTIN AMERICAN
 RN101957769 TRAVIS 0.00
 STATESMAN STATESMAN
 BFI WASTE SYSTEMS OF
 RN100542752 BFI SUNSET FARMS LANDFILL TRAVIS 0.07
 NORTH AMERICA INC
 RN100218692 3M COMPANY 3M AUSTIN CENTER TRAVIS 0.08
 FLINT HILLS RESOURCES
 RN101059673 AUSTIN TERMINAL TRAVIS 0.01
 CORPUS CHRISTI LLC
 WASTE MANAGEMENT OF AUSTIN COMMUNITY
 RN100215938 TRAVIS 0.12
 TEXAS INC LANDFILL
 RN101992246 SUNSET FARMS ENERGY LLC SUNSET FARMS ENERGY TRAVIS 0.00
 SAMSUNG AUSTIN AUSTIN FABRICATION
 RN100518026 TRAVIS 0.34
 SEMICONDUCTOR LLC FACILITY
 CITY OF AUSTIN ELECTRIC
 RN100215052 UTILITY DEPARTMENT DBA SAND HILL ENERGY CENTER TRAVIS 0.35
 AUSTIN ENERGY
 TEXAS DISPOSAL SYSTEMS TEXAS DISPOSAL SYSTEMS
 RN102016698 TRAVIS 0.06
 LANDFILL INC LANDFILL
 WASTE MANAGEMENT OF WILLIAMSON COUNTY
 RN100225754 WILLIAMSON 0.05
 NORTH TEXAS LANDFILL HUTTO
 SEMINOLE PIPELINE COMPANY
 RN100725712 COUPLAND PUMP STATION WILLIAMSON 0.11
 LLC
 DURCON LABORATORY TOPS DURCON LABORATORY TOPS
 RN100728179 WILLIAMSON 0.01
 INCORPORATED INCORPORATED
 TOTAL n/a n/a n/a 16.65

The following table shows the estimated 2017 OSD NOX emissions for electric generating units in the
region. The NOX emissions for the Decker Creek Power Plant turbines is based on an adjustment to the
data reported to EPA due to certain acid rain data defaults that must be used in absence of recent stack
tests; the adjustment ensures that the emission rates are consistent with the reported emissions rates in
the facilities 2016 EIQ submitted to TCEQ. Non-EGU NOX sources at these facilities are also based on the
2016 EIQs. The main emissions data comes from 2017 O3 season NOX emissions reported to EPA.

 Page 29 of 68
2017 Air Quality Report for the Austin-Round Rock MSA, July 31, 2018 Table 2-6. 2017 Austin-Round Rock MSA Electric Generating Unit O3 Season Day NOX Emissions by Facility Reporting to AMPD (tpd) Non-EGU EGU Facility County Combined (2016) (2017) Sim Gideon Bastrop 0.0025 1.8552 1.8576 Lost Pines 1 Bastrop 0.0090 0.5217 0.5307 Bastrop Clean Energy Center Bastrop 0.0004 0.6373 0.6377 Hays Energy Facility Hays 0.0071 0.5444 0.5515 Decker Creek Travis 0.0217 2.0152 2.0369 Sand Hill Energy Center Travis 0.0036 0.2045 0.2081 TOTAL TOTAL 0.0444 5.7782 5.8225 2.5 Area Sources CAPCOG estimated the 2017 area sources using EPA’s 2017 emissions inventory projections used in recent O3 modeling for its 2011v6.3 platform.7 Table 2-7. 2017 Area Source NOX Emissions by County and Type (tpd) Residential Agricultural Non-Point Oil County Non-Point Wood Total Fires and Gas Combustion Bastrop 0.0032 0.1864 0.1822 0.0003 0.3721 Caldwell 0.0003 0.0771 1.7803 0.0001 1.8579 Hays 0.0000 0.4081 0.0000 0.0006 0.4087 Travis 0.0000 2.5864 0.0143 0.0048 2.6055 Williamson 0.0000 0.7833 0.0265 0.0020 0.8117 TOTAL 0.0036 4.0413 2.0033 0.0079 6.0560 3 Implementation of O3 Advance Program Action Plan and Other Measures This section provides details on emission reduction measures implemented within the Austin-Round Rock MSA in 2017. This includes both measures that had been included in the OAP Action Plan and other measures that were not explicitly committed to in that plan. 3.1 Regional and State-Supported Measures Regional and state-supported measures involve multi-jurisdictional programs or state involvement in an emission reduction measure within the region. These include: The vehicle emissions inspection and maintenance (I/M) program The Drive a Clean Machine program Texas Emission Reduction Plan (TERP) grants The Commute Solutions Program 7 ftp://ftp.epa.gov/EmisInventory/2011v6/v3platform/reports/2011el_county_monthly_report.xlsx Page 30 of 68
You can also read