2019 Community Health Needs Assessment and Implementation Plan
←
→
Page content transcription
If your browser does not render page correctly, please read the page content below
2019 Community Health Needs Assessment and
                         Implementation Plan

                          ADOPTED BY THE BOARD OF DIRECTORS ON MARCH 7, 2020

                                                           - MISSION STATEMENT -

Navajo Health Foundation – Sage Memorial Hospital, Inc. provides quality healthcare services in a fiscally responsible manner, focusing on the
                                          patient’s physical, social, and spiritual well-being
Dear Community Members,
                                                                                       Andrew Simpson

Navajo Health Foundation/Sage Memorial Hospital is pleased to
present this Community Health Needs Assessment and Implementation
Plan to the residents of the communities served by the hospital and its
clinics. With the help of your direct input, along with demographic
research and data analysis, Sage has identified unique public Health                   Maybelle Kelewood
needs.

As part of this effort, Sage has developed and implemented a continuous
improvement plan for quality health care. This document supports the
long-term strategic plan developed by the Board of Directors following
the 2019 Community Health Needs Assessment currently implemented.
                                                                                       RayAnn Terry

The Sage Memorial Hospital Board of Directors would like to thank you
for your candid and valuable input that has allowed us to create this
document. We look forward to further collaboration with you as we
strive to continually improve and better meet your health care needs.                  Veronica Clark

Our Hope is that this document will allow you a better understanding of
the unique health care needs faced by you in your communities and will
enable us to move forward together to improve our way of life.

Thank you,                                                                             Delores Noble

Board of Directors

                        2019 Community Health Needs Assessment & Implementation Plan                       2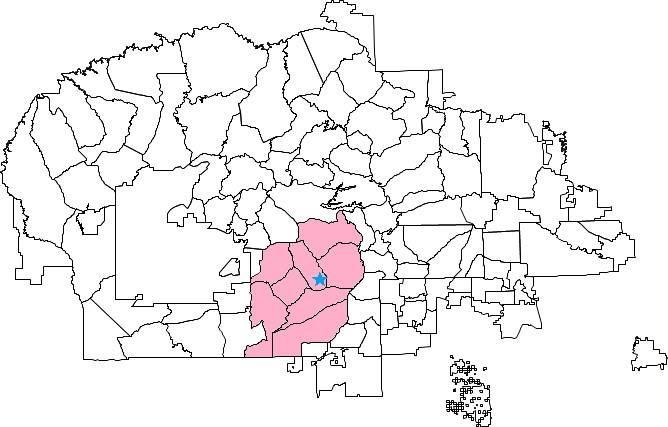
Table of Contents

EXECUTIVE SUMMARY................................................................................................................................ 5
   Approach ................................................................................................................................................................... 5
   Summary of Findings................................................................................................................................................. 5
      Demographics ........................................................................................................................................................................................... 5
      Health Care Needs.................................................................................................................................................................................... 5
   Addressing the Health Care Needs of the Community ............................................................................................... 6
BACKGROUND INFORMATION ................................................................................................................... 7
   History of Navajo Health Foundation-Sage Memorial Hospital ................................................................................. 7
   Services Provided by Sage Memorial Hospital ........................................................................................................... 7
   Definition of the Community Served by Sage Memorial Hospital .............................................................................. 8
   Other Regional Healthcare Facilities ....................................................................................................................... 10
COMMUNITY HEALTH NEEDS ASSESSMENT APPROACH .................................................................... 10
   Overview ................................................................................................................................................................. 10
   Methodology ............................................................................................................................................................ 11
      The Process for Consulting with Persons Representing the Community’s Interests..............................................................................11
      Data Collection .......................................................................................................................................................................................11
      Community Survey ..................................................................................................................................................................................11
      Focus Group with Community Representatives .....................................................................................................................................11
      Sage Employee Survey ............................................................................................................................................................................12
      Health Information Systems Data...........................................................................................................................................................12
      Secondary Data ......................................................................................................................................................................................12
      Data Analysis ..........................................................................................................................................................................................12
      The Process for Identifying and Prioritizing Community Health Needs and Services...........................................................................12

KEY FINDINGS ............................................................................................................................................ 12
   Community Demographics ...................................................................................................................................... 12
      Population...............................................................................................................................................................................................12

Figure 4: Total population of service area compared to county, state, national census ..................................... 13
      Race/Ethnicity .........................................................................................................................................................................................13
      Population by Age and Sex .....................................................................................................................................................................14
      Population by Educational Attainment ...................................................................................................................................................15

Figure 7: Educational Attainment of the Population ....................................................................................... 15
      Language ................................................................................................................................................................................................15
      Poverty Rate............................................................................................................................................................................................16
      Household Income ..................................................................................................................................................................................16

Figure 8: Household income compared to American Community Survey National Averages ........................... 17
      Unemployment Rate ................................................................................................................................................................................17
   Community Needs Index.......................................................................................................................................... 17
      Service Area Community Needs Index ....................................................................................................................................................18

                                            2019 Community Health Needs Assessment & Implementation Plan                                                                                                      3
Primary and Chronic Disease Care Access, Quality of Care, and other Health Needs of Uninsured Persons, Low-
   Income Persons, and Minority groups ..................................................................................................................... 19
      Uninsured persons ..................................................................................................................................................................................19
      Low-income and ethnic minority groups’ care access and quality disparities ......................................................................................20
      Disparity improvement/worsening by unique ethnic/minority group .....................................................................................................20
      Causes of Death among American Indians/Alaskan Natives compared to all other races ....................................................................21
   The Health Needs of the Community ....................................................................................................................... 22
      Behavioral Health Treatment .................................................................................................................................................................22
      How Sage is Addressing Behavioral Health Needs ................................................................................................................................23
      Pediatric Care ........................................................................................................................................................................................23
      How Sage is Addressing Pediatric Care ................................................................................................................................................24
      Obesity Prevention..................................................................................................................................................................................25
      How Sage is Addressing Obesity Prevention..........................................................................................................................................25
      Accessible Health Care Services ............................................................................................................................................................25
      How Sage is Addressing Accessible Health Care Services ...................................................................................................................25
      Diabetes Care and Prevention................................................................................................................................................................26
      How Sage is Addressing Diabetes Care and Prevention........................................................................................................................26
   ADDRESSING THE HEALTH NEEDS OF THE COMMUNITY .......................................................................... 27
   Implementation Strategy ......................................................................................................................................... 27
   Challenges in Meeting the Long-Term Needs of the Community ............................................................................. 29
      Medical and Clinical Staff Recruitment .................................................................................................................................................29
      Employee Housing ..................................................................................................................................................................................29
      Outpatient Medical Center .....................................................................................................................................................................29
      New Hospital ..........................................................................................................................................................................................29
      Financial Challenges of Meeting Long-Term Needs of the Community ................................................................................................30

APPENDICES ............................................................................................................................................... 31
   APPENDIX A – INDIVIDUALS PARTICIPATING AS LOCAL ADVISORS ........................................................ 31
   APPENDIX B – SECONDARY DATA SOURCES RELIED UPON........................................................................ 32
   APPENDIX C – BOARD MEMBER INTERVIEW PRIMARY QUALITATIVE DATA ........................................ 34
   APPENDIX D – COMMENTS FROM SELECTED COMMUNITY SURVEY QUESTIONS ................................ 40
   APPENDIX E – COPY OF 2019 COMMUNITY AND STAFF SURVEY QUESTIONS ......................................... 45

                                            2019 Community Health Needs Assessment & Implementation Plan                                                                                                    4
EXECUTIVE SUMMARY
Established in 1978, Navajo Health Foundation – Sage Memorial Hospital, Inc. (“Sage”) is an Arizona private
501(c)(3) not-for-profit healthcare corporation. The organization includes a 25-bed Critical Access Hospital and
outpatient clinics located in Ganado, and Greasewood Springs, Arizona.

Sage is a Native-managed comprehensive healthcare system and is the only Native-governed hospital to hold a license
from the Arizona Department of Health. Today, Sage serves approximately 20,000 people as the sole provider of
health care services across the Navajo Nation chapters and communities of Cornfields, Ganado, Kinlichee, Klagetoh,
Greasewood Springs, Steamboat, Wide Ruins, and a portion of Nazlini encompassing the communities south of Route
26. Many patients from outside of our community service area choose to travel to Sage to receive health care services.

Sage facilitated a comprehensive Community Health Needs Assessment (“CHNA”) for both the main campus and
Greasewood Springs satellite clinic. The purpose was to understand the public health needs facing those communities
for which it provides health care services. This CHNA was conducted between August 1st and September 30th, 2019
as an update to the CHNA performed by Sage in 2016.

This report fulfills federal regulations requiring non-profit hospitals to conduct a community health needs assessment
every three years.1 Performing this assessment at regular intervals enables the hospital to monitor and respond to the
community’s changing public health needs.

Approach
Sage performed the CHNA with the collaboration of the hospital administration, executive leadership, public health
professionals, and clinical staff (“Assessment Team” or “Team”). The Assessment Team conducted surveys with the
community members and focus groups and researched secondary data sources for relevant community health
information. The Assessment Team analyzed the collected data and cross-referenced it with relevant public databases.
The Team then developed this report that summaries key findings and outlines the implementation plan developed
by the Board of Directors and its Administrative Executive staff to meet the most immediate and vital community
health heeds.

Summary of Findings

Demographics
Approximately 95% of the residents served by Sage are of American Indian or Alaska Native (“AI/AN”) descent.
The age distribution of the populations weighed toward younger age groups, with approximately 52% of the
population under the age of 44. Compared to national averages, the community has a lower level of education, a
higher poverty rate, a higher unemployment rate, and a lower average household income. The Navajo language (or
another language other than English) is spoken in 45% of the households served by Sage, and 82% of the population
speaks English.

Health Care Needs
The Assessment Team identified the following high priority health care needs from the greatest to the lowest priority
within the service area of the hospital:

     •    Behavioral Health and Substance Abuse Treatment
     •    Pediatric Care

1 Internal Revenue Service. (2018, 11 07). Community Health Needs Assessment for Charitable Hospital Organizations-Section 501(c)(3). Retrieved 06 27, 2019 from
IRS.gov: https;//www.irs.gov/charities-non-profits/community-health-needs-assessment-for-charitable-hospital-organizations-section-501r3

                                     2019 Community Health Needs Assessment & Implementation Plan                                                                  5
•    Obesity Prevention
     •    Geographic Accessibility of Health Care Services
     •    Diabetic Care and Prevention

Several of these needs were also identified as high priority during the 2016 CHNA and are expected to be major
health care concerns in the future due the low socioeconomic conditions coupled with the remote frontier location.

Addressing the Health Care Needs of the Community
Based on the findings for the 2016 CHNA, Sage’s leadership adopted and began executing an implementation
strategy to meet the high priority health care needs of the community. Sage continues to expand upon the 2016
strategy through the following actions that address the community’s health care needs. 2

                                      •    Expansion of Behavioral Health Services; recruit/retain additional clinicians and
    Behavioral Health                      staff;
                                      •    Expand capacity for increased psychotherapy and counseling utilizing
                                           professionals with a working understanding of the Navajo culture;
                                      •    Implement an outreach program that identifies individuals at risk for Behavioral
                                           Health issues;
                                      •    Collaborate with local schools to identify at risk children;
                                      •    Expansion of the substance abuse rehabilitation programs;
                                      •    Implementation of Telemedicine for Behavioral Health Services
      Pediatric Care                  •    Expand public health immunization programs for children ages 6 months and
                                           older;
                                      •    Increase nutritional education outreach programs;
                                      •    Increase child and teen health information and education;
                                      •    Recruit/retain Board Certified Pediatricians;
                                      •    Expand the capacity for pediatric services at the Sage main campus clinic and
                                           Greasewood Springs clinic
    Obesity Prevention                •    Continue to educate community members about the importance of exercise and
                                           healthy lifestyles through the community outreach programs;
                                      •    Increase the number of community activities that encourage exercise and healthy
                                           lifestyle habits;
                                      •    Encourage the use of the Wellness Center for employees and patients referred
                                           through the Indian Health Service Special Diabetes Program for Indians grant
                                           program;
                                      •    Continue to conduct health fairs throughout the community;
                                      •    Recruit/retain a dietician;
                                      •    Recruit/retain certified personal trainers
     Accessibility to                 •    Expansion of Services within the Chapter communities;
      Health Care                     •    Review the viability of Telemedicine programs that would allow patients to access
        Services                           providers through a “virtual” environment;
                                      •    Coordinate patient home visits by Community Health Nurse(s) and collaboration
                                           with the Community Health Representatives to increase patient compliance with
                                           physicians’ plan of care for the patients who do not have reliable transportation
    Diabetes Care and                 •    Continue the community outreach program to educate community members about
       Prevention                          diabetes and prevention, and continue to refer individuals to the program;

2Full implementation and timing of this strategy may be impacted by the state and federal budget allocations, physician recruitment, and unforeseen impacts of the
PPACA.
                                    2019 Community Health Needs Assessment & Implementation Plan                                                                6
•     Increase community activities that encourage exercise and healthy lifestyles;
                                     •     Recruit/retain a Clinical Nurse Case Manager to facilitate the management and
                                           care of the diabetes program patients;
                                     •     Develop and support the Native Diabetes Wellness Program initiative to coincide
                                           with emerging Medicare trends shifting toward preventative care versus tertiary
                                           care;
                                     •     Continue to expand the Sage community garden to increase community
                                           involvement in wellness activities and supplement nutritional resources with
                                           healthy food alternatives;
                                     •     Expand health screenings at the community chapter level to identify at risk
                                           individuals

BACKGROUND INFORMATION

          History of Navajo Health Foundation-Sage Memorial Hospital
          Navajo Health Foundation-Sage Memorial Hospital, Inc. (“Sage”) is a private Arizona 501(c)(3) not for profit
          Health as a Rural General Hospital, is Joint Commission Accredited and is also Certified by the Centers of
          Medicare and Medicaid Services.

          healthcare organization governed by a five (5) member all Navajo Governing Board. Sage Memorial Hospital
          is in Ganado, Arizona on private land surrounded by the Navajo Nation and owned by the Presbytery of Grand
          Canyon. The main Sage campus consists of 82 buildings on approximately 110 acres which include the main
          hospital, an outpatient clinic, administrative offices, allied health clinics, employee childcare center employee
          wellness center and subsidized employee housing. Sage is licensed by the Arizona department of
          The Sage healthcare system includes the following facilities:
               • 25 bed Critical Access Hospital, Ganado, Arizona
               • Outpatient Rural Health Clinic, Ganado, Arizona
               • Outpatient Rural Health Clinic, Greasewood Springs, Arizona

          Sage has been recognized by the United States Department of Health and Human Services-Indian Health
          Services for providing high quality healthcare; Best in Class in the area of Diversity in Leadership and
          Governance Award from the American Hospital Association; 3 and Performance Leadership in Patient
          Outcomes Award from the National Organization of State Offices of Rural Health (NOSORH) and iVantage
          Health.4

          Services Provided by Sage Memorial Hospital
          Sage provides the following health care services to the community:

               •    Emergency Medical Services
               •    Emergency Medical Transportation (Ground and Air)
               •    Hospital inpatient services, including:
                    o Medical/Telemetry
                    o Swing bed Services

3 Watteau, M. (2012, 06 06). Diversity and Disparities Survey Providers a Snapshot of Current Practices. Hospitals honored for performance in key categories:
Retrieved from Institute for Diversity in Health Management, an affiliate of the American Hospital Association; http://www.divesityconnection.org
4 Strycker, M. (2015, 11 10). iVantage Celebrates National Rural Health Day. Retrieved from National Organization of State Offices of Rural Health;

https;//nosorh.org/ivantage-celebrates-national-rural-health-day/
                                    2019 Community Health Needs Assessment & Implementation Plan                                                                7
o  Pharmacy
       o  Medical Imaging
       o  Radiology
       o  Respiratory Therapy
       o  Rehabilitative Services
              Physical Therapy
              Speech Therapy
  •   Outpatient Services
       o Primary Care
       o Pediatrics
       o Dental
       o Optometry
       o Ophthalmology
       o Optical
       o Rehabilitative Services
              Physical Therapy
              Speech Therapy
       o Community Health Nursing
       o Pharmacy
       o Medical Imaging
       o Radiology
       o Laboratory
       o Respiratory Therapy
       o Behavioral Health and Social Services
  •   Community based health promotion and disease prevention activities
       o Diabetes Prevention and Treatment Program
       o Community Mass Vaccination Events
       o Diabetes Wellness Center Referrals
          All other health care services in the region are referred to health care facilities in the surrounding
          areas.

Definition of the Community Served by Sage Memorial Hospital
Sage primarily serves the Navajo Nation communities and Chapters of Cornfields, Ganado, Kinlichee,
Klagetoh, Greasewood Springs, Steamboat, Wide Ruins, and the portion of Nazlini that includes communities
south of Route 26. The region is predominantly part of the Apache County of Arizona, with some overlap
into Navajo County.

                  2019 Community Health Needs Assessment & Implementation Plan                                8
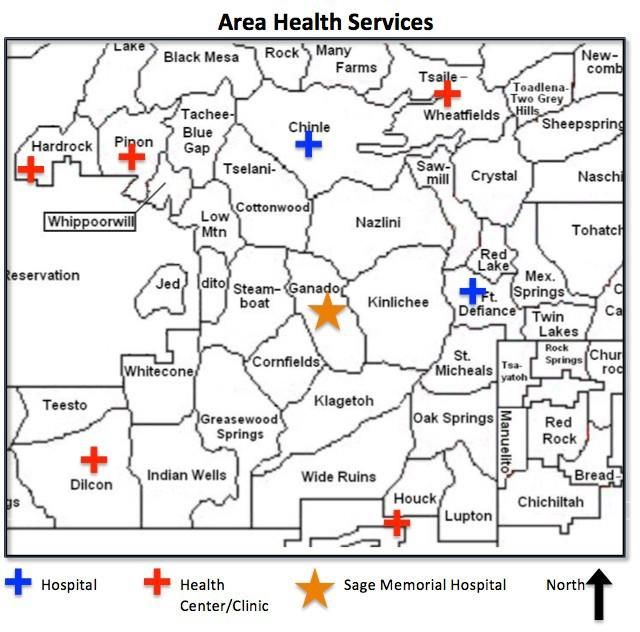
Figure 1; Map of the Navajo Nation indicating Sage’s location and service area Chapters5

         Figure 2: Map of Arizona highlighting Sage service area and Chapters

5Argueso, L., Navajo Health Foundation-Sage Memorial Hospital, Inc. Expert Report of Luis A. Argueso on Management Services. Board of Directors
Compensation, and Economic Impact. Litigation Report, HealthCare Appraisers, Inc.
                                  2019 Community Health Needs Assessment & Implementation Plan                                                    9
Other Regional Healthcare Facilities
Sage is the sole provider of health care service within its service area. There are two (2) hospitals located
approximately 50 miles outside of Sage’s primary service area: Chinle Comprehensive Health care Facility
which is a federally owned hospital operated by the Indian Health Services., and Tsehootsooi Medical Center.
Many patients from outside of the sage service area choose to travel to Sage to receive health care services.
COMMUNITY HEALTH NEEDS ASSESSMENT APPROACH
Overview
Sage’s Assessment Team comprised of hospital administration and executive leadership,
public health professionals and clinical staff, implemented a comprehensive approach in
assessing the health care needs of Sage’s service area. The team first engaged with the
community through surveys and interviews to capture firsthand input about health needs and
factors affecting the access and delivery of health care services to the region. The Team then
researched secondary data sources to better understand the community and its associated
health issues. Finally, the Team analyzed the community input and secondary data. Sage’s
executive leadership together with medical and clinical staff and public health experts with
institutional knowledge of the overall health needs of the region reviewed and presented the
data to the Board of Directors who then directed its administrative executive staff to prepare
an implementation plan addressing the needs identified in the CHNA.
2019 Community Health Needs Assessment & Implementation Plan 10Methodology
The Process for Consulting with Persons Representing the Community’s Interests
The Assessment Team identified two (2) groups to represent the community’s health interests:
• Individual members of the community
• Members of Sage’s Governing Board who also reside within the communities on the Navajo Nation.
These groups participated in surveys and focus groups coordinated by those Assessment Team members with
public health expertise. Results supported identification and prioritization of the community’s health needs.
Data Collection
The team obtained information using the following sources:
• Surveys completed by the Sage Governing Board
• Surveys completed by the community within Sage’s service area
• Surveys completed by the Sage hospital staff
• Sage health information systems data; and,
• Relevant secondary data from publicly available resources such as the United States Census Bureau and
its American Community Survey.
Community Survey
The Assessment Team developed a community health needs assessment survey and worked to gather data
from a representative group of community members. Paper surveys consisting of 46 questions were
distributed to members of the community and non-clinical Sage staff during a community survey event. Of
the surveys distributed a total of 626 were completed and returned. Additional copies of the surveys were
distributed to community members via email and 97 were completed utilizing online survey software. A
combined total of 529 paper and online surveys were used to identify the health needs of the community.
The survey contained questions tailored specifically to the communities represented. 6 Participant were asked
what social and health issues they believe are affecting their community. The survey included questions about
family and lifestyle backgrounds, demographics, health behaviors, community needs, and concerns,
environmental concerns and access to and availability of health care resources. The survey also includes
questions about the quality and level of health care received specifically from Sage.
Focus Group with Community Representatives
The Assessment Team conducted surveys with members of the hospital’s Governing Board who also have
extensive expertise in areas such as Education, Healthcare and Navajo Nation Government, to obtain in-depth
input about the needs of the community. The focus group had four (4) objectives:
1. Identify the top health care concerns affecting their individual communities
2. Determine underlying factors that impact the health care of community members
3. Identify perceived strengths and weaknesses of Sage; and,
4. Identify barriers that inhibit community members from obtaining maintaining overall good
health.
6 See Appendix E for a copy of the Survey and questions that was distributed to the community members and providers.
2019 Community Health Needs Assessment & Implementation Plan 11Sage Employee Survey
The employee survey consisted of twenty-one (21) questions and asked participants what they considered to
be top community and health issues affecting the hospital and its communities. Anonymously, Sage healthcare
providers completed and returned the survey.
Health Information Systems Data
Sage’s Health Information System contains historical patient healthcare encounters data with ICD-10 CM
medical diagnosis codes. The Health Information Systems Department provided the Assessment Team with
standard reports consistent with the Health Insurance Portability and Accountability Act (“HIPAA”) rules
and standards, which were used to quantify patient volumes and compare with qualitative data from the
surveys and focus group.
Secondary Data
The Assessment Team gathered and reviewed data from various authoritative sources such as the United
States Census Bureau and the U.S. Department of Health and Human Services to complete the initial
assessment and help determine the priorities of the CHNA, these secondary data sources appear as footnoted
citations throughout this document.7
Data Analysis
The Assessment Team reviewed and analyzed the qualitative primary data gathered from the community and
focus group surveys with the objective of mining useful information that suggest the top health care trends
and concerns in the community. The trends were then cross-referenced with national healthcare databases to
either validate or negate the outcomes. The validated outcomes were then correlated with the health care
provider surveys to further confirm Sage community’s top public health needs.
The Process for Identifying and Prioritizing Community Health Needs and Services
The Assessment Team presented the conclusions of the primary and secondary Data Analyses process to
Sage’s executive leadership team for additional input, cost-benefit analysis, and as implementation feasibility
analysis. Based on this information, the Assessment Team then prioritized and recommended the top-five (5)
health care needs of the community, as listed above.
KEY FINDINGS
Community Demographics
Population
The eight Chapter service area total population was estimated at 10,9728 individuals at the end of 2014.The
figure below illustrates the total population compared with the local county, state, and national historical
census data and current 5-year estimates.
7For a comprehensive list of all secondary data sources relied upon, refer to Appendix B.
8Although this is the estimate total population of Sage’s “service area,” many patients travel from outside the eight designated service area Chapters to receive
care at the hospital, so it is not possible to know the total population served.
2019 Community Health Needs Assessment & Implementation Plan 12Figure 4: Total population of service area compared to county, state, national census
Total Population Service Area Apache County Arizona United States
2000 Census 11,753 69,423 5,130,632 281,421,906
2010 Census 10,835 71,518 6,392,017 308,745,538
2010-2017 11,332 71,602 6,809,946 321,004,407
Estimates
% change 2000- -6.65 +3.92 +31.20 +13.30
present
As illustrated by the above figure, the population of Sage’s service area declined between the years of 2000
and 2010, however since the latest decennial census completed in 2010, the population of the service area is
estimated to be rising. This increase in the population of Sage’s service area is also reflected in Sage’s patient
census.
Race/Ethnicity
Utilizing the data provided by the American Community Survey 5-year estimates (“ACS”), the population of
Sage’s service area is predominantly American Indian/Alaska Native (96.5%), along with a small Caucasian
(3.4%) population. 0.7% of the population is two or more races, while exactly one percent (1%) combined is
Black, Asian, Native Hawaiian, or some other race. 9 These ACS estimates follow closely with the latest
decennial census values according to the Navajo Nation Division of Economic Development. 10 Data collected
through the CHNA survey confirms these race/ethnicity trends, with nearly 98.0% of the survey respondents
indicating AI/AN decent less than 1% indicating Caucasian/White, with the remainder less than 3% between
Black/African American, Asian/Pacific Islander, Hispanic/Latino, multi-racial, or some other race.
9 US Census Bureau (2014). American Community Survey 2013-2017 ACS 5-Year Narrative Profile Navajo Nation Reservation and Off Reservation Trust Land,
AZ-NM-UT. Retrieved 09 18 2017 from American Fact Finder
10 Navajo Nation Division of Economic Development. (2013) Navajo Population Profile 2010 US Census from http;//nec.navajo-
nsn.gov/portals/0/reports/NN2010PopulationProfile.pdf
2019 Community Health Needs Assessment & Implementation Plan 13Figure 5: Race/Ethnicity of Total Service Area Population
American Indian/Alaska
Native
97%
Caucsian/White
1%
2%
Black, Hispanic, Asian, or
other race
Population by Age and Sex
The population of Sage’s service area, according to the latest ACS estimates, is skewed toward younger
individuals, with roughly 32% of the total population under the age of 20, and nearly 14% over the age of
65. According to a report by Healthcare Appraisers, “…the healthcare needs of residents in the Navajo
Nation differ from the needs of the general American population; for example, there is less of a need to
focus on specialized care for the elderly than there is to ensure the primary care needs of children.”
Figure 6: Total Population by Age and Sex (2014)11
90%
80%
70% .25 .35
.06
60% .41
50%
40%
30%
.24
20% .14
.15
10%
0%
0 to 9 10 to 19 20 to 29 30 to 39 40 to 49 50 to 59 60 to 69 70 to 79 80 and Female
Over Male
Age Group
11
US Census Bureau (2014) American Community Survey 2013-2017 ACS 5-year Narrative Profile Navajo Nation Reservation and Off-Reservation Trust Land,
AZ-NM-UT Retrieved 09 18, 2017 from American Fact Finder.
2019 Community Health Needs Assessment & Implementation Plan 14Males generally outnumber females from the ages of zero to 49, however, ages 50 and over show equal or
higher numbers of women in the population as compared to males; this is a normal trend in most
populations as women generally have longer lifespans than that of men. Overall, females outnumber males
in Sage’s area, 64.5% female and 35.5% male.12
Population by Educational Attainment
A result comparison was conducted between the ACS 5-year estimates and Sage’s service area as seen
illustrated below in figure 7, the educational attainment is similar in areas of high school graduate/GED,
bachelor and graduate degree. According to the ACS 5-year estimates, 73.5% of individuals 25 years and
older have graduated with a high school degree and 26.5% did not graduate, 8.6% have a higher degree
(bachelor or graduate).
Figure 7: Educational Attainment of the Population
Educational Attainment of the Poplulation
180 40.00%
160 35.30% 35.00%
140
30.00%
120 26.50%
25.00%
100 22.00%
20.00%
80
15.00%
60
10.00%
40
7.60%
20 5.40% 5.00%
3.20%
108 158 164 51 28 16
0 0.00%
Less than high High school Some Associates degreeBachelor's degree Graduate degree
school graduate or GED college/tech
school
Sage Service Area ACS
Language
Navajo, a form of the Athabaskan language, is the second language spoken in Sage’s service area; nearly
75% of the population within the service area over the age of five (5) years speaks a language other than
English in their household, which is generally Navajo. Close to 15% of those within the service area speak
English less than very well, according to the last ACS estimates.13 The prevalence of individuals speaking a
language other than English as their primary form of communication can cause language barriers and is
therefore an important factor in the public health needs of the community, especially among those patients
more advanced in age. Patients with limited English proficiency are less likely to seek preventative care;
12
US Census Bureau (2014) American Community Survey 2013-2017 ACS 5-year Narrative Profile Navajo Nation Reservation and Off-Reservation Trust Land,
AZ-NM-UT Retrieved 09 18, 2017 from American Fact Finder.
13
US Census Bureau (2014) American Community Survey 2013-2017 ACS 5-year Narrative Profile Navajo Nation Reservation and Off-Reservation Trust Land.
AZ-NM-UT Retrieved 09 18 2017. From American Fact Finder.
2019 Community Health Needs Assessment & Implementation Plan 15they also tend to be less satisfied with the care they do receive and are more likely to report overall
problems with care and may be at an increased risk of experiencing medical errors. 14
Poverty Rate
The 40.5% rate of poverty for all people found in Sage’s service area 15 is significantly higher than the U.S.
national average of 11.8%,16 according to the latest ACS 5-year estimates. The figure below further
compares poverty rate statistics by age group for the service area against national averages. As is illustrated,
across all age groups the poverty rate in Sage’s service area remains more than double of that of the national
rate.
Figure 8: Percent of people below the poverty rate by age group compared with the US national rates
9.7%
65 years and over
37.2%
10.7%
18 to 64 years
33.1%
16.2%
Under 18 years
49.9%
11.8%
All People
40.5%
0.0% 10.0% 20.0% 30.0% 40.0% 50.0% 60.0%
U.S. National Avg. Service Area Avg
Household Income
Most households in the service area have incomes of less than $10,000 annually, while the percentage of
households with a six-figure income is negligible.17 The next largest household income group is in the
$10,000 to $24,999 range. It is important to note the lack of income disparity within the community; in
many areas of the country there are numerous households on both ends of the income spectrum within a
given community. However, in this region, it is apparent the community is predominantly of low socio-
economic status. Below is a figure comparing the household income for Sage’s service area with national
averages according to the last 5-year ACS estimates.18 Over 33.4% of the community survey respondents
14 Jacobs, E.A. (2004) Overcoming Language Barriers in Health Care; Costs and Benefits of Interpreter Services. American Journal of Public Health 94(5), 866-
869.
15 US Census Bureau (2014) American Community Survey 2013 2017 ACS 5-year Narrative Profile Navajo Nation Reservation and Off Reservation Trust Land
AZ -NM-UT Retrieved 09 18 2019 from American Fact Finder.
16 Semega Kollar Creamer and Mohanty (2019) Income and Poverty in the United States 2018. Retrieved from
http://census.gov/library/publications/2019/demo/p60-266.html.
17 US Census Bureau (2014) American Community Survey 2013-2017 ACS 5-Year Narrative Profile Navajo Nation Reservation and Off Reservation Trust Land
AZ-NM-UT Retrieved 09 18 2019 from America Fact Finder.
18 US Census Bureau (2014) American Community Survey 2013-2017 ACS 5-year Narrative Profile Navajo Nation Reservation and Off Reservation Trust Land
AZ-NM-UT Retrieved 09 18 2019 from America Fact Finder
2019 Community Health Needs Assessment & Implementation Plan 16indicated a household income of less than $10,000, with another 21% indicating a household income
between $10,000 and $24,999 annually.
Figure 8: Household income compared to American Community Survey National Averages
40.0%
35.0%
33.4%
30.0%
25.0%
24% 23.4%
20.0%
21%
15.0%
15.4% 15%
13.7%
10.0% 12.7% 12.5%
11.4%
5.0% 6.7%
5.3%
0.0%
LESS THAN $10,000 TO $25,000 TO $35,000 TO $50,000-$74,999 $75,000 AND
$10,00 $24,999 $34,999 $49,999 MORE
Service Area Avg American Community Survey
Unemployment Rate
Although employment statistics are constantly fluctuating over time, the unemployment rate in the service
area and overall region consistently remains much higher than the national rate. The. U.S. National
unemployment rate is 3.7%, whereas the unemployment rate in Sage’s service area is much higher at
33.9%.19 Qualitative primary data collected through community surveys indicates the unemployment rate
currently remains high in the service area.
Community Needs Index
The Community Needs Index (“CNI”)20 is a tool that was developed by Catholic Healthcare West,
Thompson Reuters, and the information products company, Solucient, to help health care organizations
address barriers to health care access in their communities. According to the CNI, the top five (5)
socioeconomic indications that contribute to health disparity are:
1. Income - the percentage of elderly, children, and adults living in poverty
2. Culture/language – the percentage of elderly, children, and adults over the age of 25 with limited
English proficiency
3. Education – the percentage of individuals over the age of 25 without a high school diploma
4. Housing status – the percentage of individuals who are renting or do not own their homes
5. Insurance coverage – the percentage of individuals without health insurance and who are
unemployed
19 These estimates include the entire populations ages 16 and older and may differ from the U.S. Bureau of Labor Statistics figures, which only include
unemployment rates for those individuals actively seeking employment.
20 Barsi, E., & Roth, R. (2005, July) The “Community Needs Index” Health Progress: https://www.chausa.org/publications/health-progress/article/july-august-
2005/the -community-need-index
2019 Community Health Needs Assessment & Implementation Plan 17By aggregating these factors and applying them to the Chapters within the service area, we are able to score
each area between 1.0 (low need) and 5.0 (high need).21According to the CNI methodology, “…residents of
communities with the highest CNI scores [are] twice as likely to experience preventable hospitalization for
manageable conditions such as ear infections, pneumonia or congestive heart failure, as communities with
the lowest CNI scores.”
Service Area Community Needs Index
Using the accepted methodology to calculate the CNI for Sage’s service area Chapters, the following nine
(9) questions were used to determine the score for the socioeconomic indicators mentioned above:
Income Barriers
• What percentage of the population is elderly and in poverty?
• What percentage of the population is composed of children in poverty?
• What percentage of the population is composed of single-parent households in poverty?
Cultural/Language Barriers
• What percentage of the population is of minority status?
• What percentage of the population is monolingual (not including English) or has limited English-
speaking proficiency?
Educational Barriers
• What percentage of the population lacks a high school diploma?
Insurance Barriers
• What percentage of the population lacks health insurance?
• What percentage of the population is unemployed?
Housing Barriers
• What percentage of the populations rents its shelter (house or apartment)?
The figure below illustrates the CNI score for each of the eight Chapters within Sage’s service area utilizing
the 2010-2014 ACA estimates data. These figures were calculated by assigning a score of 1 to 5 for each of
the question categories stated above, then averaging the combined score for each category to assign a
unique CNI value.
Figure 10: Socio-Economic Factors Affecting Health Care
No Married Single
Tot Un- Un- Min- Ltd 65+ Income Insur Educ C Hous CNI
Chapter Rent25 HS w/Ch w/Ch
Pop emp. insu dip Poverty poverty Rank Rank ul Rank Score
ority Eng. Poverty Rank
red t
R
an
k
Ganado 2608 33.6% 18.6% 29.9% 12.3% 94.9% 12.9% 29.9% 32.0% 39.0% 5 5 2 5 5 4.4
Cornfields 1111 10.7% 37.0% 35.5% 20.6% 100% 20.6% 40.0% 55.8% 32.5% 5 5 4 5 2 4.2
Greasewood 1230 30.1% 31.9% 23.9% 24.2% 98.7% 25.0% 35.2% 59.1% 40.2% 5 5 4 5 5 4.8
Nazlini 1067 21.5% 33.9% 26.4% 18.2% 99.5% 18.2% 28.1% 56.8% 36.4% 5 5 3 5 4 4.4
Klagetoh 863 18.9% 28.9% 32.7% 18.4% 98.6% 18.4% 59.4% 45.8% 44.7% 5 5 3 5 3 4.2
Kinlichee 1557 17.4% 29.5% 22.8% 15.2% 100% 15.2% 36.0% 41.8% 45.7% 5 5 2 5 3 4.0
Steamboat 1484 17.1% 41.1% 21.6% 18.9% 99.7% 19.1% 36.9% 58.9% 37.0% 5 5 3 5 3 4.2
Wide Ruins 1052 10.1% 38.6% 26.2% 12.8% 89.4% 18.7% 37.0% 80.8% 49.6% 5 5 2 5 2 3.8
21The CNI generally defines each area by zip code, however, some of the Chapters within Sage’s service area share zip codes, therefore, for the sake of this
analysis and report, we have chosen to distinguish area by Chapter rather than zip code.
2019 Community Health Needs Assessment & Implementation Plan 18According to the CNI methodology, a score greater than 3.0 generally indicates the area has a higher level
of socio-economic factors that impact the community’s access to health care. As can be seen from the figure
above, all of the Chapters in Sage’s service area have a score above 3.0, and all but one Chapter have a
score above 4.0, indicating all of these communities have a high need for community health services.
A closer examination of these scores reveals the following observations:
• The Wide Ruins community has the highest percentage of households with a single parent and
children living in poverty (80.8%);
• The Greasewood Springs and Ganado communities have the highest housing barriers, with 30.1%
and 33.6% of the population currently renting, respectively;
• The Steamboat community has the highest rate of unemployment (41/1%);
• The Cornfield and Kinlichee communities both have 100% minority populations;
• The Klagetoh community has the highest rate of married couples with children living in poverty
(59.4%);
• The Greasewood Springs Chapter has the highest rate of individuals who speak English less than
well (25.0%), and also has the highest rate of individuals over the age of 25 with no high school
diploma or equivalent (24.2%).
Primary and Chronic Disease Care Access, Quality of Care, and other Health Needs of Uninsured
Persons, Low-Income Persons, and Minority groups
According to the Assessment Team’s secondary research, studies identifying specific group needs distinct
from the general population at the Navajo Nation Chapter unit level of analysis are not available from
secondary sources.
In 1999, Congress passed the Healthcare Research and Quality Act (P.L. 106-129), mandating that the
Agency for Healthcare Research and Quality (“AHRQ”) produce an annual report on “national trends in the
quality of health care provided to the American people,” titled the National Healthcare Disparities Report
(“NHDR”). As of 2014, the NDHR has been combined with the National Healthcare Quality Report
(“NHQR”) to replace both reports and form a new report entitled the National Healthcare Quality &
Disparities Report (“QDR”). This annual report “provides a comprehensive overview of the quality of
health care received by the general U.S. Population and disparities in care experienced by different racial,
ethnic, and socioeconomic groups.” This report examines the quality and disparities in health care received
by designated care differences in each priority population, however, it does not provide a complete
assessment of health care differences in each priority population. The measures tracked were selected as
applicable across many population groups with the purpose of tracking quality and disparities data at the
national level.22
According to the latest QDR report, national trends observed were:
Uninsured persons
The QDR indicated that the lack of health insurance coverage was one of the most significant contributing
factors to poor quality of care, but that since the Patient Protection and Affordable Care Act (PPACA) was
passed in 2010 and coverage began in 2014, a marked decrease in the rate of insurance has been observed.
The QDR identified the following statistics as most significant in relation to uninsured persons:
222017 National Healthcare Quality and Disparities Report Rockville, MD: Agency for Healthcare Research and Quality: September 2018, AHRQ Pub No 18-
0033-EF
2019 Community Health Needs Assessment & Implementation Plan 19• After years without improvement, the percentage of uninsured adults (ages 18-64) increased
substantially during the first half of 2014;
• From 2008 to 2015, the percentage of adults ages 18-64 disparities range decreased between the
insured and uninsured;
• From 2008-2015, the percentage without health insurance decreased from 29.7% to 18.5%;
• In 2017, the percentage without health insurance decreased to 12.8%;
• During 2013 to 2017, the percentage of adults ages 18-64 without health insurance decreased
significantly among Whites, Blacks, Asians, and Hispanics.
Low-income and ethnic minority groups’ care access and quality disparities
The QDR states that care access and quality disparities are observed in the largest number in poor
households, followed by Hispanics 23 and Blacks. “Poor” indicates a “…family income less than the federal
poverty level…” which would include the majority of the households in Sage’s service area, as illustrated in
Figures 8 & 9 above.24 The following care access and quality disparities were identified in the 2017 QDR
regarding the issues low-income groups face on a national level:
Care Access
• Between 2015-2016, people in poor households had worse access to care than people in high-
income households;
• From 2015-2016, most disparities in access to care related to race, ethnicity, or income showed no
significant change, neither getting smaller nor larger;
• Uninsured American Indians and Alaska Natives had worse access to care than Whites with
comparison rate of 20.1% to 9.6%;
• American Indians and Alaska Natives with health insurance is lower than Whites with a comparison
rate of 74.6% to 89.8% respectively.
Quality of Care
• Hispanics, American Indians and Alaska Natives, and Asians received worse care than Whites for
some quality measures and better care for some measures;
• People in poor households received worse care than people in high-income households on more than
half of quality measures;
• When changes in disparities occurred, measures of disparities were more likely to show
improvement than decline. However, for people in poor households, more measures showed
worsening disparities than improvement.
Disparity improvement/worsening by unique ethnic/minority group
• Measures for which the gap between AI/AN and Whites grew smaller, indicating improvement:
o Influenza and meningococcal conjugate vaccination have been the major improvements for
adolescents AI/AN from an estimate of 43% in 2008 to 90% in 2014;
o End stage renal disease related to diabetes has decreased in AI/AN from 526 per million to 275.8
per million; Whites 133.3 per million to 139.8 per million from 2008 to 2015.
• Measures for which the gap between AI/AN and Whites grew larger indicating worsening
disparities:
o Infant mortality rate per 1,000 has increased to 3.9% for AI/AN infants and to 1.8% for White
infants;
23 “Hispanics” includes all races other than Blacks and Whites
242017 National Healthcare Quality and Disparities Report Rockville, MD: Agency for Healthcare Research and Quality; September 2018 AHRQ Pub No 18-
0033-EF
2019 Community Health Needs Assessment & Implementation Plan 20o Indication of poor healthcare received in the clinic setting was 26% for AI/AN compared to
10.3% for Whites.
Black or African American
• Measures for which the gap between Blacks and Whites grew smaller indicating improvement:
o Influenza vaccination has improved among Black adults from 84.9% to 93.5% between 2012 and
2015;
o Tdap vaccination improved among teens, ages 16-17 to 84.1% from 26.5% between 2008-2015;
• Measures for which the gap between Blacks and Whites grew larger indicating worsening
disparities:
o New HIV cases per 100,000 are worse in Blacks than Whites at a rate of 52.9% and 6.0%
respectively;
o Hypertension hospital admission increased in Blacks at the rate of 170.3 per 100,000 to 33.9 per
100,000 in Whites in 2015.
Asian
• Measures for which the gap between Asians and Whites grew smaller, indicating improvement:
o Influenza vaccination has improved among Asians from 83.3% to 95.1% between 2012 and
2015;
o Tdap vaccination improved among teens, ages 17-21 to 87.5% from 38.4% between 2008
and 2015;
• Measures for which the gap between Asians and Whites grew larger indicating worsening
disparities:
o Anticoagulant related adverse drug event was higher in Asians than Whites at the rate of
11.4% to 2.7% respectively in 2015;
o Deaths per 1,000 elective surgery was higher in Asians than Whites at the rate of 122.4 and
108.1 respectively in 2015.
Hispanic or Latino
• Measures for which the gap between Hispanics and whites grew smaller, indicating improvement:
o Tdap vaccinations improved among Hispanic adolescents ages 13-17 in 2008 to 2015;
• Measures for which the gap between Hispanics and Whites grew larger indicating worsening
disparities:
o New HIV cases per 100,000 are worse in Hispanics than Whites at the rate of 23.1 and 6.2
respectively.
Causes of Death among American Indians/Alaskan Natives compared to all other races 25
Studies identifying specific group needs distinct from the general population at the Navajo Nation Chapter
unit level of analysis are not available from secondary sources according to secondary data research
conducted by the Assessment Team, however there is data available that specifically studies the health
trends of the minority group of American Indians/Alaska Natives (“AI/AN”) residing in the Indian Health
Service’s (“IHS”) service area. Since over 95% of Sage’s service area falls into the AI/AN category and
also resides in the Indian Health Service area, this data is valuable to consider apart from the QDR data on
the health needs of minority groups nationally.
25 U.S. Department of Health and Human Services – Indian Health Service (2015). Trends in Indian Health 2014 Edition. Retrieved from
https://www.ihs.gov/sites/dps/themes/responsive2017/display/objects/documents/Trends2014Book508.pdf.
2019 Community Health Needs Assessment & Implementation Plan 21You can also read