2020 2021 EXECUTIVE REPORT - Nevada County, California
←
→
Page content transcription
If your browser does not render page correctly, please read the page content below
2020 - 2021
Nevada Count y, California
E X E C U T I V E R E P O RT
P r e p a r e d   b y   N e v a d a   C o u n t y   E x e c u t i v e   O f f i c e

Nestled into the western slope of the Sierra Nevada
               Mountains, Nevada County is known as the heart of
               “Gold Country.” Incorporated in 1851 like many
Introduction
               Counties in the area, and comprised of three
               incorporated cities; Nevada City (the County Seat),
               Grass Valley, and Truckee, all of which played
               important roles in California’s Gold Rush. Nevada
               County’s abundance of gold streaked rivers and
               streams where rich underground mines made the
                                                                    Empire Mine, Grass Valley
               area a prominent mining community in California.
               Even during the Depression of the 1930’s, Grass Valley thrived because of its strong mining based
               economy.

               Nevada County is known to provide its residents with a great quality of life. The economy is well
               supported by a wide array of industries including manufacturing, retail, technology, agriculture,
               construction and health services. Nevada County has an above-average high school graduation
               rate, accessibility to traditional, charter and private schools, and higher-level education at our
               recently expanded local Sierra College campus. Infrastructure projects such as the broadband
               initiative and library technology center, offer opportunities for viable expansion while maintaining
               a small-town feel.

                                                                          The Gold Country is often a
                                                                          recommended tourist destination and
                                                                          stands out for its rich mining history,
                                                                          museums, quaint Victorian architecture
                                                                          coupled with an assortment of outdoor,
                                                                          arts, and cultural activities offered year-
                                                                          round. Recently, Nevada City ranked
                                                                          number one on Sunset Magazine’s
                                                                          “Best Value Towns” for 2017. Truckee
                                                                          continuously receives recognition, from
                                                                          Sunset Magazine’s “Top Four Best
                                                                          Adventure Town” to ranking third for
                                                                          USA Today’s “Best Ski Town” in 2016.
               Constitution Day Parade, Nevada City

               Note on Comparison Data: Nevada County selected seven counties (Butte, El Dorado,
               Mendocino, Napa, Placer, Sutter, and Tehama) for comparison purposes on some shared
               characteristics throughout this report, including rural geography, close to an urban center,
               demographics, and size. The intent is to provide insight into Nevada County’s unique
               community, social, geographic, and demographic environment.

                                                           2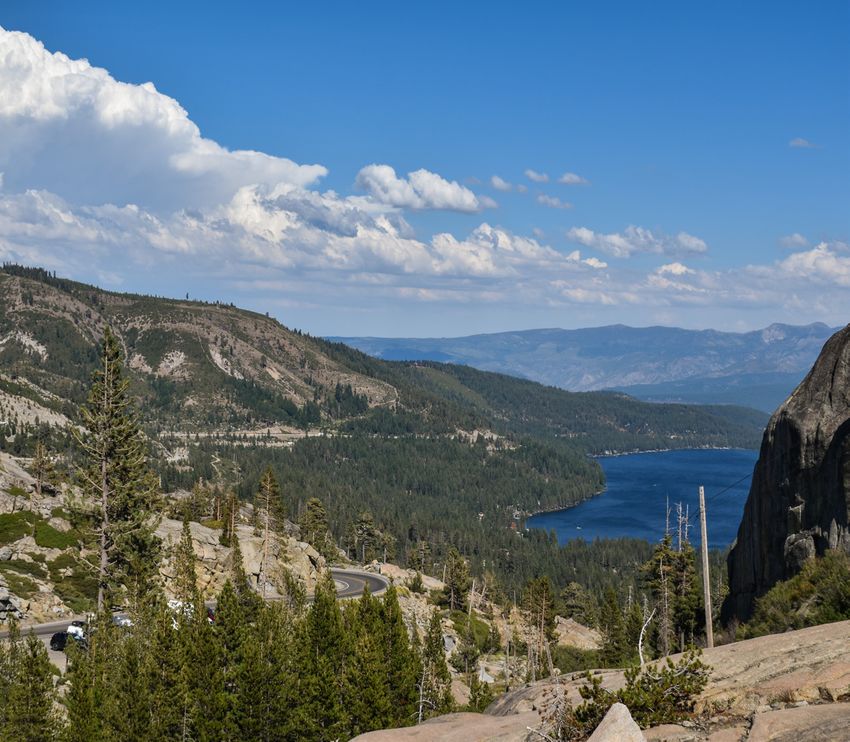
Geography
193 inches
Community and Society
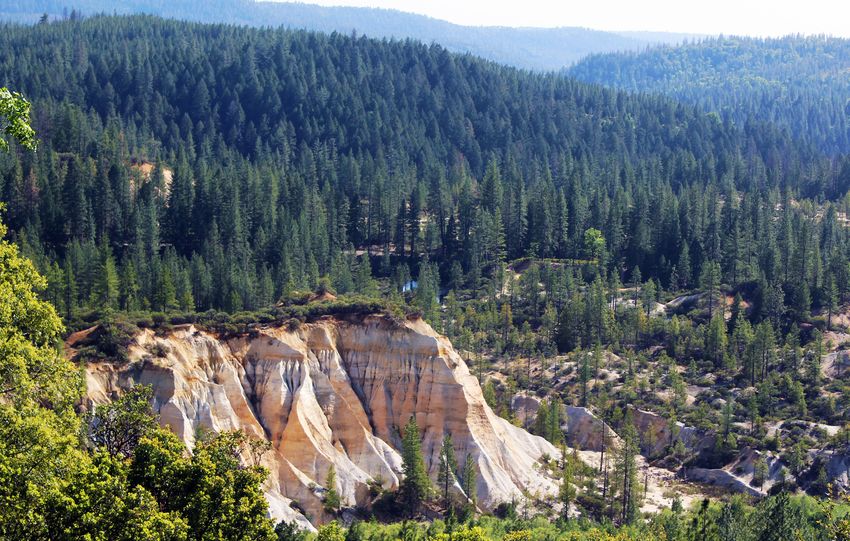
Residents and visitors enjoy Nevada County’s historic foothill towns
nestled amidst pristine rivers, picturesque forests and the rugged of average
beauty of the Sierra Nevada Mountains. snowfall
(Truckee Area)
240 average
sunny days
157 miles
East of San
Francisco
91 miles
Southeast of
Reno
Nevada County offers a rural and small-town lifestyle, while still
being located within a convenient distance from urban centers in
Sacramento, the Bay Area and Reno.
The weather of Nevada County is another valued feature of the area. 60 miles
Residents enjoy a long, warm sunny-season while experiencing color Northeast of
changes in the fall with cool,
occasionally snowy winters.
Lake Tahoe
Summer temperatures are
typically mild with average highs
near 85 degrees in July. Rain in
January typically averages ten 60 miles
inches per year and the highest Northwest of
elevations receive an annual
Sacramento
average of 206 inches of snow.
3
Recreation
                                                Scenic trails, alpine lakes,                     178 public
                                                the Yuba River and the
                                                Sierra Nevada Mountains
                                                                                                      trails in
                                                all support numerous                                  Nevada
                                                recreation        activities,                         County
                                                including skiing, biking,
                                                hiking, fishing, kayaking,
                                                hunting and backpacking.
                                                With a calendar packed                         Nearby access
                                                with street fairs, festivals,
                                                                                               to the 1,362
                                                art exhibits, local theater
and children’s activities, visitors and locals can experience small-town                       miles2 of the
life without having to forgo indulgence in pleasures more typical of an                        Tahoe
urban setting.                                                                                 National
                                                                                               Forest
Tourism
Whether tourists come to watch the Tour of Nevada City bicycle race, hit
the ski slopes in Truckee, or enjoy the Cornish Christmas street fair,
Nevada County offers something for everyone.                                                           3.2%
                                                                                                      average
Tourism is a key economic generator in Nevada County. Tourism
spending supports jobs for County residents and contribute tax revenue                                 annual
to local and state governments.                                                                    increase in
                                                                                                      tourism
                                       Total Direct Travel Spending                                  spending
                                              Nevada County
                         330
                                                                                       318.2
                         320                                                   310.9
                                                                                               $310M in
   Millions of Dollars

                         310                    303                    304.1
                                         298              298.7
                         300
                         290   285.3                                                           travel related
                         280                                                                   spending in
                         270
                         260
                                                                                               2015
                               2010      2011   2012       2013        2014    2015    2016
                                                       Calendar Year

Dean Runyan Associates, California Travel Impacts by County

                                                                       4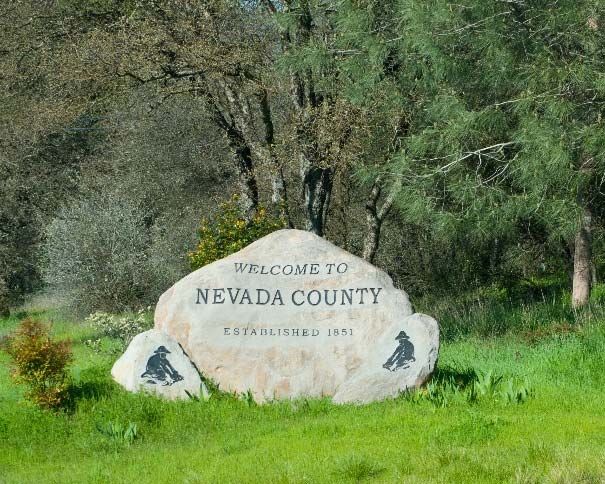
Population
With just under 100,000 residents, Nevada County is the 36th most
                                                                                                      98,095
populous county in California. The population grew from 92,053 in                                          total
2000 to 98,764 in 2010, and now totals 98,828 in 2017. Nevada County                                  population
saw its highest growth between the 1950s and 1990s. Preliminary data
indicates that the population will remain stable.

     20,000
                                                                                                  260%
                                                                                                  growth
     15,000
                                                                                                  between 1950
                                                                                                  to 1980
     10,000                                                                        Grass Valley
                                                                                   Truckee
                                                                                   Nevada City
      5,000
                                                                                                  70% growth
          ‐
                                                                                                    in the 1980’s
                                                                                                         vs. 7%
Dept. of Finance, Demographic Research Unit E‐5 Report                                                    growth
                                                                                                    in the 2000’s
In the last 15 years, the unincorporated portions of the County have
seen the largest growth. The incorporated areas of the County are home
to 32% of the population, with 16% in Truckee, 13% in Grass Valley,
and 3% in Nevada City, while 68% live in outlying unincorporated                                    101,767
areas.                                                                                                 estimated
                                                                                                      population
120,000
                                                                        98,764 98,095
                                                                                                         by 2020
                                                                                        98,828
                                                         92,033
100,000
                                         78,510
                                                                      66,656 66,510
 80,000
                                    51,645
                                              60,283
                                                       64,392                         66,857
                                                                                                  68% live in
 60,000
                                                                                                  unincorporated
 40,000                                                           32,108     31,585   31,971
                  17,789
                           19,888     42,832
                                          18,227
                                                       27,641                                     areas
 20,000
                           11,919 8,813
                  13,505
      0                     7,969
                  4,284
              1900      1950      1980       1990     2000        2010        2016      2017
                   Incorporated              Unincorporated                Total County

Dept. of Finance, Demographic Research Unit E‐5 Report
                                                                  5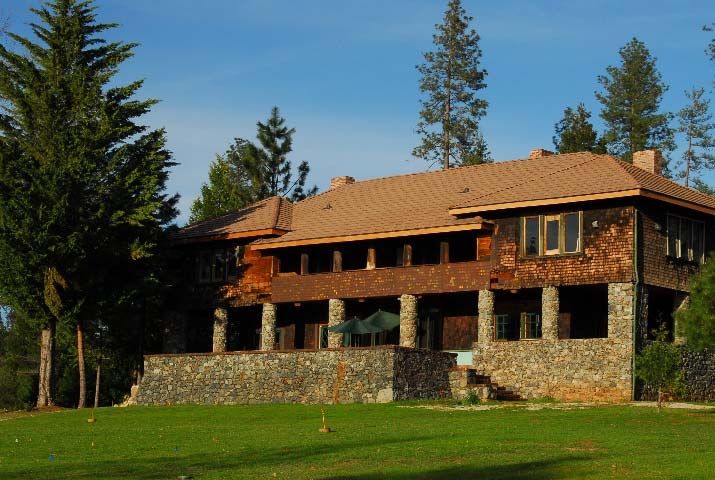
In the decade from 2000 to 2010, Nevada County population grew by 7%, considerably less than the
40% growth in Placer and 20% in Yuba counties. In the past 3 years, however, all of the comparison
counties have seen significantly less growth than in the previous decade.

                        Population                                                          Ethnicity
                  Total Pop        % Pop          65 Yrs   White     Hispanic     Asian        African     American     Other
                  Estimated        Change          and                  Or                    American    Indian and
                    2017           2010 –         Older               Latino                                Alaska
                                    2017           2016                                                     Native
Nevada                   99,814      1.1%           26%     94%           10%        1%              1%           1%       3%
Butte                   229,294      4.2%           18%     86%           16%        5%              2%           2%       5%
El Dorado               188,987      4.4%           19%     89%           13%        4%              1%           1%       4%
Mendocino                88,018      0.2%           21%     86%           25%        2%              1%           6%       4%
Napa                    140,973      3.3%           18%     84%           34%        9%              2%           1%       4%
Placer                  386,166     10.8%           19%     85%           14%        7%              2%           1%       5%
Sutter                   96,648      2.0%           15%     73%           31%       17%              3%           2%       5%
Tehama                   63,926      0.8%           19%     90%           25%        1%              1%           3%       4%
Yuba                     77,031      6.8%           12%     79%           28%        7%              4%           3%       7%
United States Census QuickFacts, Note: Individuals may identify as one or more ethnicity.

Compared to its surrounding counties, Nevada County has the highest percentage of residents over 65
years of age (23%). There are fewer residents under the age of 30 in Nevada County (29%) than
statewide (41%). With the recent improvement in the County’s unemployment and economic status,
the attractiveness of this area as a great place for young families continues to increase.

                                                                                   Age                    Population*
                                                                                             0-14                       14,140
                         75+ Yrs   0‐14 Yrs
                           9%        14%
                                                                                            15-29                       14,818

                                         15‐29 Yrs
                                                                                            30-44                       15,459
            60‐74 Yrs
              24%                          15%
                                                                                            45-59                       21,907

                                      30‐44 Yrs                                             60-74                       23,284
                    45‐59 Yrs           16%
                     22.2%
                                                                                              75+                        9,285

         0‐14 Yrs            15‐29 Yrs          30‐44 Yrs                                    Total                      98,893
         45‐59 Yrs           60‐74 Yrs          75+ Yrs
United States Census‐Fact Finder – American Fact Finder, July 2017 Data

                                                              6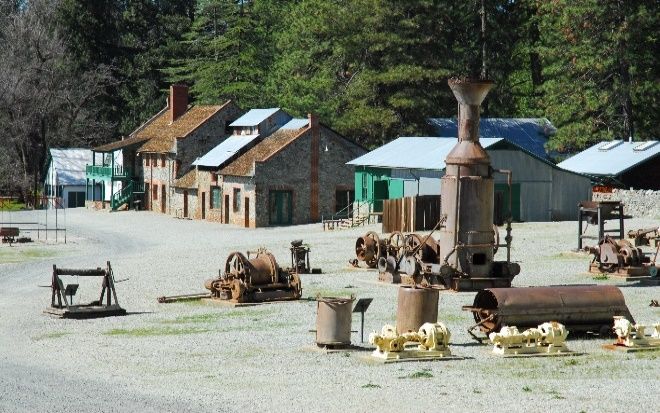
Education
2 Sierra
The well-educated population of Nevada County correlates with the
variety of top-notch schools, and several higher education options either College
within the county, or within easy commuting distance. campuses
Education Completed
(+25Yrs of Age) Nevada Statewide
County
Less than 9th Grade 2% 10%
9th-12th grade, no diploma 4% 8%
High School diploma/GED
Some College, no degree
21%
30%
21%
22%
73% of
Associates degree 11% 8% residents
Bachelor's degree 21% 20% attended
Graduate or professional degree 11% 11%
Total 100% 100% college
United States Census‐Fact Finder – American Fact Finder
Nevada County has a variety of grade K-12 schools, and two Sierra
College campuses located in Grass Valley and Truckee. K-12 enrollment
peaked in the mid-2000s, and has declined steadily since. The recent
economic downturn caused many young families to move to urban areas in
search of employment. With the improvement in the economy, this trend is 98% of
predicted to slow or reverse. residents have
Mirroring a national trend, charter school attendance has increased in more than 9th
recent years, with attendance in western Nevada County climbing from grade
3,298 in 2008/09 to 3,693 in 2016/17, allowing parents to choose between education
many different educational experiences for their children.
K‐12 Enrollment Enrollment by Grade
Grade 12 2,093
16,000 14,749 14,691
Grade 11 991
13,448 12,800
14,000 12,305 Grade 10 839
11,424
12,000 Grade 9 786
10,000 Grade 8 789
8,000 Grade 7 759
Grade 6 742
6,000
Grade 5 752
4,000 Grade 4 767
2,000 Grade 3 764
0 Grade 2 711
Grade 1
2017‐18
2014‐15
2015‐16
2016‐17
2011‐12
2012‐13
2013‐14
2008‐09
2009‐10
2010‐11
2006‐07
2007‐08
2004‐05
2005‐06
2002‐03
2003‐04
698
Kingergarten 916
0 500 1,000 1,500 2,000 2,500
California Department of Education Education Data Partnership
7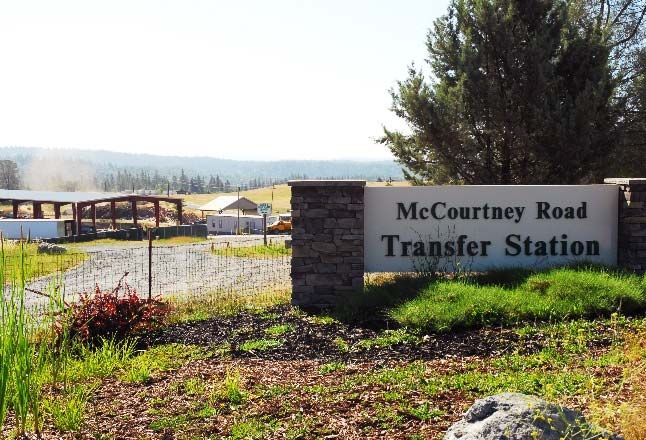
Arts and Culture
Nevada County is a creative hotspot in the Sierra
Nevada, offering an array of experiences, including
concerts, film festivals, street fairs, dance
performances, poetry readings, studio tours and
galleries. The county also has numerous venues for
performing arts, many of which are historic settings.

The arts have a large economic impact, which has
become a vital component to life in Nevada County.
The Nevada County Arts Council helps support
local visual, literary, and preforming arts and was
appointed by the Board of Supervisors as the Nevada Theater (1865), California’s oldest theater building
county’s leadership and coordinating agency in 2009. In 2017, Nevada City-Grass Valley and Truckee
were declared as Cultural Art Districts in the California.

Historical Legacy
Native American, pioneer, railroad, and mining history of Nevada County can be explored at various
locations throughout the County. Nevada County was at the heart of the California Gold Rush and
was settled in 1849, which drew scores of migrants from around the world, reshaping California and
the nation. Nevada County residents and visitors can use the MyNeighborhood interactive map to
explore the many registered historical landmarks in the area to appreciate our rich historical legacy.

Museum and Historic Site Highlights

Bridgeport Covered Bridge
Empire Mine State Park
Donner State Park and Museum
Malakoff Diggins State Park
Searls Historic Library
Nevada County Narrow Gauge Museum
North Star Mining Museum
Saint Joseph’s Cultural Center
                                                        Northstar House, Grass Valley

                                                                2 of 14
                     23 Historic                                California Cultural
                                                                Art Districts in
                               Sites
                                                                Nevada County

                                                8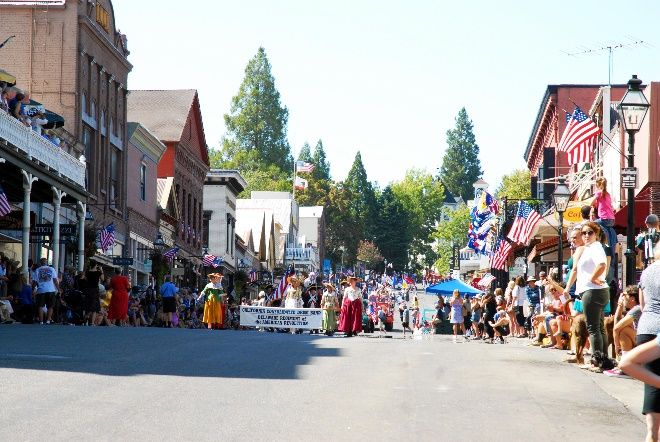
Health and Wellness
According to an annual study conducted by the Robert Wood
                                                                                          In
Johnson Foundation, Nevada County is ranked the seventh healthiest                   California:
county in California, and fifth in the state for Quality of Life.

                   Health and Wellness Measures - 2018                               7th healthiest
                 % Pop          Health  % Overweight              Immunization
                Uninsured      Outcomes   / Obese                   Rates*
                                                                                                county
                                Rank
Nevada                    8%              14               21%              80.90%
Butte                     8%              37               25%              94.10%
El Dorado                 6%              17               19%              93.90%

                                                                                     5th in quality
Mendocino                12%              44               25%              88.70%
Napa                      8%               5               23%              96.20%
Placer                    5%               4               21%              92.40%   of life
Sutter                   11%              32               30%              85.30%
Tehama                    9%              43               27%              93.40%
Yuba                      9%              28               28%              96.10%
County Health Rankings & Roadmaps, California Department of Public Health
*Figures reflect kindergarten immunization rate

Although Nevada County does well in the areas of overall health and                            15th in
physical environment, among comparison counties it has the lowest                         Women’s
rate of children being fully immunized prior to kindergarten entrance.
                                               However,             the
                                                                                      Well‐Being by
          % of Population in Poverty           percentage of fully                        California
                   in 2017                           immunized                            Budget &
                                               kindergarteners      has               Policy Center
       Placer          7.2%
                                               recently       increased
        Napa            7.9%
   El Dorado             8.7%
                                               from       77.1%      in
      Nevada                10.9%              2015/16 to 80.9% in
        Yuba                      16.6%        2016/17, compared to
       Sutter                      17.1%       the               95.6%
 Mendocino
        Butte
                                     19.0%
                                      19.5%
                                               immunization rate for
                                               the state.
                                                                                     4th lowest in
    Tehama                                   20.9%                                   population
             0%     5%    10% 15% 20% 25%   In 2018 the Federal                      poverty among
                                            poverty level for a
US Census
family of four was $25,100, compared to Nevada County’s $57,429
                                                                                     comparison
and the median statewide household income of $63,783.                                counties

                                                          9
Nevada City, Grass Valley, Truckee, and nine
Government   unincorporated areas make up Nevada County. The five
             elected Board of Supervisors are the legislative and
             executive body of county government and serves as the
             governing body of the Nevada County Sanitation
             District. The Board adopts ordinances and resolutions
             and is responsible for seeing that all Federal and State
             mandated functions are properly discharged.

                      Selected Measures of Government                    There are six Elected County Officials; the
                                                  Staff /     Expense    District Attorney, Sheriff, Assessor,
                             Incorporated
                                                   1000         per      Auditor-Controller,            Treasurer/Tax
                             Cities/Towns
                                                 Residents    Capita     Collector, and the Clerk-Recorder. The
             Nevada                        3            7.9      2,232   Board appoints a County Executive Officer
             Butte                         5          10.2       2,326
             El Dorado                     2          10.1       2,858
                                                                         (CEO) to direct the planning, operations and
             Mendocino                     4          16.0       3,389   management of the County and the CEO
             Napa                          5          10.6       4,030   appoints department heads over areas in
             Placer                        6            7.5      2,642   which they have special knowledge, ability,
             Sutter                        2          10.3       3,306   and expertise. Nevada County does not
             Tehama                        3          13.9       2,918
                                                                         provide direct fire protection or parks and
             Yuba                          2          11.7       2,168
                                                                         recreation services. These services are
             County Budgets and US Census Data
                                                                         provided by special districts.

             2017/2018 Accomplishments
             In October of 2017, Nevada County had two fires that caused
             evacuations and loss of homes. Office of Emergency Services has                      Nearly 30
             been actively working on fire recovery and prevention by                           homes lost in
             increasing funding towards vegetation management, green waste
                                                                                                       2017
             sites, and fire abatement inspection programs and services.

             Homelessness services became an A Priority for the Board of
             Supervisors in 2018. Health and Human Services presented a five-
                                                                                            272
             year plan to the Board, proposing a Housing First approach, a                  Homeless
             homeless services day center, and has already implemented a                    individuals
             coordinated entry system with community partners.                              counted
             Throughout 2017 and 2018, Nevada County’s Community
             Development Agency hosted a participatory community process
             for new, local cannabis regulation with, including a Community
                                                                                             10 community
             Advisory Group. A new cannabis ordinance is expected to be                         meeting held
             completed in 2018.                                                                over 8 months

                                                               10
Library Services
The Nevada County Library provides public 9,840
library services from its three branches in annual Library
Nevada City, Grass Valley, and Truckee, its volunteer
two stations in Penn Valley and Bear River,
and its two kiosks in North San Juan and Cedar
hours
Ridge. The nonprofit organization Friends of
the Nevada County Libraries also collaborates
with the County to manage and help operate
the Doris Foley Library for Historical 1st in
Research. circulation per
A voter approved sales tax measure in 2016 provides a one-fourth cent capita
sales tax to fund County libraries. This revenue and community compared to
involvement helps support the robust library programs available here. comparison
Of the six comparison counties, Nevada County has the highest
counties
circulation per capita (6.89) and the third highest operating expenditure
per capita ($26.12) behind Placer and Mendocino counties.
The services offered by the Nevada County Library reflect the
important role of technology in the community. The Library saw a 10% 30,000
increase in ebooks and audiobooks downloads in 2015/2016, and more
ebooks and
than 32,000 internet sessions were recorded at all of the branches.
audiobooks
The Collaborative Technology Center, located at the Madelyn Helling downloaded
Library, offers free technology and creativity classes such as 3D
printers and tech help. In addition, the Library has a grant-funded
Mobile Technology Center that is bringing internet access, technology,
and instructions to schools and rural locations throughout the County.
Program
Total $ Spent Per Open Hours Circulation
County Attendance
Circulation Capita Per Year Per Capita
per Capita
Nevada County 676,301 $26.12 9,024 6.89 0.25
Butte County 978,698 $13.69 10,788 4.36 0.16
Mendocino County 602,227 $34.17 11,876 6.78 0.17
Placer County 1,084,607 $30.13 16,761 5.56 0.16
Sutter County 320,584 $12.88 4,208 3.34 0.62
Tehama County 155,928 $9.32 2,853 2.42 0.15
Yuba County 99,071 $5.18 1,352 1.34 0.03
California State Library
11Criminal Justice
Nevada County is a low crime county. Low crime rates are attributed to 1st lowest
the innovative and collaborative approach to criminal justice taken by felony rate per
local agencies and community partners. Our public safety agencies, capita of
human service agencies and non-profits meet regularly to strategize and
coordinate service delivery.
comparison
counties
Nevada County Adult and Juvenile Arrests Per 1000 Residents
All ages, both genders, 2016
County Population Felony Misdemeanor Drug* Total
Nevada
Butte
98,893
224,241
10.1
13.6
22.3
33.7
4.0
5.1
32.35
47.23 2nd lowest
El Dorado 183,087 11.3 21.3 4.1 32.59
Mendocino 87,869 16.7 38.1 5.4 54.79
overall crime
Napa 141,667 14.0 22.8 3.4 36.77 rate of
Placer 371,649 11.1 15.1 3.5 26.22 comparison
Sutter 95,847 12.7 26.0 2.7 38.74
Tehama 63,067 22.7 37.8 9.3 60.48 counties
Yuba 73,966 19.1 34.7 4.4 53.85
State of California Department of Justice
*Figures reflect only Felony drug charges
Responded to
Sheriff 3,866
The Nevada County Sheriff’s Office
incident
plays an important role in interfacing reports in
with the community in day-to-day 2016
operations that cast a wide and
critical footprint. The largest unit in
the Sheriff's Office is the uniformed
Patrol Division, based in Western Made
Nevada County, with an additional
substation in Truckee. The Sheriff’s
1,758
Office has local correctional facilities arrests in 2016
in Nevada City and Truckee, and assists in court security. In addition, all
three incorporated cities have police forces. The Nevada County
Sheriff’s office operates a centralized Dispatch unit that handles Conducted
dispatch for the cities and unincorporated area.
119 new
investigations
in 2016
12Probation Reduced
Nevada County Probation protects our community by promoting recidivism by
responsible behavior and offender accountability; providing objective,
accurate 40% since
Probation Caseloads 2016
County Felony Misdemeanor Total
information and 2011
recommendations
Nevada 6.1 1.4 7.5
to the Court;
Butte 5.8 1.6 7.4
operating safe
El Dorado
Mendocino
5.0
7.9
0.7
1.6
5.7 secure
9.6 facilities
juvenile 40% average
and
Napa 4.9 9.0 13.9 programs; and
recidivism rate
Placer 5.3 3.4 8.7 collaborating for California
Sutter 7.4 0.1 7.6 with the counties
Tehama 13.4 1.1 14.6 community to
Yuba 2.4 0.1 2.6 provide direct
State of California Department of Justice services to
offenders, families and victims. Probation’s low recidivism rate is due
to the department’s mission of implementing evidence-based practices 10% average
to increase public safety within the community that have stopped the AB109
“revolving door” of crime.
recidivism rate
District Attorney for Nevada
County
The Nevada County District Attorney has offices in both Nevada City
and Truckee that review investigations conducted by law enforcement
agencies, participates in joint investigations or, when appropriate,
conducts their own investigation. The District Attorney’s office is a
major partner in keeping Nevada County’s crime rates low, while
working closely with the Sheriff, Probation Office and Superior Courts.
Comparison of Selected Crime Levels per 1000 residents, 2016
Type of Nevada Butte El Dorado Mendocino Placer Sutter Tehama Yuba
Crime County County County County County County County County
Violent 1.8 2.8 2.4 4.6 1.8 4.3 4.5 6.6
Property 1.3 2.3 1.5 2.2 1.6 2.2 2.8 2.6
Drug 1.1 1.9 0.7 2.2 0.9 0.7 2.9 2.1
Sex 0.1 0.1 0.1 0.2 0.1 0.4 0.3 0.4
Offense
Other 2.3 2.4 2.5 3.6 2.4 3.1 4.0 4.7
Felony
Total 6.6 9.5 7.2 12.9 6.7 10.7 14.4 16.5
State of California Department of Justice
13Superior Court
The Superior court consists of six judges and one commissioner. The
primary courthouse is located in Nevada City, with a branch in also 4th lowest in
located in Truckee. Both locations are full-jurisdiction courts that
process all case types. While the Court is an independent state entity, it jury trials than
works closely with County departments to provide civil and criminal comparison
justice services in our community. counties
County Jury Trials Judicial Criminal Civil
Positions Filings Filings
Nevada
Butte
15
52
8.3
13.8
19,942
25,378
1,180
3,361
3rd highest in
El Dorado 54 10.8 15,138 2,443 total criminal
Mendocino 19 8.6 15,473 1,341
Napa 64 8.5 14,814 1,746
filings versus
Placer 73 16.3 31,263 4,755 comparison
Sutter 3 5.7 12,617 1,333
Tehama 1 4.9 14,879 1,278
counties
Yuba 12 5.7 10,574 1,118
State Of California Courts nd
Ranked 2
Health and Wellness in Child
Support
Health and Human Service Collection for
Programs are often called “Safety
Net” Programs. Through
California
CalWORKs; CalFresh; Medi-Cal;
the Women, Infants and Children WIC ranked
(WIC) program; Adult Protective
Services, Child Protective Services, 6th in the
Child Support Services, individuals and families receive assistance
nation for
with basic needs such as food, housing, and medical care.
breastfeeding
Nevada County continues to be a low Public Assistance aided county
compared with most of its central valley and north state counterparts.
Due to the Affordable Care Act and less restrictive eligibility
requirements, most comparison counties show a marked increase in
85% of
Medi-Cal enrollment. Nevada County’s high performing Child
Foster toddlers
Support department helps to recoup some of the costs associated with are found
safety net programs, provides critical income to single-parent homes, permanent
and avoids the need to apply for services by ensuring both parents are homes
engaged in supporting the family.
14Housing and Land Use
County Square Population per Nevada County is a
Miles* Sq. Mile small, rural county thats
Nevada 958 104 population sits well
below the overall
15th smallest
Butte 1,636 140 county
El Dorado 1,708 111
California population
Mendocino 3,506 25
density of 251 people in California
per square mile.
Napa 748 188
Placer
Sutter
1,407
602
274
The assessed value of
161
958 square
Nevada County real
Tehama 2,949 22
estate increased from
miles of total
Yuba 632 122
$4.2 billion in 1997, to land
State of California Department of Finance a high of $16.6 billion
in 2016. Both assessed value per capita and average home value
have increased since the last recession, reflecting the rebound in 103
the real estate market. State law allows for temporary property residents per
tax reductions (Prop 8) when values decline, which spiked to a square mile
peak of 31% of all properties in the County in 2010.
Assessed Secured Property Values and Taxes
Year Total Assessed Assessed Value Property Tax Per % Parcels in Prop 8
Value ($Bill.) per Capita $ Capita $ Status
2012 15.0 154,420 1,859 26%
2013 14.8 152,744 1,801 26%
2014 14.9 153,833 1,871 23%
2015 15.7 160,103 1,940 23%
2016 16.6 168,735 2,049 20%
2017 17.3 175,480 2,131 18%
Nevada County CAFR /Nevada County Assessor
Nevada County - Types of Housing An estimated 60% of all housing is in the
County Total % of Total unincorporated area of the County. According to
Counting California Report (2000), 14% of housing
Single Family 44,808 84% units in Nevada County were second homes at that
Multi-Family 5,208 10% time, which continues to contribute to a lack of
Mobile Home 2,948 5% housing availability today. Second home ownership
Other Housing 225 1%
is especially prevalent in Truckee, a popular resort
Total 53,189 100%
community in the Tahoe region.
US Census – American Fact Finder
15Building Permits
The number of building permits issued by the county declined dramatically during the economic
downturn, mirroring state and nationwide trends. Total permits have recovered significantly since the
2009-2010 low.
2900 200
2700
New Residential Permits
2500 150
Total Permits
2300
100
2100
1900 50
1700
1500 0
10‐11
11‐12
12‐13
13‐14
14‐15
15‐16
16‐17
Total Permits New Residential Permits
Nevada County Building Department
Housing
March Total housing units is the
Total Owner
2018 Vacancy number of single-family and
County Housing Occupied
Median Rate multiple-family dwellings,
Units Units est.
Sales Price mobile homes, and other
Nevada 53,860 391,750 29,683 23.7% dwelling units situated within
Butte 99,404 247,000 50,031 12.3% a given jurisdiction. The total
El Dorado 90,315 455,000 49,861 24.0% number of housing units in
Mendocino 41,107 330,000 19,679 14.01% Nevada County was 53,860
units in 2017, with a March
Napa 55,847 632,000 29,678 9.44%
2018 median sales price of
Placer 163,918 448,000 94,966 13.43%
$391,750, which places
Tehama 27,525 197,500 16,008 12.08% Nevada County in the higher
Sutter 34,401 273,000 18,864 6.69% value range among
Yuba 28,606 243,000 14,593 13.17% comparison counties.
US Census
Comparing data over the last couple of years, foreclosures in Nevada County are trending lower,
indicating a slowdown in distressed properties entering the market. In 2015-16, foreclosures averaged
21 per month compared to 120 per month in 2012-13. In 2017-18, foreclosures are averaging less than
eight per month.
16Nevada County Broadband
Current broadband speeds and availability
% of Population
in the region still lag behind non-rural Statewide
County with Broadband
counties, but are equal to or above average Ranking
access*
in comparison to similar peer rural Nevada 99.3% 38
Northern California Sierra communities. Butte 99.7% 30
El Dorado 99.6% 34
As part of the Central Valley Next Mendocino 95.6% 51
Generation Broadband Initiative’s Napa 99.9% 24
“Middle Mile” project, a high-speed fiber Placer 99.9% 21
optic network was built across 18 Sutter 100% 9
California counties, including passing Tehama 99.7% 32
Yuba 100% 18
through western Nevada County. The National Broadband Map
network was installed in key County areas *Broadband is defined as download/upload speed >3 Mbs / >.7 Mbs
and the infrastructure will be used to
provide access in the greater community. Three community anchor institutions were initially
connected, including the Nevada County Library for patron use.
Utilizing a $15 million California Public utilities Commission grant, a local Internet Service Provider
is working to build a 1Gbs fiber network to homes and businesses in western Nevada County. The
Truckee area’s cable TV provider Suddenlink Communications announced plans to update their
infrastructure to offer 1Gbs broadband services. Donner Summit area residents can now receive
50Mbs Internet service. In addition to broadband, rural cellular data coverage is slowly expanding
with major local providers, Verizon, T-Mobile, Sprint, and AT&T, adding new towers and repeaters
over the past year. Several other new towers are currently being planned.
17Utilities
Nevada County ensures
the safe and reliable
Current
disposal of solid waste diversion rate
and recycling through a of trash to
contract with Waste recycling at
Management for
Western Nevada County 53%
and Tahoe Truckee
Sierra Disposal for
Eastern Nevada County.
Average of
Nevada County’s current diversion rate is at 53%. The McCourtney
Road Transfer Station, operated by Waste Management, takes multiple
3lbs of
types of recyclables and waste including commingled recycling, garbage per
construction and demolition, tires, used oil filters, batteries, resident per
appliances, household hazardous waste, Rx medications, and e-waste.
day
Nevada County Solid Waste maintains an interactive Recycling
Facilities maps and a McCourtney Transfer Station Traffic Camera on
the County’s website so residents can easily find out where they can
recycle their varying recyclables and avoid high traffic times at the
transfer station.
2 contracted
County % Pop. Recycling Recycling
service
w/Treated Target* Actual* providers
Wastewater for solid waste
Nevada City 99% 11.7 6.7
& recycling
Grass Valley 100% 7.2 4.4
Truckee 91% 10.7 4.0
Unincorporated 19% 3.0 3.3
*recycling is pounds per day per person
Nevada County, Grass Valley, Nevada City and Truckee departments of Public Works 3 wastewater
treatment
The Sanitation District provides wastewater treatment in the plants in un‐
unincorporated areas of western Nevada County. Currently the
incorporated
majority of the outlying unincorporated areas rely on private septic
wastewater treatment systems. A regionalization project has been
Nevada
completed which expanded wastewater treatment to the Penn Valley County
are.
18Agriculture
117%
increase in
wine grape
crop values in
2016
13%
decrease in
livestock
The gross value of Nevada County’s agricultural production for 2016 value due
was $20,877,900, down 2.75% from the 2015 value. The livestock
industry experienced a 13% decrease in value in 2016, mainly due to a
to low
15% decrease in total cattle prices. Timber products saw a 23% cattle prices
decrease in value in 2016, due to the timber harvesting in surrounding
counties monopolizing the industry. However, both fruit and vegetable
crop experienced significant increases. Wine grape values increased
117% in 2016, while fruit and vegetable crops had a 14% increase.
Top 6 Agricultural Crops
Apiary, Eggs and Wool Products
Nursery and Flower Stock 2015 Total = $22,013,600
2016 Total = $20,877,900
Fruit and Nut
Vegetable
Timber
Pasture/Rangeland
Livestock and Poultry
Nevada County Agricultural Commissioner 2016 Crop Report
19Transportation in and around Nevada County includes highway, rail,
Transportation
air, bus, and increasingly, cycling and pedestrian. In 2015-16, the
Nevada County Department of Public Works prepared and chip 1,099 miles
sealed over 18 miles of roadways and brushed 79 miles in the of roads and
Vegetation Control Program. highways
A recent report on California road conditions ranked Nevada County
third in the state in terms of pavement condition. Nevada County has
significantly better pavement conditions than other rural counties in 1 of 4
the State. This is partly due to the value the Nevada County Board California
of Supervisors places on road maintenance, supported by an annual counties with
General Fund allocation of approximately $1.65 million. This
‘good’
funding stream has allowed Nevada County to be one of the few to
maintain good pavement condition despite the recession. pavement
condition
Highway Safety Data
SB1 funding
Roadways in Nevada County
would
Vehicle Fatal and
Fatal & Injury
Miles Injury
contribute
County Accidents
Travelled Accidents/
2015
(Millions) VMT $47.5M to
Nevada 607 3.2 1.9 County road
Butte 1,180 4.7 2.5
El Dorado 832 4.5 1.9
repairs
Mendocino 654 3.4 1.9
Napa 1,063 3.3 3.2
Placer
Sutter
1,446
773
10.1
2.4
1.4
3.2
2nd lowest
Tehama 422 2.6 1.6 injury and fatal
Yuba 448 1.9 2.4 vehicle
California Office of Traffic Safety, California Highway Patrol
accidents of
Nevada County’s current highway safety statistics remain normal comparison
although they typically vary in fluctuation from year to year. Due to
the small numbers involved, a few accidents can skew the fatality counties
rate drastically. Nevada County has over 17,000 commuters coming
in and going out of the County for work. The top destination out for
work is Placer County (6,170), followed by Sacramento County
(1,732), and Washoe County, Nevada (844). Commute times range
4th lowest in
from 30 minutes to Placer, 2 hours to Washoe, and up to 3.75 hours vehicle miles
to parts of the Sacramento Valley. of comparison
counties
20Working and Doing Business
Commuting has an economic impact on the community because
residents may be spending time and money in other locations rather
than locally, affecting both family life and local business activity. 11,000
commuters
Nevada County leave Nevada
Commute Times
Commuters Out/In for Work (Hrs) County for
Other 1,111 1,073 Various
Bay Area 810 152 2.50 work
Sac. Valley 230 104 3.75
Yuba 507 476 .75
Washoe 844 1,426
Sacramento 1,732 677
2.00
1.00 6,000
Placer 6,170 2,073 .50 Commuters
‐ 1,000 2,000 3,000 4,000 5,000 6,000 7,000 8,000 9,000
coming in to
Out Commute In Commute Nevada
US Census County for
Income and Sales work
Of the eight comparison counties, Nevada County ranks fourth in per
capita income, third in median household income, and fifth in 4th
taxable sales per capita. These numbers are impacted by the sales tax in per capita
outflow the county experiences as consumers are drawn to the more
income of
urban surrounding counties for many shopping needs.
comparison
Per Median
Total counties
Taxable Taxable Sales per
County Capita Household
Sales Capita
Income Income
Nevada 32,442 56,521
($Bill.)
1.3 13,042 3rd in median
Butte 24,259 43,444 3.1 13,969 household
El Dorado 35,588 69,584 2 11,304
Mendocino 24,059 42,980 1.4 15,746 income of
Napa 36,475 71,379 3.3 23,566 comparison
Placer 36,022 73,948 8.7 23,684
Sutter 23,689 52,017 1.6 17,038 counties
Tehama 21,263 41,001 0.8 12,353
Yuba 20,471 46,892 0.5 6,783
US Census
5th in sales
per capita of
comparison
counties
21Employment and Unemployment
Employment by sector paints a picture
% of economic health by industry in the
Industry # Employed
Employed County overall. The Service-Providing
sector leads in the number of people
Education and Health employed (60.6%), followed by
5,510 17.7%
Services
Government (19.7%), and Goods
Retail Trade 3,980 12.8%
Producing (13.7%) sectors. Average
Leisure and Hospitality 4,520 14.5% weekly wages range from $382 in
Natural Resources, Mining, Leisure and Hospitality to $1,245 in
9.4%
and Construction 2,920
Federal Government. This year, the
Professional and Business
2,220 7.1% number of jobs increased from 28,862
Services
Manufacturing 1,420 4.5% to 31,380. The increase of jobs in the
service-providing and government
Financial Activities 1,310 4.2%
industries led to a slight .8% increase in
Other Services 2,130 6.8% the Average Weekly Wage.
Transportation,
480 1.5%
Warehousing, and Utilities Nevada County’s vibrant community,
Wholesale Trade 390 1.2% abundant natural beauty, location and
Information 290 0.9%
natural resources provide a competitive
advantage for employee attraction.
Farming 60 0.2%
Nevada County’s top businesses
Government 5,980 19.2% include technology, ski-resort and other
Total 31,210 100.0% lodgings, grocery stores, schools, and
State of California Employment Development Department, Annual 2016 other service providers.
Nevada County ‐ Number of Establishments by Industry
Service Providing 2,749
Education & Hlth Svc 794
Goods Producing 647
Trade, Transport, Utilities 462 Total = 6,008 Establishments
Professional & Business Svc 476
Construction 485
Leisure & Hospitality 279
Local Gov't 116
‐ 500 1,000 1,500 2,000 2,500 3,000
CA Employment Development Department, Quarterly Census of Employment and Wages, Annual 2016
22Unemployment is the estimated number of people who are actively
3rd lowest in
seeking work and are not working at least one hour per week for pay,
and who are not self-employed. The rate of unemployment reached its
peak in 2010 and has steadily declined as the economy rebounds. unemployment
of
comparison
Unemployment Rates counties
8.0% 7.3%
7.0% 6.3%
6.0%
5.0% 4.4%
5.2%
1,800
3.7% 3.8%
4.0% 3.2% 3.2% unemployed
3.0%
workers in
2.0%
1.0% March 2018
0.0%
CA EDD, Labor Market Information, Unemployment, March 2018
3.7%
Unemployment in 2017 is lower than the 4.8% unemployment rate unemployment
before the recession in 2005, and also a decrease from the 2016 rate of rate in March
5.1%. Nevada County’s unemployment rate tends to be below the rate 2018
for the Sacramento Region, and has been consistently lower than the
California average since 1990, while generally following statewide
trends. Nevada County ranks third lowest in unemployment among the
comparison counties.
66.7% of
residents are
employed in
Unemployment
14% Service‐
12% Providing
10%
sector
8%
6%
4%
2%
0%
31,210
1990 2000 2005 2010 2011 2012 2013 2014 2015 2016 2017 Q1 jobs in
Nevada County Sacramento Region State 2018
Nevada
CA EDD, Labor Market Information, Unemployment Rates
County
23You can also read