Genetic characterization of Cape gooseberry (Physalis peruviana L.) accessions in selected counties in Kenya using SSR markers
←
→
Page content transcription
If your browser does not render page correctly, please read the page content below
Vol. 15(1), pp. 28-38, January 2021
  DOI: 10.5897/AJPS2020.2077
  Article Number: 91E94B565901
  ISSN 1996-0824
  Copyright © 2021
  Author(s) retain the copyright of this article                                 African Journal of Plant Science
  http://www.academicjournals.org/AJPS

Full Length Research Paper

 Genetic characterization of Cape gooseberry (Physalis
 peruviana L.) accessions in selected counties in Kenya
                   using SSR markers
     Pauline W. Muraguri1*, Robert M. Gesimba1, Joseph N. Wolukau1 and Manfred Miheso2
         1
          Department of Crops, Horticulture and Soils, Egerton University, P. O. Box 536-20115 Egerton, Kenya.
        2
         Kenya Agricultural and Livestock Research Organization - Food Crops Research Institute, Njoro, Kenya.
                                         Received 12 October, 2020; Accepted 4 December, 2020

    Cape gooseberry (Physalis peruviana L.) is a neglected high potential crop, knowledge of the genetic
    diversity of the genotypes domesticated in Kenya is limited. To understand the genetic diversity and
    structure within and between Cape gooseberry germplasm, 70 accessions from six selected counties
    were analyzed using 15 pairs of highly polymorphic SSR primers. In this study, a total of 61
    polymorphic SSR alleles were identified with mean polymorphic information content (PIC) of 0.43.
    Analysis of Molecular Variance (AMOVA) revealed that 92.8% of the total genetic variation was within
    accessions whereas variation among accessions accounted for 7.2% of the total genetic variation.
    Genetic diversity parameters among the 70 accessions revealed that Cape gooseberry was more
    diverse than previously recorded. Based on the SSR data, the 70 accessions were classified into five
    main phylogenetic groups, which corresponded to the county of origin through factorial analysis,
    principal component analysis (PCA), and phylogenetic analysis. Seven core SSR primer pairs, namely
    SSR1, SSR2, SSR10, SSR11, SSR123, SSR138, and SSR146 were found to have a wide applicability in
    genotype identification of cape gooseberry, and thus they are recommended for use in genetic
    characterization of germplasm collected from other counties not covered by the present study. This
    study demonstrated the existence of considerable genetic diversity in Cape gooseberry accessions
    growing in selected counties in Kenya and can therefore be used as a basis for future breeding
    programs in the development of hybrids with desirable traits. This wider genetic diversity is vital for
    posterity as it will help cope with unpredictable climatic changes and human needs.

    Key words: Simple sequence repeats (SSRs), genetic diversity, germplasm, Physalis peruviana L.,
    polymorphic information content (PIC).

INTRODUCTION

Physalis peruviana L. is a species from the family                   Cape gooseberry, ground cherry, Cape gooseberry, or
Solanaceae and genus Physalis, commonly known as                     winter cherry. It contains high amounts of vitamins (A, B,

*Corresponding author. E-mail: pauline.wanjiru65@gmail.com.

Author(s) agree that this article remain permanently open access under the terms of the Creative Commons Attribution
License 4.0 International License
Muraguri et al. 29
and C), micronutrients (iron, phosphorous, and calcium), The average yields of Cape gooseberry are still below the
has anti-inflammatory, antioxidant, and anti-hepatotoxic maximum potential mainly due to fruit cracking, small
activities (Wu et al., 2009). The vitamin C content in this fruits, and premature fruit drop (Ali and Singh, 2016).
fruit is reported to be the highest among all other fruits Also, the poor quality of fruits in some cultivars in terms
and plants, thus its reference as a “super fruit”, Cape of the levels of total soluble solids (TSS) and total
gooseberry contain up to twenty times vitamin C as that titratable acidity (TTA) make them unattractive for large
found in oranges (Villacorta and Shaw, 2013). Owing to scale agriculture (Herrera et al., 2011). No improved
such concentrated levels of nutrients in this fruit, cultivars have been developed yet although Leiva-Brondo
Villacorta and Shaw (2013) posit that it is useful for et al., (2001) reported to have used a simple breeding
medicinal purposes in restoring vitality and boosting strategy employed in other Solanaceae crops to develop
immunity by fortifying the liver, supporting cardiovascular hybrids with superior yield characteristics by exploiting
activity, strengthening lungs, and enhancing fertility and heterosis. Genetic diversity is important in this context as
food absorption. it serves as the reservoir of many novel traits related to
Investigation of genetic diversity in both wild and yield, quality as well as tolerance to abiotic and biotic
domesticated species is essential. Assessment of stresses. A thorough understanding of the diversity in the
available genetic diversity is a preliminary stage in Cape gooseberry genome is necessary before
genetic improvement in crop plants (Bhandari et al., implementation of any breeding program in breaking
2017). Wild populations of different crop species are these yield and quality barriers. The objective of this
known to be a potential source of useful genes and traits study was to determine the genetic diversity of Cape
which could be introduced into the domesticated gene gooseberry genotypes in Kenya using SSR markers for
pool (Campisano et al., 2015). There are various ways in use in present and future breeding schemes and
which diversity analysis can be carried out including conservation programs. This information will contribute to
cytological, morphological, biochemical, and molecular understanding the genetic relationship between and
approaches. With the advent of genomic tools, within different genotypes and provide basic information
assessment of genetic diversity at the molecular level has on parental selection for Cape gooseberry breeding
proven to be more useful as compared to that at the material.
phenotypic level because the latter entails analysis of
data on morphological traits, which are generally
influenced by environments (Myers et al., 2000). Different MATERIALS AND METHODS
molecular marker systems have been proved to be
Experimental materials
valuable tools in assessing the genetic diversity of plants
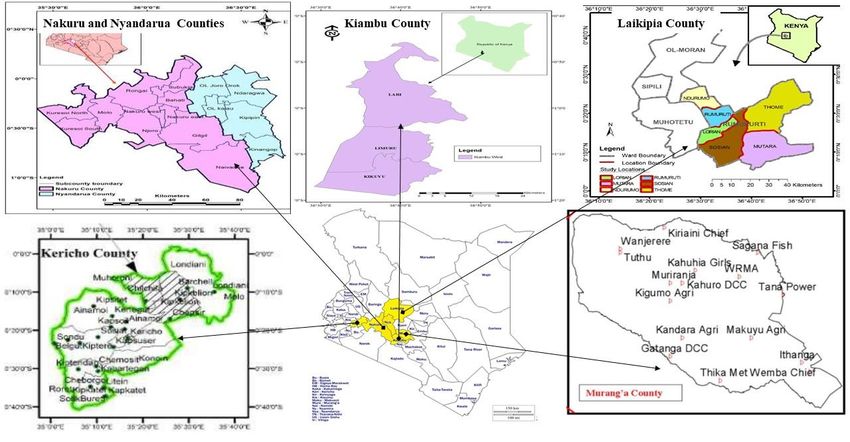
between and within species regardless of environmental Seventy dry leaf samples were collected from accessions of Cape
interferences on the phenotype (Demir et al., 2010). gooseberry collected from six selected counties of Kenya (Figure
Research has shown that different markers reveal 1). The counties selected were Kiambu (1.0314°S, 36.8681°E),
different classes of variation (Virk et al., 2000). Simple Muranga (0.7839°S, 37.0400°E), Kericho (0.1828ºS, 35.4782°E),
Sequence Repeat (SSR) markers have become the Nakuru (1.3665°S, 35.3905°E), Nyandarua (0.1804°S, 36.5230°E),
and Laikipia (0.3606°N, 37.7820°E). The six counties were selected
marker of choice for many researchers as they offer
because they have Cape gooseberry germplasm. The experiments
many advantages including technical simplicity, feasibility were carried out during the rainy season in May 2019. The young
of automation, even distribution throughout the genome, leaves were sampled because they yield DNA better and have low
higher frequency of polymorphism, rapidity, requirement concentrations of phytates which contaminate DNA. The samples
of little and not necessarily high-quality DNA, and no were stored on Silica gel (Loba Chemie). The samples were coded
requirement of prior information of any DNA sequence based on the county. For instance, a collection was done at
Nyandarua County, Olkalou district, Kipipiri division, Miharati
(Mason, 2015). Molecular marker analysis work would be location, Mara village and was the seventh Cape gooseberry crop
of great help for analyzing genetic diversity, and to be sampled; the code assigned was NYD/OLK/KIP/MHT/MAR/07.
exploiting genetic resources for identification, isolation,
conservation, and utilization (Ravi et al., 2010).
The availability of enough food to meet 95% of the DNA extraction and quantification
world’s requirements is dependent on only a few crop
Total nucleic acid was extracted from the dry young leaf tissue that
species which are widely and intensively cultivated crops. had been stored in silica gel for one month using a modified CTAB
These have been developed by extensive selection from protocol (Porebski et al., 1997). Modifications involved the
available large agro-biodiversity pool (Ochatt and Jain, introduction of the initial wash stage using 2-Mercaptoethanol to
2007). There is a great need to expand the exploitation of remove the aromatic compounds and phytates. Centrifugation time
the plant genetic diversity that would broaden the crop for initial stages was also increased to 10 min to ensure that cell
diversity for food supply to feed the ever-growing human debris and the proteins were well decanted to minimize
contamination. Final centrifugation time was reduced to 3 min while
population and avoid dependence on few food crops. centrifugation speed was increased to 14000rpm to avoid pelleting
Wild relatives and neglected crops could become an of carry over impurities. Precipitation time was also increased from
excellent source of useful gene pool. the recommended time of 2 to 18 h to increase DNA precipitation30 Afr. J. Plant Sci.
Figure 1. Map showing Cape gooseberry germplasm occurrence in six selected counties in Kenya.
and recovery. Polymerase chain reaction (PCR) was done in a 2720, 96 universal
Nanodrop spectrophotometer (Applied Biosystems) and agarose gradient thermocycler (Applied Biosystems) in 20 µl final volume
gel electrophoresis assays were used to determine the purity and containing 10±20 ng DNA template, 5.0 pmol forward and reverse
concentration of DNA in the samples. Nanodrop spectrophotometry primers, 1x PCR buffer, 2.5mM of each dNTPs, 1.5 mM MgCl and
involved reading the concentration of DNA from the absorbance of 0.5 U of Taq DNA polymerase (Biolabs). The amplification
the sample at 260 nm (1OD (A260) = 50 µg for doubled stranded conditions for PCR profile were: 95°C for 5 min, 35 cycles of 95°C
DNA/µl). The purity of the DNA sample was determined by for 30 s, specific annealing temperature for each SSR for 1 min,
A260/A280 ratio (1.6±1.8 for pure DNA). Agarose gel extension at 72°C for 2 min, and final extension at 72°C for 10 min.
electrophoresis quantification involved resolving the samples in The PCR amplicons were run in a 1.8% agarose gel containing
agarose gel 0.8% (0.8g agarose and 100ml Sodium Borate) ethidium bromide staining dye at a voltage of 80 volts and a current
containing 3ul ethidium bromide staining dye at voltage of 100 volts of 400 mA for 1 h and visualized in a UV transilluminator (Applied
and 400 mA current for 30 min. The DNA was visualized on a UV Biosystems).
transilluminator (Applied Biosystems).
Data analysis
Selection and genotyping of SSR markers SSR marker alleles were scored manually from the gel images
using a simple numerical scoring method. When the expected band
A set of 15 SSR markers selected from earlier published reports was present it was scored as 1 while 0 was used to code for
(Table 1) were used to determine the diversity of Cape gooseberry absence. Number of alleles, observed heterozygosity (HO) and
collections. The SSR markers were selected based on high expected heterozygosity (HE), Shannon's diversity index (I), gene
polymorphic information content (PIC) values (>0.4) in earlier flow (Nm), and gene differentiation coefficient (FST) executed in
published studies; the maximum number of alleles detected, POPGENE Version 1.32 (Yeh et al., 2000) were used to determine
genome coverage, and distribution on linkage groups. The primers genetic diversity. Chi-squared was used to determine Hardy -
for the SSR markers were synthesized on contract from Inqaba Weinberg equilibrium (HWE) while genetic diversity and polymorphic
Biotech in South Africa and genotyping of the SSR markers was information content (PIC) were computed in Power Marker 3.25 (Liu
carried out at Marker Assisted Breeding Laboratory at Kenya and Muse, 2005).
Agricultural and Livestock Research Organization (KALRO) Njoro Unweighted Pair Group with Arithmetic Mean (UPGMA) algorithm
Center. was used to construct an unrooted phylogram from a distanceMuraguri et al. 31
Table 1. Selected SSR markers used in the study.
Range of Amplicon Repeat
Marker Forward primer TM Location
observed bands Size (Bp) type
SSR1F AGAGGACTCCATTTGTTTGCT
50 170 210 206 AT 39 UTR
SSR1R TGAGGGTGTTGGATGTTTTCT
SSR2F CATTGGGTTTCGCATCCAT
50 230 250 237 AG 39 UTR
SSR2 R AGACAAGCCTAGGGGAAAGG
SSR10F GCTTCCTATTGTGTTGCCTGA
50 220 240 185 AG 59 UTR
SSR10R ACTTTGGGTTTCGGGAATTG
SSR 11F CAGCTGAAATAAGAGAGTGATTGG
50 170 190 180 AT 39 UTR
SSR11R CCCTCTTTTTCTCCTCCGAGT
SSR15F GCTTGTTGATCAGCTTTCTTTG
50 180 210 172 AG 39 UTR
SSR15R TGGATCATAACCTTGCTAATGC
SSR54F CGGCTGGTATGCTTACAAAGAT
50 160 210 197 AC 59 UTR
SSR54R GCACTTCCACTGTTTTTAACTTCC
SSR72F GTGCTCGCAGTTTCTTCAAA
50 200 220 158 AT 39 UTR
SSR72R CCGCCGTTACTTCCTAATCA
SSR77F CATACCATAACTCCCCATCTCTC
50 160 180 216 AT 39 UTR
SSR77R TGCCGATTCTGATTTCTTCC
SSR112F CTACGCCTACCACTTGCACA
50 180 230 203 AC 39 UTR
SSR112R CAGTGGAAGCCTCAAGATCC
SSR118F AATCAAGGGTCAGAAGAAATGG
50 170 220 180 AT 39 UTR
SSR118R GCAAGAATGGATGTGGGTGT
SSR121F AGCAACCTCCCAATCAGCTA
52 170 240 170 AG 39 UTR
SSR121R TGGTGAGTAAATGGGGGAAA
SSR123F TCAGTGGAGCGCGTATATCT
50 260 330 216 AG 39 UTR
SSR123R GCGATCTCACCAAACCTCTC
SSR126F TCCAAAAAGAAAACAAAAACACT
50 190 210 202 AC 39 UTR
SSR126R TTGAATGCATGTTTGATGGA
SSR138F TCCGATCACTACTTCAGCACG
50 200 210 138 AG 59 UTR
SSR138R CAATTCGGGTTGTGAATCGGGT
SSR146F AGGCTAATGAGGACGAAGCA
50 200 210 187 AT 39 UTR
SSR146R GGTTGCATTACAAAGCACTGA
matrix based on Nei's (1973 and 1978) genetic distances, using (Nakuru, Laikipia, Nyandarua, Kericho, Murang’a, and
Darwin 6.0 software (Perrier and Jacquemoud-Collet, 2006) and Kiambu) by 15 SSR primer pairs. The 15 primer pairs
Power Marker 3.25 (Liu and Muse, 2005).
amplified a total of 71 polymorphic SSR alleles (Plate 2b).
Every primer pair was able to amplify varying the number
of SSR alleles ranging from 100 to 300 bp from all
RESULTS AND DISCUSSION
accessions tested, regardless of the county of origin.
DNA extraction and PCR
Marker polymorphism and genetic diversity of Cape
All the samples yielded good quality and quantity of DNA gooseberry accessions
to enable genotyping (Plate 1). Genotyping of markers
resulted in the amplification of expected regions resulting The number of major alleles per primer ranged between 2
in single or multiple bands (Plate 2a). Minimal (SSR54, SSR15, SSR72, SSR77, SSR112, and SSR
contamination of samples by proteins and phenolic 126) and 11(SSR 2). A total of 61 alleles were detected
compounds was observed in this study. by the 15 primers with a mean of 4.07(Table 2). Allele
This study evaluated the genetic diversity and frequency ranged between 0.26 and 0.96 with a mean of
population structure of 70 accessions of Cape gooseberry 0.64. The number of observed alleles was 2 for all
that originated from six selected counties of Kenya markers while the number of effective alleles ranged32 Afr. J. Plant Sci.
111 222 333 44 55 66 77 88 999 10
10 11
10 11 12
11 12 13
12 13 14
13 14 15
14 15 16
15 16 17
16 17 18
17 18
18
19
19
19
19
19 20
19 20 21
20 21 22
21 22 23
22 23 24
24 25
25 26 27
26 27 28
27 28 29
28 29 30
29 30 31
30 31 32
31 32 33
32 33 34
33 34 35
34 35 36
35 36 37
36 37 38
37 38
38
.
Plate 1. Representative quantification gel image of cape gooseberry accessions.
Plate 1:
Plate
Plate 1: Representative
1: Representative quantification
Representative quantification
quantification gel
gel image
gel imageof
image ofcape
of capegooseberry
cape gooseberryaccessions
gooseberry accessions
accessions
LLL 111 222 33 44 55 66 77 888 999 10
10 11 12
10 11
11 12
13 14
12 13
13 14
15 16
14 15
15 16
17 18
16 17
17 18
19
18 19
19
Plate 2a. Representative PCR image of single bands of the cape gooseberry accessions.
Plate 2.a: Representative
Plate Representative PCR image of single bands of the cape gooseberry accessions
Plate 2.a:
2.a: Representative PCR
PCR image
image of
of single
single bands
bands of
of the
the cape
cape gooseberry
gooseberry accessions
accessions
LLL 111 222 333 444 555 666 77 88 99 10
7 8 9 10
11 12
10 11
11 12
13 14
12 13
13 14
15 16
14 15
15 16
17 18
16 17
17 18
19
18 19
19
Plate 2.b: Representative PCR images of multiple bands of varied sizes of cape gooseberry
Plate 2b. Representative PCR images of multiple bands of varied sizes of Cape gooseberry accessions.
Plate
Plate 2.b:
2.b: Representative
Representative PCRPCR images
images of
of multiple
multiple bands
bands ofof varied
varied sizes
sizes of
of cape
cape gooseberry
gooseberry
accessions
accessions
accessions
between 1.10 (SSR112) and 2.00 (SSR1) with a mean of while the mean polymorphic content was 0.432 (Table 2).
1.28 (Table 2). The lowest gene diversity was observed The average PIC for the entire population (0.432)
for SSR112 (0.08) while the highest was 0.82 for SSR1. classifies the markers used in this study within the range
All the markers used in the study were polymorphic, of loci with intermediate polymorphism (0.25 to 0.5)
SSR1 was the most polymorphic marker (PIC = 0.77) according to Ge et al., (2013). The calculated Shannon's
while SSR112 was the least polymorphic (PIC = 0.079) Information indices averaged at 0.25 and ranged betweenMuraguri et al. 33
Table 2. Summary statistics of Marker polymorphism and genetic diversity indices of cape gooseberry accessions.
Locus Sample size Allele No. MAF *Na *Ne H* I* PIC Ht Hs Fst Nm
SSR1 70 7 0.257 2.00 1.9984 0.4996 0.6927 0.793 0.4994 0.0300 0.9399 0.0320
SSR2 70 11 0.386 2.00 1.9935 0.4984 0.6915 0.758 0.4996 0.1214 0.7571 0.1604
SSR10 70 7 0.271 2.00 1.9600 0.4898 0.6829 0.78 0.4983 0.0537 0.8923 0.0604
SSR11 70 6 0.471 2.00 1.9935 0.4984 0.6915 0.662 0.3533 0.0781 0.7789 0.1420
SSR15 70 2 0.814 2.00 1.4336 0.3024 0.4799 0.257 0.2778 0.0000 1.0000 0.0000
SSR54 70 2 0.557 2.00 1.9742 0.4935 0.6866 0.371 0.4941 0.1769 0.6419 0.2789
SSR72 70 2 0.771 2.00 1.5448 0.3527 0.5375 0.291 0.3394 0.0700 0.7938 0.1299
SSR77 70 2 0.771 2.00 1.5448 0.3527 0.5375 0.291 0.3394 0.0700 0.7938 0.1299
SSR112 70 2 0.957 2.00 1.0894 0.0820 0.1769 0.079 0.0740 0.0592 0.2000 2.0000
SSR118 70 3 0.857 2.00 1.3243 0.2449 0.4101 0.239 0.3193 0.0586 0.8166 0.1123
SSR121 70 3 0.657 2.00 1.6897 0.4082 0.5983 0.409 0.4362 0.0221 0.9493 0.0267
SSR123 70 4 0.771 2.00 1.4706 0.3200 0.5004 0.356 0.3333 0.0773 0.7682 0.1509
SSR126 70 2 0.871 2.00 1.2888 0.2241 0.3837 0.199 0.3084 0.0408 0.8676 0.0763
SSR138 70 4 0.714 2.00 1.5817 0.3678 0.5544 0.426 0.4220 0.1322 0.6867 0.2281
SSR146 70 4 0.529 2.00 1.5817 0.3678 0.5544 0.583 0.3288 0.1449 0.5592 0.3941
Mean 70 61 0.257 1.51 1.2673 0.3668 0.2464 0.432 0.4083 0.1089 0.7333 0.1818
St. Dev 0.50 0.3479 0.1877 0.2709 0.1721 0.0321
Na = Observed number of alleles, Ne = Effective number of alleles (Kimura and Crow, 1964), H* = Nei's (1973) gene diversity, I* = Shannon's Information index (Lewontin, 1972) MAF = Major
allele frequency, PIC = polymorphic information content, Ht = genetic distance for the among populations, Hs = genetic distance within the population and Gst = degree of differentiation among
populations and Nm = estimate of gene flow from Gstor Gcs. E.g., Nm = 0.5(1 - Gst)/Gst; (McDermott and McDonald, 1993).
0.1769 (SSR1) and 0.6927 (SSR112) (Table 2). (2002) which posit that in most plants the SSR loci studies.
Seven SSR primer pairs (SSR1, SSR2, SSR10, are found along the UTR’s and may have
SSR11, SSR123, SSR138, and SSR146) accounted for the markers with low PIC because Population structure of Cape gooseberry
produced more than five alleles among the 70 SSRs found in untranslated regions have been accessions
Cape gooseberry accessions. The seven SSR reported to be less polymorphic than genomic
primer pairs would have a priority of choice in markers (Ellis and Burke, 2007). The 61 Genetic distances between gooseberry
evaluating cape gooseberry because they were polymorphic SSR alleles detected in this study accessions within counties
more informative in their ability to segregate were higher than the 6 alleles reported by Chacón
between the accessions and had PIC values et al. (2016) and the 30 polymorphic alleles Plant breeding applications such as germplasm
above 0.4. The highest number of SSR loci reported by Simbaqueba et al. (2011). These collections, selection of parental materials,
detected in this study contained dinucleotide (two differences may be due to different accessions identification of quantitative trait loci, linkage, and
nucleotide units) and hendecanucleotide (eleven used in previous studies or the stringency of association mapping are dependent on previous
nucleotide units) repeats characteristic of markers scoring. The differences could also be due to the genetic diversity information (Rao and Hodgkin,
located along untranslated regions (UTR). This is relatively narrow genetic base of commercial 2002; Zhu et al., 2008; Rauf et al., 2010). In this
in line with the hypothesis by Morgante et al. Cape gooseberry varieties used in the previous study, the application of SSR markers on the34 Afr. J. Plant Sci.
Table 3. Average genetic distances of cape gooseberry accessions within counties.
County Ho He Mean Fst HWE
Nakuru 0.500 0.1021 0.0031
Nyandarua 0.456 0.0832 0.1778
Kericho 0.488 0.1018 0.0076
Kiambu 0.394 0.0973 0.0668
Murang’a 0.384 0.0968 0.0662
Laikipia 0.277 0.0375 0.5874
HWE - - - 70.00
Ho = Observed heterozygosity, He = Expected heterozygosity, Fst = gene differentiation
coefficient, HWE = Hardy Weinberg equilibrium as calculated from Chi square.
Table 4. Genetic diversity of cape gooseberry accessions between counties.
County Nakuru Nyandarua Kericho Kiambu Murang’a Laikipia
Nakuru 0.000
Nyandarua 0.0007
Kericho 0.0000 0.0007
Kiambu 0.0001 0.0008 0.0001
Murang’a 0.0001 0.0003 0.0001 0.0003
Laikipia 0.0067 0.0048 0.0066 0.0063 0.0061
whole collection of P. peruviana from six selected Kenyan Cape gooseberry cultivars have no history of
counties of Kenya revealed a moderate to high genetic domestication. Lagos et al. (2008) reported that P.
diversity. Average distances between individuals in the peruviana is more than 53% outcrossing and its
same cluster (expected heterozygosity) ranged from 0.03 domestication from the wild did not involve a long
in Laikipia county to 0.102 in Nakuru county indicating process as compared to fruit-bearing relatives such as
that Cape gooseberry accessions in Nakuru county have tomato (Labate et al., 2009; Sim et al., 2012). It is
higher genetic diversity than those in Laikipia county. therefore probable that natural selection is still an
Genetic distance value recorded in this study important factor in retaining heterogeneous populations
(He=0.3668) is higher than those reported by Bonilla et with broad genetic adaptability and variability (Rauf et al.,
al. (2008) (He = 0.2559) and lower than those reported by 2010).
Garzón-Martínez et al. (2015) (He = 0.40). However, it is
noteworthy that Bonilla et al. (2008) used RAM markers
which are dominant in nature and therefore have the Genetic distances of Cape gooseberry accessions
inherent limitation of underestimating allelic diversity as among the six selected counties
compared to the co-dominant SSR markers used in this
study; while Garzón-Martínez et al. (2015) used genomic For this study, the allele frequency of Cape gooseberry
SNP markers which have a higher resolution than SSR between counties was significantly lower than diversity
markers. within the counties (Table 4). Allele-frequency divergence
Mean fixation index (FST) ranged between 0.003 and among counties was the highest between Laikipia and
0.58 for Nakuru and Laikipia respectively. Cape Nakuru (0.0067) and the lowest between Kericho and
gooseberry accessions in Nakuru and Kericho counties Nakuru (0.00). Overall there was a very small allele
exhibited insignificant genetic differentiation (Fst < 0.05) divergence observed in Cape gooseberry across counties.
indicating that the accessions in the two counties are This shows that the gooseberry accessions from the
interbreeding freely. Cape gooseberry accessions in selected counties share most of the alleles evaluated,
Nyandarua, Kiambu, Murang’a, and Laikipia showed and this is an indicator of low geographic differentiation
significant genetic differentiation (Fst < 0.05). This great among these accessions. The findings of this study show
genetic differentiation is a sign of geographic isolation that the population showed a slight deviation from the
and a high inbreeding rate (Table 3). Overall, genetic Hardy Weinberg equilibrium (HWE = 0.7). This may be
differentiation reported in the present study is very high due to the significant effects of natural selection resulting
(Fst = 0.7333). This may be attributed to the fact that from the limited domestication of Cape gooseberryMuraguri et al. 35
Table 5. Analysis of molecular variance (AMOVA) for the 70 cape gooseberry accessions from 6 select
counties of Kenya.
Source SS Df MS F Prob > F
Between accessions 10.36 5 2.07 92.80 0.0000
Within acce 1.429 64 0.02 7.20
Total 11.79 69 0.17
SS = sum of squares, MS= expected mean squares, F = F-statistics, >F = Significance level.
Table 6. Factorial analysis of the Gooseberry accessions from the five select counties.
County Axis 1 Axis 2 Axis 3 Axis 4 Axis 5
Nakuru 31.906 40.492 1.271 2.584 0.641
Nyandarua 0.116 0.010 0.062 0.113 -0.048
Kericho 0.038 0.098 0.101 -0.100 -0.014
Kiambu -0.056 0.099 0.034 0.034 0.041
Murang’a -0.063 0.047 -0.128 0.008 -0.010
Laikipia -0.227 -0.212 0.083 -0.007 -0.016
Proportion of Variance 31.714 40.533 1.422 2.632 0.592
Cumulative variance 31.714 72.247 73.67 76.303 76.89
Eigen values 0.013 0.012 0.008 0.005 0.002
% Inertia 27.74 26.27 17.62 10.35 4.37
collections in Kenya. This value is slightly higher than in this county (Table 6).
those reported by Tian et al. (2008) (HWE = 0.5481) The high percentage of variation explained by the first
though Tian’s study used cultivated varieties which may three components in the factorial analysis shows that the
have higher domestication influence. Partitioning of the differentiation of most of the individuals was well
genetic variation of the Cape gooseberry accessions was captured. However, it is noteworthy to consider the use of
done using Analysis of Molecular Variance (AMOVA) to a larger number of high-resolution markers and platforms
determine whether variation observed between the such as SNPs and genotyping by sequencing (GBS) due
accessions was due to genetic makeup or microclimatic to the outcrossing nature of the species (Zhu et al.,
factors. A total of 92.80% of the variation was found 2008).
among the accessions while a total of 7.20% of the Factorial analysis grouped the accessions into five
variation was revealed within the accessions (Table 5). distinct clusters depending on the county of origin.
This is a further proof that the Cape gooseberry Accessions from Kiambu and Murang’a counties,
accessions in Kenya have a broad genetic diversity. however, clustered together showing that they were
genetically more identical (Figure 2). Individuals were
distinct within clusters with little overlap between
Factorial analysis individuals indicating that the collections are genetically
diverse. The collections show a higher level of diversity
Factorial analysis was performed to analyze the genetic within and across the clusters (Figure 2).
relationship and population structure of the accessions
within and between the counties. A dissimilarity matrix
calculated using raw data from the SSR “1” and “0” matrix Phylogenetic analysis
was used for factorial analysis using Darwin 6.0.21
software. The first five axes accounted for 76.81% of all A distance tree was constructed in Darwin 6 using the
the variance observed in the test samples, with 41.2, UPGMA method. The robustness of the node of the
52.71, and 1.85% explained by PC axes 1, 2, and 3, phylogenetic tree was assessed from 1000 bootstrap
respectively. The highest variance was observed in replicates. In this study, the minimum dissimilarity value
Nakuru county (31.90) indicating that cape gooseberry for the phylogenetic tree was 0.027 while the maximum
accessions in this county have high genetic diversity and value was 1. This high dissimilarity value is further proof
the lowest variance was recorded in Laikipia (-0.21) of high genetic diversity found in the Kenyan gooseberry
showing comparatively genetic diversity in the accessions accessions. Tree length varied between 0 for duplicates36 Afr. J. Plant Sci.
Factorial analysis: (Axes 1 / 2)
.2
KMB/THK/THK/GRS/KIA/01
.15 KCO/KLN/KCO/CSR/CSR/04
KCO/KLN/KCO/CSR/CSR/02
KCO/AIN/KCO/KAP/CSR/01
III
KMB/THK/THK/GRS/NGO/01
KMB/THK/THK/GRS/MAK/01
KMB / LAR/KIN/KIN/KAM/02 KCO/LTN/BRT/CMB/KER/01
KCO/KLP/KCO/AMI/CSD/1
KMB
KMB/GATN/GAT/KAM/GAK/02
/GATN/GAT/KAM/GAK/01
/GATN/GAT/NGE/KAN/01 KCO/AIN/ KCO/KAP/CSR/03
KCO/KLP/CHY/CHY/UNL/07
KCO/KLN/KCO/CSR/CSR/01
KCO/KLN/KCO/CSR/CSR/03
KCO/KAP/CSR/02
KMB /RUI/RUI/MUR/TAT/01 .1
KMB /GATS/GAT/KIG/MUN/02
KMB
KMB
KMB/LAR/KIN/KIN/KAM/01
/LIM/GIT/THA/KIA/01
/RUI/RUI/NGE/CRF/01
KMBKMB /GAT/GAT/NGE/KAN/02
/LIM/NDE/BAN/KEN/01
/LIM/NDE/BAN/KEN/02
MRG
MRG /GAT/GAT/WAN/RWE/01
/GAT/GAT/WAN/GAT/01
/GAT/GWA/KAN/NDA/01
/GAT/GWA/KAN/NDA/02
KMB /GATS/GAT/KIG/MUN/01 NYD /NYH/NDR/SHM/ETR /02
MRG
MRG
MRG/KAN/NGA/MUK/GIT/01
/KIG/KAN/KAN/NGU/01
/KIG/KAH/KAH/KAR/01
/KIG/KAN/MUT/ITA/01
/KIG/KAN/MUT/ITA/02
.05
MRG /GAT/MUG/KIR/MUN/02
MRG/GAT/MUG/KIR/BAH/01 NYD /NYH/NDR/SHM/GK/01
/SK/SK /NJB/ATC/02
/SK/TIG/KIP/MHT/02
/OLK/OLK/OLJ/KAS/01 IV
MRG /KAN/RUC/GIT/K1A/01
MRG /GAT/MUG/KIR/MUN/01
MRG /KAN/GAI/GIT/KAM/01
-.25 -.2 -.15 -.1 -.05 .05 .1 .15 .2
NYD /NYH/NDR/SHM/MI/03
NYD /SK/TIG/KIP/MHT/01
NYD /SK/SK /NJB/ATC/01
NYD/SK/SK/KAR/MAG/02
NYD/SK/SK/KAR/MAG/01
-.05
II NKR /NJR/EGER/EGER/F7/01
NKR /NJR/EGER/EGER/F3/01
/GIT/LAN/UMJ/7ACR/01
/NJR/EGER/EGER/NGU/01
-.1 NKR /ELB/ELB/SAL/KAR/01
IV
-.15
NKR/NJR/MN/MN/TRS/01
NKR /NJR/MN/MN/TRS/02
/NJR/MN/MN/SIL/01
/NJR/MN/MN/TRG/01
/MOL/MS/NES/KAP/01
/MOL/MS/NES/KIA/01
/MOL/MS/NES/KIB/01
NKR /NJR/MN/MN/SIL/02
-.2
LKP /LW/KIN/SAL/PES/03
/LW/KIN/SAL/PES/02
LKP/LW/KIN/SAL/PES/01
LKP /LW/NYA/MAN/TF/02
LKP
LKP /LW/NYA/MAN/TF/01
/LW/KIN/SAL/PES/04
I
LKP /LW/NYA/MAN/TF/03
-.25
Figure 2. Factorial analysis of cape gooseberry accessions from the six selected counties in Kenya; Names in the circles
correspond to individual accession names .
Figure 2: Factorial analysis of cape gooseberry accessions from the six selected counties in Kenya;
Names in the circles correspond to individual accession names
and 0.161 for distinct individuals, the edge length sum identified.
was Phylogenetic
2.04 indicating Analysis
that most of the cultivars are distinct.
The collections were grouped into two major clusters I
and II. Cluster I contained accessions sampled from CONCLUSION AND RECOMMENDATION
Nyandarua (1.A), Nakuru (I.B), Kericho (I.C), and Laikipia
(I.D) counties while cluster II contained accessions from This is the first study in Kenya that used SSR markers to
Kiambu (II.A) and Murang’a (II.B). The phylogenetic tree genetically characterize Cape gooseberry. The study
further clustered the accessions into six sub-clusters (I.A, established that Cape gooseberry in the six target
I.B, I.C, I.D, II.A, and II.B) based on the county of origin counties of Kenya have a broad genetic diversity. Based
(Figure 3). on the SSR data, the 70 accessions were classified into
The clustering analysis applied was able to detect a two main phylogenetic groups and six sub-clusters which
geographical distribution pattern. This observation may corresponded to the county of origin through factorial
be due to lack of frequent gene flow through the analysis, principal component analysis (PCA), and
exchange of seeds among the counties by humans as is phylogenetic analyses. The study also established that
often the case in heavily domesticated species. This seven SSR primer pairs with higher polymorphism
finding is in disagreement with the findings of Garzon- namely, SSR1, SSR2, SSR10, SSR11, SSR123,
Martínez et al. (2015) who failed to deduce any SSR138, and SSR146 have a wide applicability in
geographical clustering of Columbian P. peruviana genotype identification and characterization of the
varieties using SSR and InDels markers. This may be population structure of Cape gooseberry. The information
because the study by Garzón-Martínez et al. (2015) used generated by this study contributes to understanding
well defined domestic commercial gooseberry accessions. diversity and population structure and enhances the
Both factorial and phylogenetic population analyses show management of Cape gooseberry genetic resources in
that the whole Cape gooseberry population has two Kenya.
different genetic populations. Using the PCA approach, This study enhances understanding of levels of genetic
two different populations within the P. peruviana were variations among Kenyan Cape gooseberry germplasmMuraguri et al. 37
NYD /SK/TIG/KIP/M HT/02
NYD /SK/SK /NJB/ATC/02
NYD /OLK/OLK/OLJ/KAS/01
NYD /NYH/NDR/SHM /GK/01
NYD /SK/TIG/KIP/M HT/01
NYD/SK/SK/KAR/M AG/02
NYD/SK/SK/KAR/M AG/01
NYD /SK/SK /NJB/ATC/01
NYD /NYH/NDR/SHM /ETR /02
NYD /NYH/NDR/SHM /M I/03
NKR /NJR/M N/M N/TRS/02
NKR/NJR/M N/M N/TRS/01
NKR /NJR/M N/M N/SIL/01
NKR /NJR/M N/M N/TRG/01
NKR /M OL/M S/NES/KAP/01
NKR /M OL/M S/NES/KIA/01
NKR /M OL/M S/NES/KIB/01
NKR /NJR/M N/M N/SIL/02
NKR /NJR/EGER/EGER/NGU/01
NKR /GIT/LAN/UM J/7ACR/01
NKR /NJR/EGER/EGER/F3/01
NKR /ELB/ELB/SAL/KAR/01
NKR /NJR/EGER/EGER/F7/01
LKP /LW/NYA/M AN/TF/01
LKP /LW/KIN/SAL/PES/04
LKP /LW/KIN/SAL/PES/03
LKP /LW/KIN/SAL/PES/02
LKP /LW/NYA/M AN/TF/03
LKP /LW/NYA/M AN/TF/02
LKP/LW/KIN/SAL/PES/01
KCO/AIN/ KCO/KAP/CSR/03
KCO/AIN/ KCO/KAP/CSR/02
KCO/KLP/CHY/CHY/UNL/07
KCO/KLN/KCO/CSR/CSR/01
KCO/KLN/KCO/CSR/CSR/03
KCO/AIN/KCO/KAP/CSR/01
KCO/LTN/BRT/CM B/KER/01
KCO/KLP/KCO/AM I/CSD/1
KCO/KLN/KCO/CSR/CSR/04
KCO/KLN/KCO/CSR/CSR/02
KM B/THK/THK/GRS/KIA/01
KM B /GATN/GAT/NGE/KAN/01
KM B /GATN/GAT/KAM /GAK/02
KM B /GATN/GAT/KAM /GAK/01
KM B /GATS/GAT/KIG/M UN/02
KM B/THK/THK/GRS/M AK/01
KM B/THK/THK/GRS/NGO/01
KM B /LIM /GIT/THA/KIA/01
KM B /RUI/RUI/NGE/CRF/01
KM B /LAR/KIN/KIN/KAM /01
KM B /GATS/GAT/KIG/M UN/01
KM B / LAR/KIN/KIN/KAM /02
KM B /RUI/RUI/M UR/TAT/01
KM B /LIM /NDE/BAN/KEN/02
KM B /LIM /NDE/BAN/KEN/01
KM B /GAT/GAT/NGE/KAN/02
M RG /KIG/KAH/KAH/KAR/01
M RG /KIG/KAN/KAN/NGU/01
M RG /KIG/KAN/M UT/ITA/02
M RG /KAN/NGA/M UK/GIT/01
M RG /KIG/KAN/M UT/ITA/01
M RG /GAT/M UG/KIR/M UN/02
M RG /GAT/GAT/WAN/RWE/01
M RG /GAT/GAT/WAN/GAT/01
M RG /GAT/GWA/KAN/NDA/02
M RG /GAT/GWA/KAN/NDA/01
M RG /GAT/M UG/KIR/M UN/01
M RG/GAT/M UG/KIR/BAH/01
M RG /KAN/GAI/GIT/KAM /01
M RG /KAN/RUC/GIT/K1A/01
0 0.1
Figure 3. Phylogenetic trees of cape gooseberry accessions based on SSR data.
and informs the need to introduce commercial Cape Grant award, Kenya. I would like to thank the staff at
gooseberry varieties as sources of genetic variation for KALRO-Njoro (Food Crops Institute) for the assistance
breeding and hybridization purposes. The findings of the and insight accorded to me during my lab work,
study also inform on the need to use more advanced colleagues, and staff from the Department of Crops,
molecular platforms such as genome-wide sequencing to Horticulture and Soils, Egerton University for their support
establish more diversity in wild and cultivated Cape during the research.
gooseberry in Kenya.
REFERENCES
CONFLICT OF INTERESTS Ali A, Singh P (2016). Studies on production potential of cape
gooseberry (Physalis peruviana L.) in sodic soil under varying
agronomic manipulations. Journal of Applied and Natural Science
The authors have not declared any conflict of interests. 8(1):368-374.
Bhandari R, Nishant Bhanu A, Srivastava K, Singh M, Shreya H (2017).
Assessment of genetic diversity in crop plants. An overview.
ACKNOWLEDGMENTS Advances in Plant and Agriculture Research 7:00255.
Bonilla M, Piedrahíta E, Mauricio A, Terranova P, Amariles V, Eduardo
J, Flórez M (2008). Molecular characterization of 43 accessions of
This work was funded by RUFORUM in collaboration with cape gooseberry from six departments of Colombia. Acta
Egerton University TAGDEv program under the nurturing Agronomica 57:109-115.38 Afr. J. Plant Sci. Campisano A, Pancher M, Puopolo G, Puddu A, Lòpez-Fernàndez S, Rao R, Hodgkin T (2002). Genetic diversity and conservation and Biagini B, Pertot I (2015). Diversity in endophyte populations reveals utilization of plantgenetic resources. Plant Cell Tissue Organ Culture functional and taxonomic diversity between wild and domesticated 68:1-19. grapevines. American Journal of Enology and Viticulture 66(1):12-21. Rauf S, Teixeira da Silva J, Khan A, Naveed A (2010). Consequences Chacón S, Isabel M, Sánchez Y, Barrero M, Stella L (2016). Genetic of plant breeding on genetic diversity. International Journal of Plant structure of a Colombian cape gooseberry (Physalis peruviana L.) Breeding 4:1-21. collection by means of microsatellite markers. Agronomía Ravi B, Hrideek K, Kumar K, Prabhakaran R, Mal B, Padulosi S (2010). Colombiana 34(1):5-16. Mobilizing neglected and underutilized crops to strengthen food Demir K, Bakir M, Sarikamis G, Acunalp S (2010). Genetic diversity of security and alleviate poverty in India. Indian Journal of Plant Genetic eggplant (Solanum melongena) germplasm from Turkey assessed by Resources 23(1):110-116. SSR and RAPD markers. Genetics and Molecular Research Sim C, Van Deynze A, Stoffel K, Douches S, Zarka D, Ganal W, 9(3):1568-1576. Chetelat T, Hutton F, Scott W, Gardner G, Panthee R, Mutschler M, Ellis J, Burke M (2007). EST-SSRs as a resource for population genetic Myers R, Francis M (2012). High-density SNP genotyping of tomato analyses. Heredity 99(2):125-132. (Solanum lycopersicum L.) reveals patterns of genetic variation due Garzón-Martínez G, Osorio-Guarín J, Delgadillo-Durán P, Mayorga F, to breeding. PLoS One 7(9):e45520. Enciso-Rodríguez F, Landsman D, Barrero L (2015). Genetic Simbaqueba J, Sanchez P, Sanchez E, Zarantes N, Chacon M, Barrero diversity and population structure in Physalis peruviana and related S, Mariño-Ramírez L (2011). Development and characterization of taxa based on InDels and SNPs derived from COSII and IRG microsatellite markers for the Cape gooseberry Physalis peruviana. markers. Plant Gene 4:29-37. PloS one 6(10):e26719. Herrera M, Ortiz D, Fischer G, Chacón I (2011). Behavior in yield and Thies E (2000). Promising and underutilized species, crops and breeds. quality of 54 cape gooseberry (Physalis peruviana L.) accessions Available at: from north-eastern Colombia. Agronomía Colombiana 29(2):189-196. https://cgspace.cgiar.org/bitstream/handle/10568/3682/thies.pdf?;seq Kimura M, Crow F (1964). The number of alleles that can be maintained uence=1 in a finite population. Genetics 49(4):725-738. Villacorta M, Shaw J (2013). Peruvian Power Foods: 18 Superfoods, Labate A, Robertson D, Wu F, Tanksley D, Baldo M (2009). EST, 101 Recipes, and Anti-aging Secrets from the Amazon to the Andes. COSII, and arbitrary gene markers give similar estimates of Health Communications, Inc. nucleotide diversity in cultivated tomato (Solanum lycopersicum L.). Virk S, Zhu J, Newbury J, Bryan J, Jackson T, Ford-Lloyd V (2000). Theoretical and Applied Genetics 118:1005-1014. Effectiveness of different classes of molecular marker for classifying Lagos T, Vallejo F, Criollo H, Muñoz J (2008). Sexual reproduction of and revealing variation in rice (Oryza sativa) germplasm. Euphytica the cape gooseberry. Acta Agronomica 57(2):81-87. 112(3):275-284. Leiva-Brondo M, Prohens J, Nuez F (2001). Genetic analyses indicate Wu J, Chang P, Lin L, Wang S, Hou F, Ng T (2009). Supercritical superiority of performance of cape gooseberry (Physalis peruviana carbon dioxide extract of Physalis peruviana induced cell cycle arrest L.) hybrids. Journal of New Seeds 3(3):71-84. and apoptosis in human lung cancer H661 cells. Food and Chemical Lewontin C (1972). The apportionment of human diversity. Evolutionary Toxicology 47(6):1132-1138. Biology 6:381-398. Yeh F, Yang R, Boyle T (2000). POPGENE Version 1.32: Software for Liu K, Muse V (2005). Power Marker: an integrated analysis Population Genetic Analysis. environment for genetic marker analysis. Bioinformatics 21:2128- Zhu C, Gore M, Buckler S, Yu J (2008). Status and prospects of 2129. association mapping in plants. Plant Genome 1:5-20. Mason A (2015). SSR Genotyping. In Plant Genotyping. Humana press, New York, USA. pp. 77-89. McDermott M, McDonald A (1993). Gene flow in plant pathosystems. Annual review of phytopathology 31(1):353-373. Morgante M, Hanafey M, Powell W (2002). Microsatellites are preferentially associated with nonrepetitive DNA in plant genomes. Nature genetics 30(2):194-200. Myers N, Mittermeier A, Mittermeier G, Da Fonseca A, Kent J (2000). Biodiversity hotspots for conservation priorities. Nature 403(6772):853-858. Nei M (1973). Analysis of gene diversity in subdivided populations. Proceedings of the National Academy of Sciences 70(12):3321-3323. Nei M (1978). Estimation of average heterozygosity and genetic distance from a small number of individuals. Genetics 89(3):583-590. Ochatt S, Jain S (2007). Breeding of Neglected and Under-Utilized Crops, Spices, and Herbs. Science Publishers, Inc.: New Hampshire, NH, USA. Perrier X, Jacquemoud-Collet P (2006). DARwin software. Porebski R, Bailey S, Baum R (1997). Modification of a CTAB DNA extraction protocol for plants containing high polysaccharide and polyphenol components. Plant Molecular Biology Reporter 15:8-15.
You can also read