2020 AUSTRALIAN AFFORDABLE HOUSING REPORT - Environmental Scan - PowerHousing Australia
←
→
Page content transcription
If your browser does not render page correctly, please read the page content below
AUSTRALIAN AFFORDABLE
HOUSING REPORT
Environmental Scan

2020
CONTENTS
1. Introduction.........................................................................................................3

2. Executive Summary............................................................................................4

3. National Economic Indicators...........................................................................6

4. Housing Activity.............................................................................................. 14

5. National Affordability Measures.................................................................... 24

6. Summary.......................................................................................................... 35

7. About the Authors........................................................................................... 36

Cover Image: Unison – Broadmeadows development
Access Housing – SHAC development

01
INTRODUCTION
The Australian Affordable Housing Report 2020          internationally, impacting housing availability, rental/
provides an up-to-date insight into the myriad         mortgage rates, and Australians’ need for housing –
factors relating to housing supply and demand, and     social, affordable or otherwise – in the next two years.
considers the impact of these elements on housing      Importantly, the report focuses on demand indicators
affordability particularly for low income earners.     and actual housing activity in an effort to consider
This report takes into consideration that low income   housing affordability for average to low income
earners can include social housing tenants, renters,   Australians.
first homebuyers, key workers and seniors.
                                                       We also consider previous reporting on housing
As an environmental scan, this report’s focus is       activity produced over the past 10+ years by the
on housing activity and levers. It considers fiscal,   authors and identifies where housing activity has
monetary and market factors, both domestically and     evolved differently than was projected.

                                                                  Australian Affordable Housing Report 2020   3
BHC – Jingeri, Enoggera

         02
         EXECUTIVE SUMMARY

          The Australian Affordable Housing Report 2020           migration, which has seen demand for housing
          provides a national affordable housing and              increase in the past decade. Fortunately, recent
          rental environmental scan that features low             record supply of new housing commencements has
          growth, low inflation, low interest rates and rising    taken pressure off pricing – until now.
          underemployment. Each economic indicator
                                                                  Building activity in Australia is heading for the largest
          provides insights into previous, current and emerging
                                                                  decline in our country’s history with homes approved
          environmental conditions and the challenges
                                                                  set to drop from 240,000 dwellings approved in 2016
          faced around the servicing of rental and mortgage
                                                                  to around 160-170,000 in 2021, with completions
          payments. The report also considers the growing
                                                                  lower still unless the decline is halted. Forecasts
          gap between (low) wages growth and (rising) rental
                                                                  reported in this E-Scan suggest that annual housing
          and house price pressures over the past decade.
                                                                  starts will drop to 152,000 dwellings in around 18
          The key factors to the rising price has included        months’ time which would be catastrophic for jobs,
          strong population growth and net overseas               supply and the overall economy.

         4    Powerhousing Australia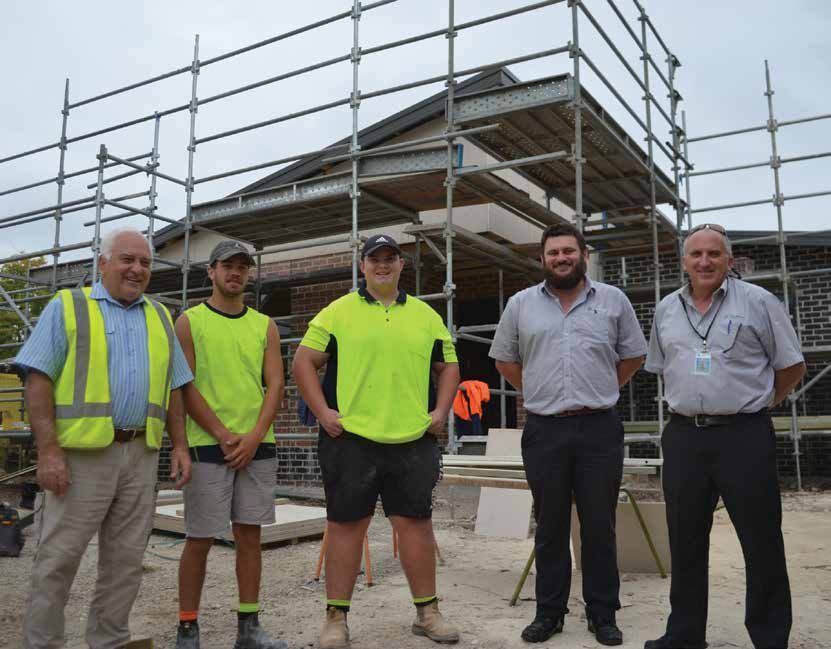
Losing 60,000-80,000 homes out of the housing            than spending, household wealth is a record high
construction pipeline will create a massive ripple       while liabilities have significantly increased, and
through the economy if not halted. Two of the            mortgages are being paid off for many above the
nation’s largest builders, Simonds Group and             rates being set.
Metricon, estimate that every new standard 3
                                                         The number of Australians renting to others has
bedroom house in Australia creates work for around
                                                         tripped over the 2,000,000 mark with the tax
43 trades and subtrades. The role of housing in the
                                                         structures of negative gearing and capital gains
economy goes far beyond just the need for supply
                                                         discount remaining in place after the Coalition won
to match demand; the loss of this many homes will
                                                         the last Federal election.
see the loss of 3 million one-day to months-long
contracts for chippies, painters, plasterers, sparkies   First homebuyers are getting older before purchasing
and para-professionals. Whether it is the retail         homes and, while first homebuyer rates are relatively
shop, coffee stop on the way to work or simply less      steady, are a lever unlikely to spark a revival in new
groceries this has a knock-on effect for the retail      dwelling construction. The introduction of the Federal
sector that won’t see the circulation of the income      Government’s First Home Loan Deposit Scheme will
into the broader economy. Needless to say if homes       support the purchase of 10,000 homes but may not
are not built then there will also be a drop in the      support substantial additional supply.
manufacturing sector.
                                                         APRA’s recent BASEL III requirements for higher
In the absence of monetary and fiscal policy, housing    bank holdings will add to the cost of owning and
starts will fall back behind population growth and       renting a home with costs passed through to
this would see an irrational upward pressure with        renters. In particular the risks being covered by this
potential resumption of spiking in pricing.              rudimental and blunt instrument has the potential to
In October 2019 the Federal Reserve Bank moved           impact the provision of affordable housing.
the cash rate to 0.75 which, coupled with other          CHPs who have strong governance practices and
recent downward shifts in the rate, will potentially     government-guaranteed revenues and agreements
lessen the severity of the trough of housing             have a lower risk on the curve compared to
commencements but foreshadows an economy                 speculative investment in residential real estate.
with some headwinds.
                                                         The outlook for low income earners – particularly
Motivation for the lower cash rate also understands      social housing tenants, renters, first homebuyers,
that housing construction provides jobs, taxes           key workers and seniors – could remain bleak while
and valuable supply which are the lifeblood of the       rental pricing and entry level housing mortgages rise.
economy.
                                                         Whilst the supply of new homes has been dropping,
Sydney and Melbourne dwelling prices appear to           there has been a steady increase in the social and
have partially corrected, but the median price in        affordable housing built by PowerHousing members
Sydney of around $875k is still very unaffordable and    and this contribution to supply as a relatively new
median incomes still remain low.                         input is also set to grow to underpin housing starts.
Whilst Perth, Adelaide and Darwin continue to stall,     The introduction of the National Housing Finance
Hobart and Canberra dwelling prices and rents            and Investment Corporation is expected to support
are rising with investment in rentals and steady         additional supply with CHPs delivering more homes
purchase velocity. The impact of AirBnB is still         at lower cost.
uncertain and measures which consider the number
                                                         There is an opportunity to pull the levers to see
of these types of short-stay accommodation are not
                                                         international and institutional investment in an
yet introduced despite having some impact on the
                                                         affordable asset class built in Australia in the coming
Tasmanian capital pricing.
                                                         years, which could build 10,000-25,000 affordable
Across the indicators Australians are saving rather      dwellings per year.

                                                                      Australian Affordable Housing Report 2020    5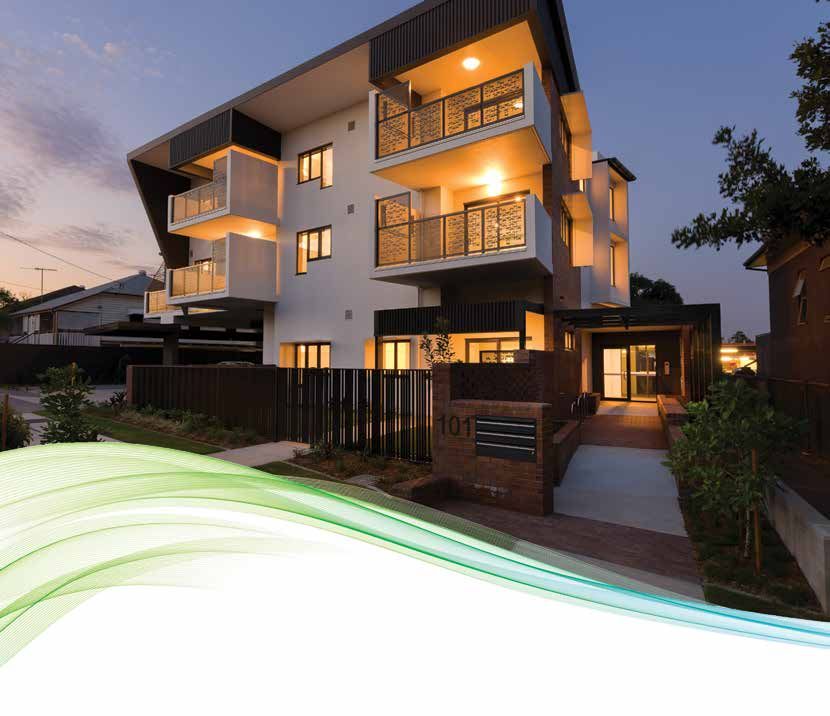
BlueCHP Limited - Hunter Residences Program

        03
         NATIONAL ECONOMIC INDICATORS

        Growth
        In the June quarter, the Australian economy grew          household disposable income.
        by .5% in seasonally adjusted chain volume terms,
                                                                  Housing Affordability 2020 – Annual economic
        with 1.4% growth recorded across the year.1 This is a     growth has not dipped this low since the 12 months
        distinct drop from the figures recorded in the previous   ending in September 2009, following the GFC. Dwelling
        Environmental Scan of 1% and 3.1% respectively, 12        investment fell by 6% in the quarter and 10.9% through
        months prior. Net exports contributed 0.6 percentage      the year. Household final consumption expenditure
        points due to strong mining commodity exports, and        increased 0.4% in the quarter to 1.4% through the
        domestic demand contributed .3 percentage points          year but with notable falls on purchase of vehicles.
        due mainly to government spending. The household          Household expenditure is half that of 12 months ago
        saving ratio dropped to 2.3 from 3.2 a year prior as      and it has not grown so slowly since early-mid 2013,
        growth in household final consumption outpaced            with the only worse figures occurring in early 2009.

        6    Powerhousing Australia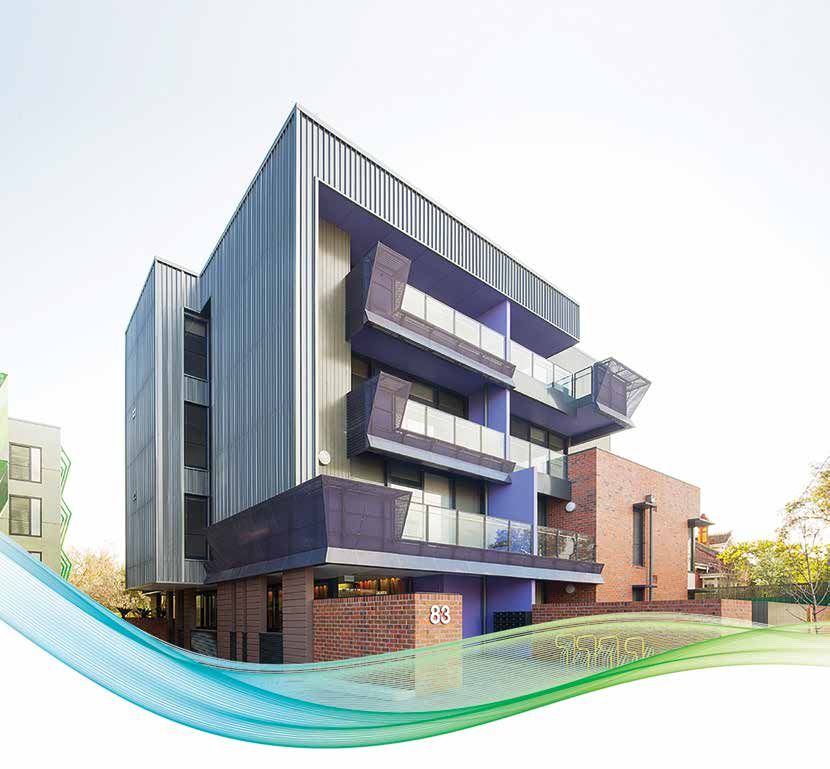
Graph 1: Housing income and consumption* – Real, year-ended growth
% %
Consumption
10 10
5 5
0 0
Disposable income
% %
Saving ratio
10 10
5 5
0 0
-5 -5
1989 1994 1999 2004 2009 2014 2019
* Household sector includes unincorporated enterprises; disposable income is after tax and interest paments; saving
ratio is net of depreciation.
Source: RBA, September 20192
Wages Growth
Wages grew by .6% in seasonally adjusted terms mining investment boom, with wages now expected
for the June quarter and 2.3% throughout the year,3 to increase more gradually than previously thought.4
significantly lower than the 20-year average wage
Housing affordability 2020 – Sluggish wage growth
growth of 3.2%. The public sector led the rise at 2.6%
will continue to negatively impact the purchasing
across the year with the private sector trailing at 2.3%.
capacity of those on low to middle incomes as
The RBA expects wage growth to remain low due to
dwelling prices remain largely out of reach.
spare capacity in the labour market and end of the
Graph 2: Changes in total hourly rates of pay excluding bonuses ABS 6345.0 (Jun 2019)
5
4
3
2
1
––Public & Private sectors ––Private sector ––Public sector
0
17
18
19
00
01
02
03
04
05
06
07
08
09
10
11
12
13
14
15
16
n
n
n
n
n
n
n
n
n
n
n
n
n
n
n
n
n
n
n
n
Ju
Ju
Ju
Ju
Ju
Ju
Ju
Ju
Ju
Ju
Ju
Ju
Ju
Ju
Ju
Ju
Ju
Ju
Ju
Ju
Australian Affordable Housing Report 2020 7
Inflation
  With a .6% increase to the Consumer Price Index                    Housing affordability 2020 – Inflation has been
  over the June quarter 2019, inflation rose 1.6% over               relatively steady since the early 2000s, hovering below
  the previous 12 months.5 Automotive fuel made up                   the RBA target rate of 2-3%6 with low inflationary
  the biggest price increase this quarter, followed by               impact on housing costs.
  medical and hospital services while fruit prices fell
  most significantly, followed by electricity and domestic
  holiday costs.

  Graph 3: Consumer Price Index ABS 6401.0 (Jun 2019)

              10

               8

               6
% per year

               4

               2

               0

               -2
              89

                      91

                             93

                                       95

                                             97

                                                   99

                                                         01

                                                               03

                                                                      05

                                                                             07

                                                                                    09

                                                                                           11

                                                                                                  13

                                                                                                         15

                                                                                                                 17

                                                                                                                        19
               n

                      n

                             n

                                    n

                                              n

                                                    n

                                                          n

                                                                n

                                                                      n

                                                                             n

                                                                                    n

                                                                                           n

                                                                                                  n

                                                                                                         n

                                                                                                                n

                                                                                                                        n
             Ju

                    Ju

                           Ju

                                  Ju

                                            Ju

                                                  Ju

                                                        Ju

                                                              Ju

                                                                    Ju

                                                                           Ju

                                                                                  Ju

                                                                                         Ju

                                                                                                Ju

                                                                                                       Ju

                                                                                                              Ju

  Interest Rates                                                                                                      Ju
                                                                    Housing affordability 2020 – Interest rate cuts
                                                                    are likely to largely benefit those already servicing
  The Reserve Bank cash rate has dropped by 25                      a mortgage but may help new entrants break into
  basis points to a new record low of .75% in October,              the housing market. With the high cost of housing
  to support employment and income growth and                       compared to slow wage growth, any future interest
  to provide greater confidence that inflation will                 rate hikes would have a considerable impact on
  be consistent with the medium-term target.7 The                   mortgage repayment capacity.
  previous interest rate change occurred in June,
  a drop of 25 basis points in order to support
  employment growth and again provide greater
                                                                    Unemployment and
  confidence.                                                       Underemployment
  In October 2019, the Government announced an                      Like many western countries the official Australian
  ACCC inquiry into the pricing of residential mortgage             unemployment remains at relatively low levels with
  products to determine why banks are not passing on                62.7% of the population employed as at August
  the interest rate cuts in full.8                                  2019.9 Both the trend and seasonally adjusted
                                                                    unemployment rate sits at 5.3% which is close to
                                                                    the 20-year average of 5.5%, and was marked by a
                                                                    decrease of 15,500 people in fulltime employment
                                                                    while part-time employment figures rose by 50,200.

  8           Powerhousing Australia
It is worth noting that a work week of 1 hour is             element to consider when looking at these figures
 classed as being employed. Fulltime employment is            is the underemployment rate. Those who are
 described as when an individual usually works 35 or          underemployed are defined as those aged over
 more hours in the survey reference week, including           15 who are currently employed but desire and are
 those who were employed in 2 or more part-time               available to work more. The underemployment rate
 jobs and in total worked more than 35 hours. Part-           remains relatively steady, with the trend estimate
 time workers are those who worked and usually work           at 8.5% and seasonally adjusted figure rising .2%
 less than 35 hours in the survey reference week.10           on July’s figures to 8.6%. The seasonally adjusted
                                                              underemployment rate is higher than the 20-year
 For this reason, the employment rate is not
                                                              average of 7.2%, and a marked jump from 10 years
 necessarily an accurate measure for the
                                                              ago when it was 5.7%.
 adequacy of a person’s employment; a key

 Graph 4: Unemployment vs Underemployment ABS 6202.0 (Aug 2019, seasonally adjusted)

12

10

 8

 6

 4

 2
            ––Average Underemployment Rate ––Average Unemployment Rate
 0
     81

          83

               85

                    87

                         89

                               91

                                     93

                                           95

                                                 97

                                                       99

                                                             01

                                                                     03

                                                                           05

                                                                                  07

                                                                                        09

                                                                                              11

                                                                                                    13

                                                                                                          15

                                                                                                                17

                                                                                                                      19
  g

        g

              g

                    g

                          g

                                g

                                      g

                                            g

                                                  g

                                                        g

                                                              g

                                                                    g

                                                                          g

                                                                                 g

                                                                                       g

                                                                                             g

                                                                                                   g

                                                                                                         g

                                                                                                               g

                                                                                                                     g
Au

      Au

            Au

                  Au

                        Au

                              Au

                                    Au

                                          Au

                                                Au

                                                      Au

                                                            Au

                                                                  Au

                                                                        Au

                                                                               Au

                                                                                     Au

                                                                                           Au

                                                                                                 Au

                                                                                                       Au

                                                                                                             Au

                                                                                                                   Au

 Housing affordability 2020 – Whilst lower                        More Couples with Children
 unemployment numbers point to a greater capacity
                                                                  Working Fulltime
 to service rental/mortgage obligations, the increasing
 percentage of workers who are underemployed will                 ABS figures show that the proportion of families
 make it challenging for those prospective buyers to              with both parents working fulltime while having
 obtain a home loan. If the underemployment rate                  children younger than five increased over the last
 continues to rise, buying a home will remain out of              decade.11i 21% of families with children aged from
 the question for an increasing number of Australians.            0-4 see both parents working fulltime, while 70%

                                                                              Australian Affordable Housing Report 2020   9
of couple families with children under 15 have                         1.6%12 on the previous year, and is currently growing
employed mothers. Simultaneously, there has been a                     at the rate of one person every 1 minute and 13
fall of 28% in families with children under 15 with just               seconds. The estimate of net overseas migration
one employed parent, and a fall in jobless families of                 (NOM) for the year ending 31 March 2019 (249,700
11%.                                                                   people) was 4.9% or 11,700 people higher than the
                                                                       NOM recorded for the year ending 31 March 2018
Housing affordability 2020 – With the rise of
                                                                       (238,000 people).
couples both working fulltime, it appears that the
current housing market has adjusted to dual streams                    Our population is expected to reach 30 million
of income, further pushing homeownership out of                        between 2029 and 2033, with the population of over-
reach for single and lower-income households while                     85s to double in the next 25 years.13 The dependency
negating the financial benefits of dual income.                        ratio, which the number of persons per 100 aged
                                                                       outside 15-64 (working age) is projected to grow
Net Overseas Migration and                                             from 52% in 2017 to 58% in 2042. The main cause
                                                                       of population growth is natural increase (births
Population Growth
                                                                       minus deaths) at 38.6% with net overseas migration
Australia’s population grew to 25.3 million people as                  accounting for the residual.
at the end of the March 2019 Quarter, an increase by

                                                  Population at end              Change over                  Change over
                                                    Mar Qtr 2019                 previous year                previous year

 PRELIMINARY DATA                                         '000                         '000                          %

 New South Wales                                        8 071.1                       114.1                          1.4

 Victoria                                               6 566.2                       133.5                          2.1

 Queensland                                             5 076.5                        88.1                          1.8

 South Australia                                        1 748.6                        14.8                          0.9

 Western Australia                                      2 615.8                        26.0                          1.0

 Tasmania                                                533.3                          6.4                          1.2

 Northern Territory                                      245.6                         -1.1                         -0.4

 Australian Capital Territory                            425.7                          6.9                          1.7

 Australia(a)                                          25 287.4                       404.8                          1.6

(a) Includes Other Territories comprising Jervis Bay Territory, Christmas Island, the Cocos (Keeling) Islands and Norfolk Island.
Source: ABS 2019, 3101.014

Housing affordability 2020 – Australia’s population                    housing policy, which threatens to add pressure
continues to grow without the guidance of a national                   on the housing market if demand further outstrips
population strategy that is in alignment to cities and                 supply.

10     Powerhousing Australia
Household Wealth and Household Net Savings
Household net worth was a record high $10,455.3 decrease was due to a decrease in gross disposable
billion at the end of the June Quarter 2019, up income, which was driven by a fall in dividends
1.6%.15 Real (inflation adjusted) holding gains on received and increase in income tax payable, and
financial assets, mainly superannuation, drove the increases in final consumption expenditure and
increase in household wealth while a $36.7 billion consumption of fixed capital.
increase in total liabilities partly offset this figure.
Housing affordability 2020 – With the increase in
Household liabilities grew 1.5%, the strongest
household wealth due mainly to superannuation
increase since the June Quarter of 2017.
investment in the stock market, and with a jump in
Household net saving fell to -$9.2 billion in the same household liabilities, mortgage-payers may see a
period, from $10.7 billion. The nearly $20 billion challenge in continuing to service mortgages.
Graph 5: Net saving plus other changes in real net wealth, original
– –
400
Land and dwellings Financial assets
––Net saving plus other changes in real net wealth
300
200
100
$ billions
0
-100
-200
-300
-400
-500
Jun 99 Jun 01 Jun 03 Jun 05 Jun 07 Jun 09 Jun 11 Jun 13 Jun 15 Jun 17 Jun 19
Source: ABS 2019, 5232.0 16
Australian Affordable Housing Report 2020 11Generational Wealth First Homeowner levels
Young Australians are in danger of being the first In August 2019, the number of loans to owner-
generation in memory to have lower living standards occupier first homebuyers rose 5.2%, seasonally
than their parents’ generation.16 A recent report adjusted, and lending commitments to owner occupier
stated the wealth of households for under-35s has non-first homebuyers fell 0.4%.17 In the 12 months
largely stagnated in the last 15 years, despite the ending in August 2019, first homebuyers made up a
cohort spending less on non-essentials such as total of 27.7% of all housing finance commitments
alcohol, clothing and personal care – and more on (excluding refinancing) with 108,057 commitments,
necessities like housing – than the equivalent group representing a 1.7% increase on this time last year;
did three decades ago. Meanwhile, the wealth of non-first homebuyers amounted to 281,830 for the
older households has grown by more than 50% over year, which is a 13.6% drop on the 12 months prior.
the same period, which can be attributed to the
ABS data shows fewer households under 35 owned
housing boom and superannuation asset growth.
their homes in 2015-16 than the previous generation
Housing affordability 2020 – Younger people are 20 years ago, with first homebuyers are purchasing
becoming less able to compete in the housing their first homes at an older age than they did in
market against those who are already established. 1995-96.18 57% of households under 35 are renting
now compared to 42% in 1995-96. Likewise, fewer
households aged 35-54 owned their homes outright in
2015-16 than similarly-aged households 20 years ago.
In total, 43% of households owned their home
without a mortgage 20 years ago but in 2015-16 that
figure was only 30%.
12 Powerhousing AustraliaGraph 6: Lending to Households ABS 5601.0 (Aug 2019)
40000
––Number of non-First Homebuyer Commitments, excluding refinancing
35000 –– Number of First Homebuyer Commitments
30000
25000
Monthly total
20000
15000
10000
5000
0
13
4
15
16
7
18
19
02
3
04
05
6
07
08
09
09
10
1
12
l1
r1
l0
r0
t1
ar
b
g
n
ay
g
n
ay
ar
b
n
c
v
p
Ju
Ju
Oc
Ap
Ap
No
De
Ju
Ju
Ja
Fe
Au
Fe
Se
Au
M
M
M
M
Housing affordability 2020 – The rate of first projected to make up 69-70% of all households,
homebuyers is likely to rise marginally with the First with lone-person households following at 24-27%
Home Loan Deposit Scheme which is expected and group households at 4-5%. In particular, group
to be administered by NHFIC and operational in households are expected to grow by 34-62%, with the
January 2020. The scheme will support up to proportion of housemates in their twenties declining
10,000 first homebuyers,19 enabling them to get into by 46-48% and the proportion of those aged 70 years
the market without saving a full 20% deposit and and over projected to increase by 2%. Those over 85
allowing those spending large amounts of money are expected to be mainly living alone.
on rent while simultaneously saving for a deposit to
Housing affordability 2020 – To ensure affordable
instead service a mortgage.
housing is also appropriate, future building design
will need to consider the demands of a growing
Household Formation population as well as the intended residential use;
The number of households in Australia is predicted group households require more considered living
to increase from 9.2 million in 2016 to up to 13.2 design, as do those living alone, compared to family
million in the year 2041.20 Family households are households.
Australian Affordable Housing Report 2020 13Housing Trust – Corrimal, NSW
04
HOUSING ACTIVITY
Rental Rates
Rental rates have held reasonably firm over the 12 Darwin and a 2.2% decline in Sydney rents.
months ending August 2019, with the rental index
The easing in rental growth can be attributed to several
across the combined capital cities virtually flat (+0.1%)
factors including the surge in investment activity over
over the year. The past decade has seen rents rising at
previous years that has contributed to higher rental
the average annual rate of 2.1%, which is broadly in line
supply as well as a reduction in rental demand as first
with inflation over the same period and a lower rate of
homebuyers become more active, especially in Sydney
growth relative to wages growth.
and Melbourne where stamp duty concessions and a
The past 12 months has seen rental growth range positive shift in housing affordability has incentivised
from almost 6% in Hobart to a decline of 3.2% in first homebuyer participation.
14 Powerhousing AustraliaGraph 7: Annual change in capital city rental rates
12.0%
10.0%
8.0%
6.0%
4.0%
2.0%
0
07
09
11
13
15
17
19
g
g
g
g
g
g
g
Au
Au
Au
Au
Au
Au
Au
Source: CoreLogic, September 2019
Graph 8: Annual change in dwelling rental rates
Canberra 0.3%
Darwin -3.2%
Hobart 5.9%
Perth 2.5%
Adelaide 1.8%
Brisbane 1.8%
Melbourne 1.3%
Sydney -2.2%
-4.0% -2.0% -0.0% 2.0% 4.0% 6.0% 8.0%
Source: CoreLogic, September 2019
Australian Affordable Housing Report 2020 15Transaction Volumes
The number of settled dwelling sales has been trending lower than they were sixteen years ago, despite a
lower since moving through a recent peak in March substantial increase in the total number of dwellings
2015. The recent high in market activity occurred and the total population of the country, points to
shortly after the first round of macroprudential policies market inefficiencies which have disincentivised
announced by APRA in late 2014; apart from a brief housing turnover. In particular, the high-transactional
rebound in activity following a 50 basis point cut to the costs related to buying and selling property has likely
cash rate in mid-2016, buyer activity has been trending discouraged prospective market participants. The
lower since that time. largest impost for buyers, as well as upgraders and
downsizers, is funding stamp duty, while other costs
The twelve months ending August 2019 saw settled
related to building and pest inspections and legal fees
sales activity reduce by 16.9% compared with the
when purchasing, as well as agency commissions
previous twelve month period, and the annual trend in
and marketing costs when selling.
sales is tracking 20% below the decade average.
Other factors such as housing affordability
The steepest decline in settled sales over the past
constraints have also dampened housing market
twelve months has been recorded in Melbourne,
activity, particularly in Sydney and Melbourne where
where year on year sales were down 26%, followed by
housing prices relative to household incomes show
Brisbane with a 19% decline and Sydney where activity
the greatest imbalance.
was 18% lower year on year. The only capital city to
record a rise in settled sales over the twelve months More recently the six month trend in sales activity
ending August was Darwin, where the volume of sales has started to indicate growth in housing turnover as
was up 1.6% from a low base, however annual sales buyers respond to lower interest rates, better access
remain 32% below the decade average. to credit and improved certainty around taxation
policy following the federal election. Additionally, with
Importantly, housing market activity reached
dwelling values trending lower between mid-2017
historical highs in late 2003. The twelve months
and mid-2019, there has been an improvement to
ending October 2003 saw 636,000 dwellings
housing affordability which has seen a rise in first
sold. The fact that settled sales are substantially
time buyer activity.
Graph 9: Monthly number of settled sales, National
70,000
60,000
6 month moving average
Monthly number of settled sales
50,000
40,000
30,000
20,000
10,000
0
Aug 94 Aug 99 Aug 04 Aug 09 Aug 14 Aug 19
Source: CoreLogic, September 2019
16 Powerhousing AustraliaGraph 10: Year on year change in dwelling sales
Canberra -9.9%
Darwin 1.6%
Hobart -11.8%
Perth -7.3%
Adelaide -3.4%
Brisbane -18.6%
Melbourne -25.8%
Sydney -17.6%
-30.0% -25.0% -20.0% -15.0% -10.0% -5.0% 0.0% 5.0%
Source: CoreLogic, September 2019
Auction Markets
Auction clearance rates provide a timely measure of Clearance rates across the combined capitals have held
the fit between buyer and seller pricing expectations. above 70% as the market moves into the spring selling
Homes sold by auction are heavily concentrated in season, with Sydney and Melbourne clearance rates
Melbourne and Sydney while most other cities see only consistently around the mid-to-high 70% range.
a small proportion of properties sold via an auction
The ongoing trend towards higher auction clearance
method.
rates implies the strong negotiation position buyers
The trend in auction clearance rates has been on a have enjoyed over the past few years is dissipating as
clear upwards trajectory through 2019, with the trend vendors gain back some leverage and buyers face more
accelerating through the second quarter of the year and competition. Advertised stock levels remain low against
into early spring. The recent strength in auction markets a rising number of active buyers, which is another factor
comes after a consistent downwards trend which supporting increased competition and placing some
persisted from early 2017, when clearance rates were in upwards pressure on prices.
the high 70% range, to late 2018 when clearance rates
bottomed out at 40%.
Australian Affordable Housing Report 2020 17Graph 11: Weighted average capital city auction clearance rates
90%
80%
70%
60%
50%
40%
30%
Sep 08 Sep 09 Sep 10 Sep 11 Sep 12 Sep 13 Sep 14 Sep 15 Sep 16 Sep 17 Sep 18 Sep 19
Source: CoreLogic, September 2019
Graph 12: Weekly auction clearance rates, sydney and melbourne
100%
90%
80%
70%
60%
50%
40%
––Melbourne ––Sydney
30%
Sep 08 Sep 09 Sep 10 Sep 11 Sep 12 Sep 13 Sep 14 Sep 15 Sep 16 Sep 17 Sep 18 Sep 19
Source: CoreLogic, September 2019
18 Powerhousing AustraliaHousing Finance/Investor Levels
Our previous iteration of this report noted that housing by 25.2%, following an decrease of 19.7% the year
finance was slowing down, largely due to nationally- previous.21 The same type of lending to owner-occupier
introduced macroprudential measures requiring banks dwellings was a similar story, dropping 12.1% for the
to limit their interest-only lending to investors. For the period despite a small uptick from June to August. This
12 months ending August 2019, the value of lending annual drop was quite significant, with the last drop
to households for investment dwellings (excluding occurring in the 12 months ending August 2011.
refinancing, alterations and additions) decreased
Graph 13: Value of Housing Finance ABS 5601.0 (Aug 2019)
16,000,000
14,000,000
12,000,000
10,000,000
8,000,000
6,000,000
4,000,000
2,000,000 ––Value of lending to household for owner occupier dwellings, excluding refinancing
–– Value of lending to household for investment dwellings, excluding refinancing
0
03
05
07
09
11
13
15
17
19
g
g
g
g
g
g
g
g
g
Au
Au
Au
Au
Au
Au
Au
Au
Au
Housing affordability 2020 – The decrease in prospective owner-occupiers, however, contributes
financing for rental market investors is likely to make in part to would-be buyers remaining in the rental
rental options less competitive for tenants in an market, thus putting a strain on the supply-demand
already challenging market. Tightening lending for continuum.
Australian Affordable Housing Report 2020 19Foreign Investment Levels
Foreign investment approvals in residential real estate in new delivery that pushed the commencement
have plummeted from 40,141 approvals in 2015-16 to rates of new housing supply to record levels.
10,036 approvals in 2017-18, down from $72.4 billion
Most of the approvals granted in 2017-18 were for
in approvals to $12.5 billion over the same period.22
potential purchases in Victoria and New South Wales
This represents a reduction of $59.9 billion in the
where population growth remains strong. China and
value of Foreign Investment Review Board approvals.
the United States remain the largest foreign investors
Although it must be noted that not all investment
in Australia’s real estate market. Although this steep
approvals translate into actual purchases of dwellings,
reduction in Chinese investment may be in part due
these figures suggest a huge decline in demand in
to reduction in demand for Australian property, China
residential real estate from foreign buyers particularly
has also put restrictions on the amount of capital
in the new residential space.
flowing out of the country, whilst the Australian
There is a significant drop from two years earlier from Federal Government as well as the banks have also
$65 billion in approvals for new dwellings down to tightened rules around lending to foreign investors.
$10 billion which represents the massive investment
Foreign Investment Approvals 2017-18
2013-14 2014-15 2015-16 2016-17 2017-18
No. $b No. $b No. $b No. $b No. $b
Developed 7,920 7.5 9,247 11.5 5,877 7.3 2,008 3.0 1,615 2.4
For Development 18,284 29.0 27,594 49.2 34,264 65.2 11,190 27.1 8,421 10.2
Total 26,204 36.5 36,841 60.7 40,141 72.4 13,198 30.1 10,036 12.5
Graph 14: Foreign Residential Real Estate Approvals
Number of Percentage of
State approvals approvals FIRB Annual Report
45,000
VIC 4,631 46.14%
40,000
NSW 2,340 23.32%
35,000
QLD 1,723 17.17%
30,000
WA 696 6.94%
25,000
SA 320 3.19%
20,000
ACT 189 1.88%
15,000
TAS 123 1.23%
10,000
NT 6 0.06%
5,000
Various (a) 8 0.08%
0
Total 10,036 100.00%
2013-14 2014-15 2015-16 2016-17 2017-18
20 Powerhousing AustraliaHousing affordability 2020 – The recent growth regulatory changes in key countries such as China
in new supply represented in this report was has seen a slow-down impacting the future pipeline
underpinned by this surge in foreign investment of new developments in Australia. Whilst there is
into new residential real estate. These figures strong potential for an investment vehicle to channel
show a significant decline that is partially related foreign interest into equity funds, which are simpler
to legislation intending that foreign investment be investments, there will be a reduction of supply until
channelled into new residential developments, but these new vehicles come online.
Building Approvals
Graph 15: Building Approvals ABS 8731.0 (Aug 2019)
300,000
250,000
200,000
150,000
100,000
50,000
0
99
01
03
05
07
09
11
13
15
17
19
g
g
g
g
g
g
g
g
g
g
g
Au
Au
Au
Au
Au
Au
Au
Au
Au
Au
Au
Building approvals indicate a pipeline of dwellings The graph above demonstrates the sharp drop
that are approved but yet to be built. As at the 12 in building approvals, first dipping below 200,000
months ending August 2019, around 180,000 homes approvals in the 12 months ending April this year. If
were approved.23 This is a stark contrast to the approvals for the next 12 months were to reflect the
figure from 12 months earlier, which sat at just over July and August figures, we would see a low of circa
229,000 dwellings approved – a difference of nearly 155,000 approvals – a number which hasn’t been
50,000 dwellings that will not be built. seen since 2012.
Australian Affordable Housing Report 2020 21YTD Dwellings Approved Housing affordability 2020 – Our previous
Australian Affordable Housing Report: Environmental
Aug-09 135,555
Scan suggested building approvals may slow over
Aug-10 181,081 the next year, and the current building approval
figures bode poorly for the future building supply. We
Aug-11 165,617
expect to soon see a corresponding drop in building
Aug-12 146,882 completions, which will increase buyer competition
Aug-13 170,053 and potentially reverse recent affordability gains.
Aug-14 206,021
Aug-15 234,612
Aug-16 242,267
Aug-17 217,459
Aug-18 229,333
Aug-19 179,632
Building Activity
Graph 16: Building Activity ABS 8752.0 (Jun 2019)
250,000
200,000
150,000
100,000
50,000
––Commencements ––Completions
0
00
01
02
03
04
05
Ju 6
7
08
09
10
11
12
13
14
15
16
17
18
19
0
01
n
n
n
n
n
n
n
n
n
n
n
n
n
n
n
n
n
n
n
Ju
Ju
Ju
Ju
Ju
Ju
Ju
Ju
Ju
Ju
Ju
Ju
Ju
Ju
Ju
Ju
Ju
Ju
Ju
n
Figures released by the ABS clearly indicate that new house delivered, we may lose around 1.4 million
the decline in housing activity, which threatens to future trade and paraprofessional engagements
impact the economy across jobs, tax and demand- as the number of new homes drop by circa 35,000
equivalent supply, is gathering pace. Dwelling unit dwellings on the previous year.
commencements dropped by 20% year-on-year from
Meanwhile, dwelling completions increased slightly
230,522 commencements a year ago to 196,867
in the order of about 4,000 dwellings, up to 217,448
for the year ending 30 June 2019.24 With around
dwellings, well above the 20-year average of circa
40 trades and sub-trades receiving work from every
165,000 dwellings completed.
22 Powerhousing AustraliaHousing affordability 2020 – Despite a rise in the GFC due to high land costs, slowing migration
building completions across the last 12 months, and falling investor demand.
with commencements and approvals declining
The report indicates that national residential
sharply we can expect to see a subsequent drop in
commencements will trough at 152,900 dwellings
dwelling completions going forward, and a resultant
which, if correct, would see commencements drop
tightening of the availability of homes in Australia.
by just under 80,000 dwellings per annum from
The impact to the economy of the loss of related
peak. This is to say that the fourth largest economy
trades and sub-trades will further impact on the
in the world, which is equivalent to the state of
ability of those people to enter the housing market or
California’s total supply production of 77,000 annual
service ongoing mortgages.
new dwellings, would disappear out of the Australian
new housing pipeline.
Housing Forecasts
The graph below predicts a marked drop in dwelling
The July 2019 Building in Australia 2019-2034 report commencements in almost every state, with a
from BIS Oxford Economics25 predicts Australian correction of 33%.26
building activity is set for its sharpest decline since
Graph 17: Total Dwellings Commencements by State (July)
80,000
––NSW ––VIC ––QLD ––SA ––WA
70,000
60,000
Number (MAT)
50,000
40,000
30,000
20,000
10,000
0
2006 2008 2010 2012 2014 2016 2018 2020 2022 2024
FY
Source: BIS Oxford Economics 2019, cited in Property Observer 201927
Housing affordability 2020 – The BIS Oxford requirements of population growth and a reduction
Economics forecast shows Australia slipping in the average number of people in a household. If
between 20-30,000 homes fewer than the national Australia fails to maintain that average build rate
demand rate for housing. BIS Oxford Economics in into the next five years, there is a risk in reversing
2018 calculated the need for an underlying demand affordability gains as housing demand fails to be
for building 195,800 dwellings to be built per met.
annum on average over the next five years to meet
Powerhousing Australia: Environmental Scan 2019 23Artist’s Impression – Evolve Housing, Newcastle development
05
NATIONAL AFFORDABILITY MEASURES
Median prices
Nationally, the median value of an Australian dwelling with the combined regional median of $376,000.
(ie houses and units combined) was $521,160 at the
Amongst the capital cities, values are the highest in
end of August 2019; an increase of $66,640 (14.7%) Sydney and Melbourne at $790,000 and $627,000
increase from five years ago. Of course there is a respectively, while values are the lowest in Darwin
substantial variation in the typical value of a dwelling ($388,200) and Adelaide ($428,200). Areas with
across the regions of the country. Broadly, the median higher dwelling values generally reflect stronger
dwelling values across the combined capital cities housing demand and scarcer housing supply relative
was $597,000 at the end of August 2019, compared to demand.
24 Powerhousing AustraliaValues also vary materially between the broad reflects the increasing value of land and the lower
product types. Nationally, there is a $43,400 supply levels relative to units. The one exception is
difference between the median house value and Sydney, where unit values (+17.7%) have shown a
median unit value. The difference between product slightly higher gain relative to house values (+17.3%)
types is the most significant in Canberra where the over the past five years.
premium for houses over units, based on the median
The stronger performance across the unit sector in
value, is $239,800, however every capital city shows
Sydney may reflect the growing level of demand for
a difference of at least $100,000 between the median
medium to high density housing options as housing
house value and median unit value.
affordability pressures push more buyers towards a
Most cities have seen a larger gain in house values higher density housing option.
over the past five years than unit values, which
Median dwelling price
National $521,157
Capital City $597,072
Canberra $592,870
Darwin $388,232
Hobart $465,535
Perth $437,558
Adelaide $428,203
Brisbane $485,493
Melbourne $626,703
Sydney $790,072
Australian Affordable Housing Report 2020 25Median house price
National $533,303
Capital City $626,648
Canberra $665,887
Darwin $470,009
Hobart $498,734
Perth $454,774
Adelaide $462,945
Brisbane $533,101
Melbourne $716,542
Sydney $877,220
Median unit price
National $489,880
Capital City $538,708
Canberra $426,088
Darwin $289,687
Hobart $375,831
Perth $345,311
Adelaide $322,142
Brisbane $375,423
Melbourne $540,056
Sydney $699,126
Source: CoreLogic, September 2019
26 Powerhousing Australia20-year dwelling house and unit snapshot 1999-2019
Sydney Melbourne Brisbane Adelaide Perth Hobart Darwin Canberra Capital city National
Month Dwellings Dwellings Dwellings Dwellings Dwellings Dwellings Dwellings Dwellings Dwellings Dwellings
Aug-99 $260,361 $171,359 $140,039 $116,973 $141,686 $104,661 $159,278 $139,649 $167,535 $147,643
Aug-04 $440,700 $299,709 $297,495 $248,898 $253,370 $233,865 $204,295 $333,539 $320,567 $295,693
5 yr change 69.3% 74.9% 112.4% 112.8% 78.8% 123.5% 28.3% 138.8% 91.3% 100.3%
Aug-09 $459,474 $420,926 $421,053 $350,217 $445,851 $312,648 $445,535 $449,973 $425,312 $390,583
5 yr change 4.3% 40.4% 41.5% 40.7% 76.0% 33.7% 118.1% 34.9% 32.7% 32.1%
Aug-14 $656,844 $511,846 $452,562 $388,718 $537,666 $315,237 $527,289 $485,030 $532,159 $454,515
5 yr change 43.0% 21.6% 7.5% 11.0% 20.6% 0.8% 18.3% 7.8% 25.1% 16.4%
Aug-19 $790,072 $626,703 $485,493 $428,203 $437,558 $465,535 $388,232 $592,870 $597,072 $521,157
5 yr change 20.3% 22.4% 7.3% 10.2% -18.6% 47.7% -26.4% 22.2% 12.2% 14.7%
Sydney Melbourne Brisbane Adelaide Perth Hobart Darwin Canberra Capital city National
Month Houses Houses Houses Houses Houses Houses Houses Houses Houses Houses
Aug-99 $267,005 $178,919 $139,809 $123,640 $145,468 $109,094 $174,436 $146,679 $164,162 $143,588
Aug-04 $498,775 $324,010 $311,355 $263,737 $260,930 $249,711 $239,183 $354,533 $332,464 $300,966
5 yr change 86.8% 81.1% 122.7% 113.3% 79.4% 128.9% 37.1% 141.7% 102.5% 109.6%
Aug-09 $503,660 $451,489 $439,237 $368,532 $460,050 $325,132 $479,306 $482,734 $445,612 $401,793
5 yr change 1.0% 39.3% 41.1% 39.7% 76.3% 30.2% 100.4% 36.2% 34.0% 33.5%
Aug-14 $747,986 $571,571 $479,741 $412,905 $561,825 $328,732 $587,720 $521,778 $557,068 $460,817
5 yr change 48.5% 26.6% 9.2% 12.0% 22.1% 1.1% 22.6% 8.1% 25.0% 14.7%
Aug-19 $877,220 $716,542 $533,101 $462,945 $454,774 $498,734 $470,009 $665,887 $626,648 $533,303
5 yr change 17.3% 25.4% 11.1% 12.1% -19.1% 51.7% -20.0% 27.6% 12.5% 15.7%
Sydney Melbourne Brisbane Adelaide Perth Hobart Darwin Canberra Capital city National
Month Units Units Units Units Units Units Units Units Units Units
Aug-99 $254,951 $161,506 $140,827 $92,681 $121,248 $85,650 $134,620 $128,860 $177,329 $161,480
Aug-04 $378,702 $273,867 $250,173 $197,223 $210,965 $188,170 $167,330 $281,026 $294,749 $283,390
5 yr change 48.5% 69.6% 77.6% 112.8% 74.0% 119.7% 24.3% 118.1% 66.2% 75.5%
Aug-09 $417,964 $387,603 $367,477 $289,000 $374,156 $261,125 $362,607 $390,152 $384,644 $364,591
5 yr change 10.4% 41.5% 46.9% 46.5% 77.4% 38.8% 116.7% 38.8% 30.5% 28.7%
Aug-14 $593,768 $466,094 $388,421 $314,455 $452,673 $276,304 $436,901 $393,697 $490,119 $438,865
5 yr change 42.1% 20.3% 5.7% 8.8% 21.0% 5.8% 20.5% 0.9% 27.4% 20.4%
Aug-19 $699,126 $540,056 $375,423 $322,142 $345,311 $375,831 $289,687 $426,088 $538,708 $489,880
5 yr change 17.7% 15.9% -3.3% 2.4% -23.7% 36.0% -33.7% 8.2% 9.9% 11.6%
Source: CoreLogic, September 2019
Australian Affordable Housing Report 2020 27Value changes
Australia’s housing market has moved through a by 31% since peaking and Perth values are down
broad-based downturn, with dwelling values nationally 21%. Both regions are suffering from weak economic
falling 8.4% between October 2017 and what appears conditions following the peak in resource sector
to be the market trough in June 2019. The most related infrastructure investment.
recent data to the end of August shows housing
While the ongoing decline in Perth and Darwin
values have started to recover, however the trends
home values can be explained by the soft economic
remain diverse around the country.
conditions and weak demographic trends, the
The sharpest downturn in housing values has been weakness in other housing markets can generally
evident in Sydney and Melbourne, where previously be explained by tougher credit policies leading to a
conditions were the strongest. Sydney dwelling values tightening in credit availability.
fell by 14.9% before finding a floor in May 2019, and
With mortgage rates tracking at the lowest level since
Melbourne values were down 11.1%. Since bottoming
the 1950s and a recent loosening in credit policies,
out, Sydney and Melbourne have been leading the
there is early evidence that housing markets are
market recovery, with housing values bouncing back
responding with buyer activity picking up and housing
more rapidly than other cities.
values starting to rise again. To date, the recovery
The only other capital city markets to record more trend is being led by Sydney and Melbourne, however
substantial falls in values than those in Sydney are most capital cities and regional markets are recording
Perth and Darwin, where the housing markets are in an easing in the rate of decline, or showing signs of
an entrenched downturn that has been running since subtle growth.
early-to-mid-2014. Darwin values have plummeted
Graph 18: Annual change in combined capital city dwelling values
20%
15%
10%
5% average annual
gain 1999 to 2019
0
-5%
-10%
Aug 99 Aug 04 Aug 09 Aug 14 Aug 19
Source: CoreLogic, September 2019
28 Powerhousing AustraliaSales by price point
Although values have generally declined over the past trending lower since 2014, are the only cities where
few years, most regions of Australia are still seeing the proportion of both house and unit sales less than
a much lower proportion of dwellings sell for less $400,000 is higher than five years ago. Brisbane’s
than $400,000 relative to five years ago. Only 16% of unit market, where an oversupply of apartments has
capital city houses sold for less than $400,000 over weighed on values, is also recording more sales under
the 12 months ending August, while 27% of units sold $400,000 now than five years ago.
for less than $400,000.
Every other capital city region has seen a reduction
Sydney and Melbourne are the only capital cities in property sales under $400,000, with the most
where less than 5% of houses sold for under significant decline in Hobart. Hobart housing values
$400,000 last year. have surged higher over the past few years which has
resulted in more significant deterioration in housing
Darwin and Perth, where dwelling values have been
affordability relative to other cities.
% sold under $400K
City Housing type 2014 2019
Houses 24.0% 5.7%
Australian Capital Territory
Units 43.8% 37.7%
Houses 47.1% 37.4%
Greater Adelaide
Units 78.6% 68.0%
Houses 34.1% 23.6%
Greater Brisbane
Units 47.1% 54.6%
Houses 20.5% 28.6%
Greater Darwin
Units 32.9% 72.2%
Houses 62.9% 33.7%
Greater Hobart
Units 81.2% 60.3%
Houses 26.4% 3.0%
Greater Melbourne
Units 31.0% 22.3%
Houses 19.4% 31.5%
Greater Perth
Units 37.9% 55.4%
Houses 13.5% 3.5%
Greater Sydney
Units 18.7% 7.1%
Houses 25.1% 15.7%
Combined Capitals
Units 30.6% 27.3%
Source: CoreLogic, September 2019
Australian Affordable Housing Report 2020 29Median Price by Postcode
White spaces indicate areas where there is not enough data to calculate a median, such as postcodes that are
primarily industrial estates parks, airports or mostly rural properties. This is more common on the unit market
maps where there are areas with either very small unit markets or no units.
$1m+                     Inner ring: 10km from city centre
>=$800k and =$600k and =$400k and$1m+ Inner ring: 10km from city centre
>=$800k and =$600k and =$400k andAffordability measures
One of the best ways to measure housing affordability actually improved over the last few years as dwelling
is to examine the ratio of household incomes to values have trended lower and incomes have edged
dwelling values. Comparing the median gross annual higher. Sydney’s dwelling value to income ratio
household income with the median dwelling value for peaked at 9.8 times income over the September
regions around Australia highlights the affordability quarter of 2017 and Melbourne’s ratio peaked at 8.5
challenge in markets like Sydney and Melbourne. times during the December quarter of 2017.
Sydney dwelling values were 8.4 times higher relative
At the other end of the housing affordability spectrum
to gross annual household incomes at the end of
is Darwin, Canberra and Perth where dwelling values
March 2019 and Melbourne values are 7.6 times
are only 3.4, 5.1 and 5.2 times higher than gross
higher.
household incomes.
Despite the high ratios, housing affordability has
% of household
income required to % of household
service an 80% LVR income required to
Region Price to income ratio mortgage rent a home
Sydney 8.4 45.7% 32.6%
Melbourne 7.6 41.2% 28.7%
Brisbane 5.8 31.6% 26.9%
Adelaide 6.3 34.1% 29.5%
Perth 5.2 28.2% 23.5%
Hobart 6.7 36.6% 34.2%
Darwin 3.4 18.5% 20.3%
Australian Capital Territory 5.1 27.8% 24.7%
Rest of NSW 7.2 39.0% 33.6%
Rest of Vic. 5.9 32.0% 28.8%
Rest of Qld 5.4 29.3% 30.9%
Rest of SA 4.2 22.9% 25.9%
Rest of WA 4.1 22.4% 24.8%
Rest of Tas. 5.2 28.5% 30.0%
Rest of NT 5.0 27.0% 33.1%
Combined Capital Regions 6.7 36.6% 27.1%
Combined Regional 5.2 28.0% 31.6%
National 6.5 35.4% 28.2%
As at March 2019
Source: CoreLogic, September 2019
32 Powerhousing AustraliaWith mortgage rates at the lowest level since the towards servicing a mortgage.
1950s, mortgage serviceability is actually healthier
For renters, the proportion of household income
now that it has been over several years. In fact,
required to pay rent each week is substantially
a homebuyer with a 20% deposit purchasing the
lower than relative to paying a mortgage. Rents
median prices capital city dwelling is dedicating,
have generally risen at a slower pace than incomes,
on average, 36.6% of their gross annual household
providing some improvement to rental affordability.
income towards servicing a mortgage which is similar
Nationally, households are dedicating 28.2% of their
the level fifteen years ago.
gross household income towards rental payments,
Despite such low interest rates and drop in housing with this ratio highest in Hobart (34.2%) where rental
values, households in Sydney and Melbourne still conditions have been much tighter.
need to dedicate more than 40% of their income
Rental Affordability Index
The biannually-published Rental Affordability Index28 sharehouses, rents are considered largely untenable.
aims to illustrate the state of rental affordability for
The least affordable capital city in Australia continues
vulnerable groups by considering the cost of rent
to be Hobart, with an RAI dropping to 101, just 1 unit
against income. The report shows that 44% of low
away from the ‘Unaffordable Rents’ category. With an
income households are currently in housing stress, an
RAI of 113, Sydney is the second-least affordable city.
increase from 35% in 2008.
The report notes ‘Investors have pushed out would-be
For lower income households throughout the
home owners, so more households with middle to
country, including single male households, single
higher incomes are renting for longer. This impacts
mothers, single and coupled pensioners and student
lower income renters by keeping rents higher’.29
Share of household
Region RAI at Q2 2018 income spent on rent Relative unaffordability
Greater Sydney 113 27% Moderately unaffordable rents
Rest of NSW 122 25% Unaffordable rents
Greater Brisbane 123 24% Acceptable rents
Rest of QLD 123 24% Acceptable rents
Greater Adelaide 114 26% Moderately unaffordable rents
Rest of SA 133 23% Acceptable rents
Greater Hobart 101 30% Moderately unaffordable rents
Rest of TAS 121 25% Acceptable rents
Greater Melbourne 127 24% Acceptable rents
Rest of VIC 124 24% Acceptable rents
Greater Perth 144 21% Acceptable rents
Rest of WA 157 19% Acceptable rents
ACT 128 24% Acceptable rents
Australian Affordable Housing Report 2020 33Anglicare Australia Rental Affordability Snapshot
The latest Anglicare Australia Rental Affordability The report calls on government to recommit to social
Snapshot describes the rental crisis as ‘a nightmare housing, noting that older people on low incomes
for many renters’.30 The survey of over 69,000 private – particularly older women – retire into rental
rental listings in Australia measures affordability uncertainty. It notes that for people earning minimum
using the widely-accepted 30% of income benchmark. wage struggling to find housing, the minimum wage
has not kept pace with the rising cost of living. With
Of the properties surveyed:
the high housing prices, people on lower incomes
• Only two properties were affordable for a single looking for rentals are also competing with people
person on Youth Allowance or Newstart. on higher incomes who are locked out of the
• Only 3% of rentals were affordable for a couple on homeownership.
the aged pension, and 1% for single pensioners.
• Around 2% of rentals were affordable to a single
person working fulltime on the minimum wage.
34 P Southern Cross Housing – construction providing job opportunities in NowraCity West Housing - Lisa Ervasti, Zetland Resident
06 SUMMARY
Affordability indicators show that the housing
affordability challenge is not dissipating despite the
government-backed housing has been favourable as
shown for over 30 years in the US where tax credit
average mortgage coming down, with little flow- structures and community reinvestment legislation
through to renters and less impact on those seeking motivates the largest investment bankers such as
a rental that is proportionately affordable to income. Morgan Stanley to work with intermediaries such
as the Local Initiatives Support Corporation (LISC)
One of the key indicators of this report is the
and foundations of organisations such as the
building approval, commencement and completion
Chan Zuckerberg Initiative to support social impact
pipeline which, over the next 24 months, will
outcomes.
contract to impact the balance between supply
actually finally meeting annual demand as it has Engaging the wave of capital that is looking for those
done over the past three years. long-term safe harbours is critical as shown with the
US experience since 1986, in which the Low Income
As supply contracts, the ability of the market to
Housing Tax Credit is seeing up to 8% of all their
supply enough dwellings each year to have a
national housing delivery being affordable housing,
sustained impact on pricing also falls away. This
underpinning housing delivery in the periods of slow
means that any meaningful impact will be lost if the
demand.
trough is not a shallow one.
The other lever impacting housing demand is that of
Whilst there have been forecasts made in the
seniors’ housing and the baby boomers transitioning
previous version of the Australian Affordable
from current housing into suitable accommodation,
Housing Report of around 180,000 dwellings
which will see a shift in housing in the new decade.
being the bottom of the cycle, the latest building
approvals, if forecast forward, show that Australia One thing for certain is that what drives and
will approve less than this amount in F2021. Not all underpins the housing market in Australia at the
approvals are built so there is an expectation that start of this next decade will be different to what it
completions around this time will bottom out at started out as.
around 170,000 dwellings – that is, if there is not
Affordable housing and the emergence of the
a further drop in commencements beyond this as
global investors who seek to invest in social impact
indicated, or unless there some of the markets of
will have more options. Whilst there has been
housing are activated to develop more housing.
normalisation of investment into affordable housing
With first homebuyers, investors and particularly for some time, the three remaining International
foreign investors having participated in seeing Housing Partnership countries of UK, Canada and
Australian housing commencements skyrocket Australia all opened up new investment issues for
to record levels, their participation in a rally to debt. The next step will be equity.
see numbers of dwellings bottom out at 170,000
Government engagement in housing has become
remains uncertain. What would motivate their
a national focus with four federal ministers now
re-entry into the Australian housing market is
having some responsibility for the needs of this
uncertain.
critical component of the economic and social
International investment into safe, long-term, fabric of the country.
Australian Affordable Housing Report 2020 35You can also read