2020 CONTAINMENT MEASURES, EMPLOYMENT AND THE SPREAD OF COVID-19 IN SPANISH MUNICIPALITIES
←
→
Page content transcription
If your browser does not render page correctly, please read the page content below
CONTAINMENT MEASURES, EMPLOYMENT
AND THE SPREAD OF COVID-19                   2020
IN SPANISH MUNICIPALITIES

Documentos Ocasionales
N.º 2022

Eduardo Gutiérrez and Enrique Moral-Benito
CONTAINMENT MEASURES, EMPLOYMENT AND THE SPREAD OF COVID-19
IN SPANISH MUNICIPALITIES
CONTAINMENT MEASURES, EMPLOYMENT AND THE SPREAD
OF COVID-19 IN SPANISH MUNICIPALITIES

Eduardo Gutiérrez and Enrique Moral-Benito
banco de españa

Documentos Ocasionales. N.º 2022
2020
The Occasional Paper Series seeks to disseminate work conducted at the Banco de España, in the
performance of its functions, that may be of general interest.

The opinions and analyses in the Occasional Paper Series are the responsibility of the authors and, therefore,
do not necessarily coincide with those of the Banco de España or the Eurosystem.

The Banco de España disseminates its main reports and most of its publications via the Internet on its
website at: http://www.bde.es.

Reproduction for educational and non-commercial purposes is permitted provided that the source is
acknowledged.

© BANCO DE ESPAÑA, Madrid, 2020

ISSN: 1696-2230 (on-line edition)
Abstract

In order to curb the advance of COVID-19, Royal Decree-Law 10/2020 of 29 March 2020
stipulated the temporary shutdown of all activities considered non-essential between
30 March and 9 April 2020. This paper uses municipal-level information to quantify the
short-term effects of this measure both on employment and on containing the pandemic.
Specifically, we analyse the relationship between the share of firms forced to shut down in
each municipality and changes in Social Security registrations along with new COVID-19
cases in April. The results suggest that those municipalities most affected by the non-
essential activity shutdown endured higher reductions in employment but, at the same
time, they also witnessed a lower propagation of the pandemic during April. Finally,
other characteristics such as ageing, colder temperatures, higher population density and
proximity to the provincial capital are found to be associated with a higher incidence of
COVID-19 at the municipality level.

Keywords: COVID-19, pandemic, employment, Spanish municipalities.

JEL classification: I1, J21, C53.
Resumen

Con el objetivo de contener el avance del Covid-19, el Real Decreto-ley 10/2020, del
29 de marzo, estableció el cese de toda actividad considerada como no esencial entre
el 30 de marzo y el 9 de abril de 2020, ambos inclusive. Este documento explota información
a escala municipal para cuantificar el impacto de corto plazo que ha tenido esta medida,
tanto sobre el empleo como sobre la contención de la pandemia. En concreto, el peso de
las actividades no esenciales en cada municipio se relaciona con la evolución de la afiliación
a la Seguridad Social y con los nuevos casos de Covid-19 diagnosticados a lo largo del
mes de abril. Los resultados sugieren que aquellos municipios más afectados por el cese
de las actividades no esenciales habrían sufrido mayores pérdidas de empleo, pero, a la
vez, habrían experimentado una propagación menos virulenta de la pandemia durante el
mes de abril. Finalmente, otras características, como una población más envejecida, unas
temperaturas más frías, una densidad de población más elevada o una mayor cercanía
a la capital de la provincia, también se asocian a una mayor incidencia del Covid-19 a
escala municipal.

Palabras clave: Covid-19, pandemia, empleo, municipios españoles.

Códigos JEL: I1, J21, C53.
Contents

Abstract    5

Resumen      6

1   Introduction      8

2   Data    10

3   Methodology and results     13

    3.1    Containment measures and employment     13
    3.2    Containment measures and the pandemic    16

4   Final considerations   19

References       20
1 Introduction
As COVID-19 spread across Spain, a series of measures were adopted by the authorities
aimed at mitigating the health effects of the pandemic. Specifically, on 14 March, the
Government declared a state of alert and announced lockdown measures, ordering people
to remain in their homes and the mandatory shutdown of certain sectors of activity such
as accommodation and food services. Yet the rapid increase in the number of infections
led to further stricter measures, embodied in Royal Decree-Law 10/2020 of 29 March 2020
which ordered the shutdown of all non-essential activity between 30 March and 9 April
2020, both inclusive.
This paper aims to quantify the short-term impact of the temporary shutdown of
non-essential activity both on economic activity and the spread of COVID-19. For that
purpose, we use the differences across municipalities in the suspension of non-essential
activity – or sectoral shutdowns – mandated in Royal Decree-Law 10/20201 to estimate the
relationship with the monthly change in Social Security registrations and with the number
of new COVID-19 cases diagnosed in each municipality. The findings show that although
the shutdown of non-essential activity had a negative impact on employment in the short
term, it also made a considerable contribution to mitigating the spread of the pandemic.
According to these findings, up to 30 April, an increase of 100 percentage points (pp) in
sectoral shutdowns (equivalent to the difference between the municipality least affected and
the municipality most affected) would reduce municipal-level employment growth by 21 pp.
However, the findings also show that this increase in the shutdown of non-essential activity
would have a positive effect in terms of health, with an estimated decline in infection of two
cases per 100 inhabitants.2
The analysis presented here also casts light on other determinants that may have
contributed to the spread of COVID-19 in the different municipalities during the most acute phase
of the pandemic in Spain. Specifically, those municipalities that were hit hardest by the pandemic
present lower temperatures, higher population density, greater proximity to a provincial capital
and an older population. These findings are in line with the international evidence available. For
example, for the United States, Desmet and Wacziarg (2020) find that population density and
population ageing largely explain the incidence of the virus at county level.3
Lastly, it should be noted that the short-term impact documented in this paper may
not be indicative of the long-term economic and health effects of the containment measures.
1 The National Statistics Institute (INE) has published municipal-level statistics on the share of non-essential activity in
each municipality, drawing on the Central Companies Directory (DIRCE). See the technical note (Spanish version only)
at https://www.ine.es/covid/nota_tecnica_dirce.pdf.
2 hese findings corroborate, for Spain, the international evidence available. For example, Askitas et al. (2020) find that
T
measures such as limiting gatherings or closing workplaces played a very significant part not only in containing the
pandemic but also in the deterioration of the economic situation in those countries where such measures were introduced,
at least in the short term.
3 Also, using county-level death rates in the United States, Knittel and Ozaltun (2020) find a positive correlation with
ageing and with the use of public transport.
BANCO DE ESPAÑA 8 DOCUMENTO OCASIONAL N.º 2022Indeed, the literature contains evidence of the long-term economic and health effects of
various containment measures drawing on the experience of the 1918 influenza pandemic in
the United States that contrasts with the short-term impact identified in this paper. In terms
of the economic effects, these studies find that the containment measures had a positive
impact on economic activity in the long term (see Correia et al., 2020). The reason being
that had containment measures not been adopted, the pandemic could have ultimately
affected a high proportion of workers in strategic industries, such as transport or energy,
with significant adverse consequences for the local economy (see Bodenstein et al., 2020). In
terms of the impact on health, Barro (2020) shows that the containment measures adopted
in the United States in 1918 would not have been effective long term, even though they
were effective in flattening the curve in terms of deaths in the short term. This is because
the measures were too short-lived (for instance, the ban on public gatherings lasted 36 days
on average) and the virus spread rapidly again once the restrictions were lifted. Accordingly,
it would be interesting to monitor these developments as the necessary municipal-level data
become available to researchers.
Below we present in more detail the empirical exercises performed to obtain the
findings described in this introduction. Section 2 outlines the different municipal-level
data sources used in the analysis. In section 3 we explain the econometric methodology
considered and discuss the effects identified by the different estimation exercises. Lastly,
in section 4, we summarise the main conclusions of the analysis and outline a number of
suggestions for possible COVID-19 containment strategies drawing on the international
evidence available.
BANCO DE ESPAÑA 9 DOCUMENTO OCASIONAL N.º 20222 Data
The main variable of interest in this paper is the percentage of firms in each municipality that
do not provide essential services, in accordance with INE data drawing on DIRCE data.4
This information provides, for every Spanish municipality, a highly accurate indicator of the
percentage of economic activity that was affected by the lockdown measures announced in
Royal Decree-Law 10/2020 of 29 March 2020 which ordered the shutdown of all non-essential
activity between 30 March and 9 April. Below we refer to this indicator as sectoral shutdowns
at municipal level. Table 1 shows that in the 8,091 municipalities with business activity, 21%
of firms were obliged to shut down. In some essentially agricultural municipalities no firms
were affected by the sectoral shutdowns, while in the most vulnerable municipality 100% of
firms were affected. These differences allow us to identify the effect of the larger or smaller
proportion of shutdowns on employment and on the spread of the pandemic at municipal
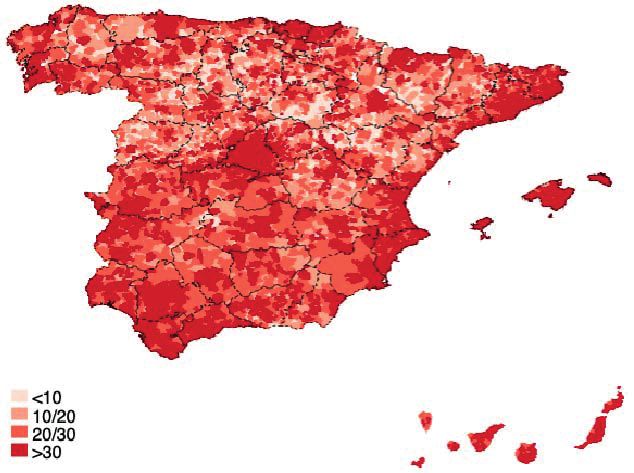
level. As Chart 1.1 shows, the municipalities with the highest incidence of shutdown of
activity are located in southern Spain and in the islands.
To assess how employment has evolved at municipal level, we use the month-end
Social Security registration figures. Specifically, we consider the rate of change between
Table 1
MUNICIPAL-LEVEL DESCRIPTIVE STATISTICS
Observations Average p5 p25 p75 p95
Sectoral shutdowns (% of firms) 8,091 21.0 0.0 10.5 31.9 40.5
Change in Social Security registrations March (%) 7,610 -3.1 -12.8 -5.4 0.0 3.6
Change in Social Security registrations March
and April (%) 7,606 -3.1 -13.5 -6.0 0.0 5.9
COVID-19 incidence
(cases per 1,000 inhabitants) (a) 2,140 3.8 0.0 0.7 4.9 11.1
COVID-19 incidence April
(cases per 1,000 inhabitants) (b) 397 4.2 1.0 2.0 4.9 10.4
Temporary employment ratio (%) 7,178 26.5 0.0 13.1 35.8 63.3
Weight of agriculture (%) 7,191 16.0 0.7 4.7 24.0 42.9
Population density (inhabitants/km2) 8,093 176.6 1.5 4.7 54.7 634.9
Dependency ratio (pop. aged 65+/16-64) 8,098 50.5 17.1 28.8 64.2 106.4
Temperature (ºC) 8,008 12.7 9.1 11.1 14.5 16.9
Distance from provincial capital (km) 8,098 44.2 11.1 26.3 58.3 87.9
SOURCES: Banco de España, INE and Ministerio de Inclusión, Seguridad Social y Migraciones.
a Data from the municipalities of Andalusia, Asturias, Balearic Islands, Basque Country, Canary Islands, Cantabria, Catalonia, Madrid region and
Murcia region. No published data for municipalities of Murcia region with less than five cases.
b Data from the municipalities of Basque Country, Cantabria, Catalonia and Madrid region with at least ten cases detected up to 1 April.
4 or this purpose, the Spanish National Classification of Economic Activities (CNAE 2009) is used to identify the
F
activities that are classed as “essential” in Royal Decree-Law 10/2020 of 29 March 2020. See the technical note
(Spanish version only) at https://www.ine.es/covid/nota_tecnica_dirce.pdf. According to the DIRCE, firms numbered
3.36 million at 1 January 2019.
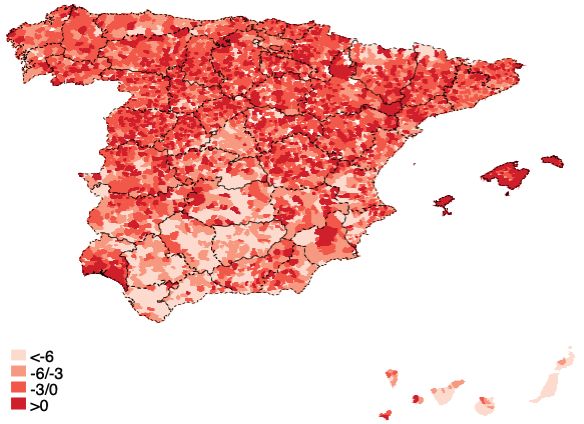
BANCO DE ESPAÑA 10 DOCUMENTO OCASIONAL N.º 2022Chart 1
SECTORAL SHUTDOWNS BY MUNICIPALITY AND RATE OF CHANGE OF SOCIAL SECURITY REGISTRATIONS
1 PERCENTAGE OF FIRMS PURSUING NON-ESSENTIAL ACTIVITIES 2 CHANGE IN SOCIAL SECURITY REGISTRATIONS BETWEEN FEBRUARY
AND APRIL 2020
< 10 < –6
10 / 20 –6 / –3
20 / 30 –3 / 0
> 30 >0
SOURCES: Banco de España, INE and Ministerio de Inclusión, Seguridad Social y Migraciones.
29 February and 30 April 2020. Table 1 shows that, on average, Social Security registrations
fell by 3.1% in that period, with very substantial differences across municipalities: in one in
four municipalities, Social Security registrations fell by more than 6%, while in one in 20 they
rose by more than 6%. By region, the pattern was very uneven (see Chart 1.2), with most
deterioration in employment in the Canary Islands and southern Spain.
Regarding the incidence of the virus, we consider the number of cases recorded
up to 30 April for those regions that provide this information at municipal level: Andalusia,
Asturias, Balearic Islands, Basque Country, Canary Islands, Cantabria, Catalonia, Madrid
and Murcia. Overall, these regions accounted for some 70% of cases, in line with their share
of the Spanish population. On average, the municipalities in these regions recorded 3.8 cases
per 1,000 inhabitants, while in around 15% of the municipalities no cases were recorded
(see Table 1). To investigate the part played by the sectoral shutdowns in containing the
spread of the virus, we also consider the number of new cases per 1,000 inhabitants
diagnosed in April. This information is only available for 397 municipalities in the Basque
Country, Cantabria, Catalonia and the Madrid region, accounting for 35% of the Spanish
population.5 The average incidence of new COVID-19 infections in these municipalities
in April was 4.2 cases per 1,000 inhabitants (see Table 1). Although the number of cases
5 iven the strict restrictions on mobility, we confine the sample to municipalities that had at least 10 cases on 1 April. Of the
G
new cases diagnosed in April in these regions, 95% correspond to municipalities that had more than 10 cases on 1 April.
BANCO DE ESPAÑA 11 DOCUMENTO OCASIONAL N.º 2022Chart 2
RELIABILITY OF THE COVID-19 CASES NOTIFIED BY THE REGIONS (a)
30
SOR
25
SEG
CORU
LUG
20 SAN
Cases notified (%)
VAL CIU
PON RIO
MEL CUE
ALA
GIR
15 AST TER
SAL ALB
NAV AVI
CAD CAN MAD
SEV BIZ
ALM GRA BAR GUA
10 CAC LLE BUR
VALL PAL TOL
OUR
TAR HUES ZAR
ZAM
HUE GIP
5
MUR JAE LEO
CEU MAL
ALI CAS
PALM BAD
0 BALCOR
0 2 4 6 8 10 12 14 16
Reported prevalence (%)
SOURCES: Banco de España and Escovid19data.
a COVID-19 cases by province notified by the regions at 11 May are compared with the results of the first round of the seroprevalence report drawn
up between 27 April and 11 May.
detected depends on each region’s testing capacity, there is a correlation of 84%6 between
our measure of incidence and the findings of the provincial level seroprevalence study
(see Chart 2).
Lastly, regarding other characteristics of the Spanish municipalities, the analysis
also considers the percentage of temporary employment7 and agricultural employment,
the population density measured in terms of inhabitants per km2, the dependency ratio
(population over 65 to population in the 16 to 64 age group), and also variables relating
to temperature and distance in kilometres from the provincial capital, calculated drawing
on WorldClim8 and GIS data, respectively. Table 1 shows the descriptive statistics of
these variables.
6 The correlation between our measure of incidence and the results of the seroprevalence study, considering only
provinces that publish municipal-level data on the incidence of COVID-19, is 81%.
7 he percentage of workers with temporary employment contracts in each municipality is obtained from the Central
T
Balance Sheet Data Office (CBSO) microdata which contain information on the percentage of temporary employment
at 900,000 firms in 2018. The correlation between workers registered with Social Security by municipality in March
2019 and municipal-level employment resulting from adding together employees in all firms in the municipality is 94%.
8 emperature refers to the annual average temperature measured in degrees Celsius (ºC). For more details on the
T
construction of this indicator, see https://www.worldclim.org/ and Oto-Peralías (2020a).
BANCO DE ESPAÑA 12 DOCUMENTO OCASIONAL N.º 20223 Methodology and results
As shown in Chart 3.1, there is a strong negative correlation between municipal exposure to
shutdowns of activity and employment growth between 29 February and 30 April. That is,
those municipalities with a higher percentage of firms that do not provide essential services
are estimated to have experienced a greater fall in Social Security registrations.9 Likewise,
Chart 3.2 shows the strong negative association between new COVID-19 cases diagnosed
in each municipality during April and the percentage of shutdowns of activity in late March
and early April. In other words, the spread of the virus during April is estimated to have been
more contained in those municipalities where the shutdown in economic activity and the
consequent decline in employment were most pronounced.
3.1 Containment measures and employment
In order to quantify the impact of the shutdown of non-essential activity on employment, we
performed a regression analysis between the rate of growth of Social Security registrations
and the percentage of firms which do not provide essential services in each municipality.
Chart 3
SECTORAL SHUTDOWNS BY MUNICIPALITY, INCIDENCE OF COVID-19 AND RATE OF CHANGE IN SOCIAL SECURITY
REGISTRATIONS
1 CHANGE IN SOCIAL SECURITY REGISTRATIONS BETWEEN FEBRUARY 2 INCIDENCE OF COVID-19 IN APRIL AND SHUTDOWNS BY MUNICIPALITY (a)
AND APRIL AND SHUTDOWNS BY MUNICIPALITY (a)
Incidence of COVID-19 (cases per 1,000 inhabitants)
0 8
Change in Social Security registrations (%)
-1 7
-2 6
-3 5
-4 4
-5 3
-6 2
0 10 20 30 40 50 25 30 35 40 45
Firms that do not provide essential services (%) Firms that do not provide essential services (%)
SOURCES: Banco de España, INE and Ministerio de Inclusión, Seguridad Social y Migraciones.
a The relationship between the percentage of firms that do not provide essential services and the rate of change in Social Security registrations
(Chart 3.1) and the incidence of COVID-19 in April (Chart 3.2) is shown through scatter diagrams for grouped data. Each point shows the
average of the x-axis and y-axis values within a group. The groups are defined as from 20 quantiles of the x variable.
9 pecifically, the correlation between the two variables stands at –27%. This figure contrasts with the much weaker
S
correlation of –3% at provincial level. Accordingly, as a result of the greater heterogeneity across Spanish municipalities,
the association between sectoral shutdowns and employment can be identified better. This association seems to be
masked at provincial level, where the weight of non-essential activity ranges from 22% to 40%, which is considerably
lower than at municipal level. We find municipalities where all firms have been able to continue their activity and others
where all productive activity has been suspended.
BANCO DE ESPAÑA 13 DOCUMENTO OCASIONAL N.º 2022Chart 2
RATE OF CHANGE IN SOCIAL SECURITY REGISTRATIONS AND CONTAINMENT MEASURES
February-March 2020 February-April 2020
(1) (2) (3) (4)
Sectoral shutdowns -0.103*** -0.186*** -0.110*** -0.211***
(s.e.) (0.015) (0.024) (0.016) (0.027)
Temporary employment ratio -0.020** -0.021*** -0.016* -0.017*
(s.e.) (0.008) (0.007) (0.01) (0.009)
# obs 6,535 6,535 6,535 6,535
R2 0.085 0.072 0.067 0.055
Province (fixed effect) Yes Yes Yes Yes
Estimation OLS 2SLS O LS 2SLS
SOURCE: Banco de España.
NOTE: *** p < 0.01, ** p < 0.05, * p < 0.1.
The regression includes fixed provincial effects, as well as the proportion of temporary
employment in the municipality, so as to take into account the fact that in municipalities
with a higher incidence of temporary employment, there may be larger falls in Social
Security registrations. The changes in registrations are analysed over two periods: first, from
29 February to 31 March 2020 and, subsequently, from 29 February to 30 April 2020.
In any event, the effect estimated by ordinary least squares (OLS) could be biased as
a result of the impact of temporary layoffs or short-time work arrangements (ERTEs by their
Spanish abbreviation). Specifically, municipalities with a greater presence of firms pursuing
non-essential activities (for example, travel and tourism firms) will show a greater incidence
of ERTEs and, consequently, registrations will be more favourable in relative terms since the
ERTEs are not recorded as falls in Social Security registrations. This would produce a positive
bias in the elasticity of shutdowns to employment, because the changes in employment
recorded would be less unfavourable, although the fall in activity would be sharper. To
attempt to correct this bias in the estimation, the weight of agricultural employment in the
municipality in 2011 is considered as an instrumental variable of the percentage of firms not
providing essential services and the model is estimated by using two-stage least squares
(2SLS). In other words, the weight of employment in agriculture is assumed to be negatively
related to the weight of non-essential activity because agriculture was considered an
essential activity. However, it is assumed that the weight of the agricultural sector in 2011
is not related to the use of ERTEs in 2020 insofar as the heterogeneity across municipalities
in this connection is due to the relative importance of the various non-agricultural branches
of industry and the services deemed essential or non-essential under Royal Decree-Law
10/2020 of 29 March 2020.
Table 2 shows the estimations of the impact of the sectoral shutdowns on Social
Security registrations. As can be seen, the percentage of firms not providing essential services
BANCO DE ESPAÑA 14 DOCUMENTO OCASIONAL N.º 2022Chart 3
CUMULATIVE INCIDENCE OF COVID-19 PER 1,000 INHABITANTS AS AT 30 APRIL AND MUNICIPAL CHARACTERISTICS
(1) (2) (3) (4) (5) (6) (7)
Sectoral shutdowns -0.006 -0.022 -0.011
(s.e.) (0.016) (0.019) (0.019)
Temperature -0.535*** -0.622*** -0.144**
(s.e.) (0.071) (0.073) (0.068)
Distance from provincial capital -0.550*** -0.472** -0.392***
(s.e.) (0.203) (0.219) (0.123)
Dependency ratio -0.007 -0.029* 0.043*
(s.e.) (0.014) (0.016) (0.022)
Population density 0.482*** 0.516*** 0.155*
(s.e.) (0.124) (0.131) (0.075)
# obs 2,140 2,140 2,140 2,140 2,140 2,140 2,140
R2 0.000 0.026 0.003 0.000 0.007 0.041 0.121
Province (fixed effect) No No No No No No Yes
SOURCE: Banco de España.
NOTE: *** p < 0.01, ** p < 0.05, * p < 0.1.
has a significant negative effect on monthly registrations, both in March (columns 1 and 2)
and in the figures recorded between March and April (columns 3 and 4).10 Furthermore, this
effect is substantially greater if the 2SLS approach is applied, which indicates a greater use
of ERTEs by municipalities with a higher proportion of non-essential activity. Thus, for each
1 pp increase in the weight of non-essential activity, the rate of growth of employment would
be approximately 2.1 pp lower in cumulative terms between March and April (column 4).
Lastly, the significant negative relationship between the incidence of temporary employment
in the municipality and Social Security registrations should be noted. This finding implies
that job destruction is more likely to affect workers with temporary employment contracts as
a result of Spain’s dual labour market.11
With regard to employment developments in subsequent months, Chart 4.1
replicates the two-stage least squares estimations in Table 3, using as a dependent variable
the cumulative change in the number of Social Security registrations from February to May
and June, as well as from February to March and April. The estimated impact of sectoral
shutdowns on the cumulative change in employment to May and June holds at a very similar
level to that estimated to April and has statistical significance of 99%. According to these
10 The results are robust if the year-on-year change in Social Security registrations is used as a dependent variable.
11 ther control variables were included in several robustness checks but they do not prove to be significant and,
O
therefore, they do not change the estimation of the coefficient of interest. Specifically, the following were included: the
dependency ratio, population density in the municipality, a political fragmentation indicator, distance from the provincial
capital, and binary variables defining the municipality as rural if it has less than 10,000 inhabitants and coastal if it is by
the sea. Lastly, the standard errors are calculated by using clusters at provincial level, i.e. by taking into account the
correlation in employment across various municipalities in the same province.
BANCO DE ESPAÑA 15 DOCUMENTO OCASIONAL N.º 2022Chart 4
RATE OF CHANGE IN SOCIAL SECURITY REGISTRATIONS IN 2019 AND 2020 AND CONTAINMENT MEASURES
1 EFFECT OF SECTORAL SHUTDOWNS ON RATE OF CHANGE 2 FALSIFICATION TEST. EFECT OF SECTORAL SHUTDOWNS ON RATE
IN SOCIAL SECURITY REGISTRATIONS (a) OF CHANGE IN SOCIAL SECURITY REGISTRATIONS A YEAR EARLIER (b)
Dependent variable: rate of change in registrations since February 2020 Dependent variable: rate of change in registrations since February 2019
0.15 0.15
0.10 0.10
0.05 0.05
0.00 0.00
-0.05 -0.05
-0.10 -0.10
-0.15 -0.15
-0.20 -0.20
-0.25 -0.25
-0.30 -0.30
Mar-20 Apr-20 May-20 Jun-20 Mar-19 Apr-19 May-19 Jun-19
SOURCE: Banco de España.
a The coefficients and 95% confidence interval of the two-stage least squares estimations of the impact of the sectoral shutdowns on Social Security
registrations between March and June 2020 with respect to February are shown.
b Falsification test consisting of estimating by two-stage least squares the impact of the sectoral shutdowns implemented in 2020 on Social Security
registrations between March and June 2019 with respect to February. The coefficients and 95% confidence interval are shown.
findings, a significant rebound effect is not observed in employment in those municipalities
which were initially hit hardest by sectoral shutdowns.12 Lastly, for the purpose of validating
our identification strategy, Chart 4.2 shows the results of a falsification test. Specifically,
the relationship between the weight of non-essential activity and employment is estimated
between March and June 2019. If the ratios estimated in Table 2 were due to the productive
structure of each municipality and not to the shutdown of non-essential activity per se, a very
similar relationship would be observed between the two variables also in 2019. This would
be the case, for example, if municipalities with a higher weight of accommodation and food
service activities show worse relative employment in these months, as they are also those
hit hardest by sectoral shutdowns. As expected, the ratios estimated are not significantly
different from zero and, consequently, we can conclude that the effects estimated for 2020
are not due to the existence of previous trends at municipal and sectoral level.
3.2 Containment measures and the pandemic
Although the sectoral shutdowns had a significant cost in terms of employment, they may
also be expected to have been effective in terms of containing the pandemic, as is suggested
by the association in Chart 3. In this respect, the available evidence indicates that, during
an epidemic, around 37% of infections occur in the workplace (see Ferguson et al., 2006);
12 In fact, the estimated impact of sectoral shutdowns on month-on-month rates in May and June is not statistically
significant.
BANCO DE ESPAÑA 16 DOCUMENTO OCASIONAL N.º 2022consequently lower economic activity would reduce the spread of COVID-19.13 Furthermore,
from a statistical standpoint, the degree to which each municipality is exposed to sectoral
shutdowns may be deemed exogenous to the unfolding of the pandemic, insofar as a
national decree shut down non-essential activity, irrespective of municipal heterogeneity
regarding the situation of the pandemic and economic structure.
In order to quantify the impact of the suspension of non-essential activity on the
spread of the virus, we estimate the relationship between the number of COVID-19 cases
diagnosed per 1,000 inhabitants recorded as at 30 April and the percentage of firms not
providing essential services in each municipality. Table 3 shows the bivariate relationship
of the cumulative incidence with each of the explanatory variables considered as possible
determinants of the incidence of COVID-19 in addition to sectoral shutdowns. Likewise,
column 7 shows the multivariate relationship, once the set of fixed provincial effects ensuring
comparability across municipalities belonging to the same province has been included in the
regression. In this way, possible biases triggered, inter alia, by possible differences in the
processing and notification of incidence data in each region are also avoided.
Before analysing the estimated impact of the sectoral shutdowns, note that
municipalities with lower cumulative incidence are expected to be those that are further
from the corresponding provincial capital and have a lower population density (inhabitants
per km2). This would suggest that the pandemic was less virulent in municipalities in rural
areas (the so-called “empty Spain”) since they generally have these characteristics.14
Additionally, there is greater cumulative incidence in municipalities with a lower average
temperature (see Oto-Peralías, 2020b). Lastly, the relationship estimated between
cumulative incidence and the dependency ratio is less conclusive. Although a higher
incidence is observed in municipalities with a younger population in column 6, the
relationship changes sign when fixed provincial effects are included in column 7.
The sectoral shutdown variable, which approximates the percentage of activity
suspended during confinement, does not show any significant relationship with cumulative
incidence as at 30 April. One possible explanation of this finding is that, as at 29 March, the
pandemic had spread to such an extent that the containment measures could not reverse
the trends recorded until then. In other words, the sectoral shutdowns could not have had
an effect on infections before 29 March. Therefore, in order to analyse the effectiveness of
the measure on containing the pandemic, it is more appropriate to consider as a dependent
variable the number of new cases diagnosed per 1,000 inhabitants in the weeks following the
entry into force of the decree that shut down non-essential activity. Unfortunately, the new
cases diagnosed in April are only available for a small number of municipalities – specifically,
13 In fact, according to the seroprevalence study, the average incidence of COVID-19 among workers in May was higher
than among the unemployed (5.8% compared with 3.3%).
14 or more information about the characteristics and location of “empty Spain”, see Gutiérrez et al. (2020a) and Gutiérrez
F
et al. (2020b).
BANCO DE ESPAÑA 17 DOCUMENTO OCASIONAL N.º 2022Chart 4
NEW COVID-19 CASES PER 1,000 INHABITANTS IN APRIL AND MUNICIPAL CHARACTERISTICS
(1) (2) (3) (4) (5) (6) (7)
Sectoral shutdowns -0.166*** -0.165*** -0.200*
(s.e.) (0.041) (0.041) (0.100)
Temperature -0.208* -0.103 -0.246*
(s.e.) (0.122) (0.131) (0.112)
Distance from provincial
0.256 0.050 -0.089
capital (ln)
(s.e.) (0.200) (0.208) (0.135)
Dependency ratio 0.119*** 0.116*** 0.126***
(s.e.) (0.027) (0.028) (0.033)
Population density -0.079 -0.034 -0.075
(s.e.) (0.082) (0.089) (0.074)
# obs 397 397 397 397 397 397 397
R2 0.040 0.007 0.004 0.046 0.002 0.091 0.138
Province (fixed effect) No No No No No No Yes
SOURCE: Banco de España.
NOTE: *** p < 0.01, ** p < 0.05, * p < 0.1.
397 municipalities in the Basque Country, Cantabria, Catalonia and the Madrid region15 – but
which cover 35% of the Spanish population.
Table 4 shows the results of the relationship estimated between the new cases
diagnosed in April and the shutdowns of non-essential activity. As shown in the cases recorded
up to 30 April in Table 3, the incidence of the virus in April was more pronounced in municipalities
with lower temperatures and with a higher dependency ratio (an older population). Note that, in
this case, the positive relationship between age and new cases diagnosed in April is conclusive
since the ratio estimated is positive and significant in all specifications. However, the variables
of distance from the provincial capital16 and population density are less significant when
explaining new cases, as is to be expected against a backdrop of severe mobility restrictions.
In fact, during confinement, travelling to work was one of the few activities that warranted
mobility. Thus, Table 4 shows that the number of new cases diagnosed in April was substantially
lower17 in the municipalities where sectoral shutdowns were more stringent (owing to the high
percentage of firms which do not provide essential services). Indeed, we estimate that a
1 pp increase in the activity shutdown would entail 200 fewer cases per million inhabitants.
15 total of 58% of the new COVID-19 cases detected in April belong to these four regions. Furthermore, as
A
discussed in the data section, only those municipalities that recorded at least ten cases of COVID-19 as at 1 April
were included. In any event, 95% of the new cases diagnosed in April in these regions belong to municipalities
which as at 1 April had more than ten cases.
16 Although distance from Madrid was deemed a relevant factor in studies based on cross-provincial comparisons
(Oto-Peralías, 2020b), it is not a significant determinant in the cross-municipal comparisons in the same province on
which identification rests in this analysis.
17 nlike the case of the monthly series of municipal Social Security registrations, the difficulty in building uniform
U
municipal series on the incidence of COVID-19 retrospectively prevents the impact recorded up until May, June and/
or July from being estimated.
BANCO DE ESPAÑA 18 DOCUMENTO OCASIONAL N.º 20224 Final considerations
The analysis presented here shows that the shutdown of non-essential activity in early April
mitigated the spread of the pandemic in the short term. However, the economic impact in
terms of job destruction in the short term was also significant. Indeed, the municipalities that
were most exposed to non-essential activity and which, therefore, saw a greater reduction
in their economic activity, recorded a smaller increase in the incidence of COVID-19 in April,
but also a worse employment performance according to Social Security records.
Looking ahead, and considering the socioeconomic costs of the containment
measures in the short term, it would be advisable to step up the testing and tracing
capacity significantly.18 Exhaustive testing and tracing would make it possible to isolate
diagnosed cases and their contacts, allowing potential local outbreaks to be immediately
contained.19 Although this could be the backbone of a containment strategy, there are other
supplementary measures that have proved effective in containing COVID-19. For example,
social contact between different age groups may play an essential part in the spread of
the virus (Scala et al., 2020). In this respect, if people are vigilant and refrain from mixing
with the elderly, this could mitigate the health consequences of a possible fresh outbreak,
easing the pressure on the health system and avoiding the economic costs of lockdown
measures (see Acemoglu et al., 2020).
18 At the global level, Cherif and Hasanov (2020) propose strategies involving large-scale testing and isolation of
individuals who test PCR positive. According to the calculations made in this study, the monthly cost of implementing
such a strategy worldwide would be less than the economic losses that the pandemic could cause in under a week.
19 In this respect, the experience of countries such as Germany, South Korea and Taiwan confirms the possibility of
success of this strategy. These countries carried out mass diagnostic testing of the population and the pandemic
followed a relatively favourable course, with no need for strict lockdown measures such as those imposed in Spain
or Italy.
BANCO DE ESPAÑA 19 DOCUMENTO OCASIONAL N.º 2022References
Acemoglu, D., A. Makhdoumi, A. Malekian and A. Ozdaglar (2020). Testing, Voluntary Social Distancing and the
Spread of an Infection, National Bureau of Economic Research.
Askitas, N., K. Tatsiramos and B. Verheyden (2020). “Lockdown Strategies, Mobility Patterns and COVID-19”, arXiv
preprint arXiv:2006.00531.
Barro, R. J. (2020). Non-pharmaceutical interventions and mortality in US cities during the Great Influenza
pandemic, 1918-1919, National Bureau of Economic Research.
Bodenstein, M., G. Corsetti and L. Guerrieri (2020). Social distancing and supply disruptions in a pandemic,
Technical Report.
Cherif, R. and F. Hasanov (2020). A Tip Against the COVID-19 Pandemic, IMF Working Paper No. 20/114.
Correia, S., S. Luck and E. Verner (2020). “Pandemics Depress the Economy, Public Health Interventions Do Not:
Evidence from the 1918 Flu”, mimeo.
Desmet, K. and R. Wacziarg (2020). Understanding Spatial Variation in COVID-19 across the United States,
National Bureau of Economic Research.
Ferguson, N., D. Cummings, C. Fraser, J. Cajka, P. Cooley and D. Burke (2006). “Strategies for mitigating an
influenza pandemic”, Nature, 442, 448-452.
Gutiérrez, E., E. Moral-Benito and R. Ramos (2020a). “Tendencias recientes de la población en áreas rurales y
urbanas en España”, mimeo.
Gutiérrez, E., E. Moral-Benito, D. Oto-Peralías and R. Ramos (2020b). The spatial distribution of population in
Spain: an anomaly in European perspective, Working Paper 2028, Banco de España, forthcoming.
Knittel, C. R. and B. Ozaltun (2020). “What does and does not correlate with COVID-19 death rates”, medRxiv.
Oto-Peralías, D. (2020a). “Frontiers, warfare and economic geography: The case of Spain”, Journal of Development
Economics, Vol. 146, 102511.
—(2020b). “Regional correlations of COVID-19 in Spain”, mimeo.
Scala, A., A. Flori, A. Spelta, E. Brugnoli, M. Cinelli, W. Quattrociocchi and F. Pammolli F. (2020). “Time, Space and
Social Interactions: Exit Mechanisms for the Covid-19 Epidemics”, mimeo.
BANCO DE ESPAÑA 20 DOCUMENTO OCASIONAL N.º 2022BANCO DE ESPAÑA PUBLICATIONS
OCCASIONAL PAPERS
1801
Ana Arencibia Pareja, Ana Gómez Loscos, Mercedes de Luis López and Gabriel Pérez Quirós:
A short-term forecasting model for the Spanish economy: GDP and its demand components.
1802
MIGUEL ALMUNIA, DAVID LÓPEZ-RODRÍGUEZ and enrique moral-benito: Evaluating
the macro-representativeness of a firm-level database: an application for the Spanish economy.
1803
Pablo Hernández de Cos, David López Rodríguez and Javier J. Pérez: The challenges of public
deleveraging. (There is a Spanish version of this edition with the same number).
1804
olympia bover, laura crespo, carlos gento and ismael moreno: The Spanish Survey of Household
Finances (EFF): description and methods of the 2014 wave.
1805
Enrique Moral-Benito: The microeconomic origins of the Spanish boom.
1806
Brindusa Anghel, Henrique Basso, Olympia Bover, José María Casado, Laura Hospido, Mario
Izquierdo, Ivan A. Kataryniuk, Aitor Lacuesta, José Manuel Montero and Elena Vozmediano:
Income, consumption and wealth inequality in Spain. (There is a Spanish version of this edition with the same number).
1807 Mar Delgado-TÉllez and Javier J. PÉrez: Institutional and economic determinants of regional public debt in Spain.
1808 chenxu fu and enrique moral-benito: The evolution of Spanish total factor productivity since the Global
Financial Crisis.
1809
Concha Artola, Alejandro Fiorito, María Gil, Javier J. Pérez, Alberto Urtasun and Diego Vila:
Monitoring the Spanish economy from a regional perspective: main elements of analysis.
1810
David López-Rodríguez and Cristina García Ciria: Estructura impositiva de España en el contexto de la Unión
Europea.
1811
JORGE MARTÍNEZ: Previsión de la carga de intereses de las Administraciones Públicas.
1901
carlos conesa: Bitcoin: a solution for payment systems or a solution in search of a problem? (There is a Spanish
version of this edition with the same number).
1902
AITOR LACUESTA, MARIO IZQUIERDO and SERGIO PUENTE: An analysis of the impact of the rise in the national
minimum wage in 2017 on the probability of job loss. (There is a Spanish version of this edition with the same number).
1903 EDUARDO GUTIÉRREZ CHACÓN and CÉSAR MARTÍN MACHUCA: Exporting Spanish firms. Stylized facts and trends.
1904
María Gil, Danilo Leiva-LeOn, Javier J. Pérez and Alberto Urtasun: An application of dynamic factor
models to nowcast regional economic activity in Spain.
1905
Juan Luis Vega (coord.): Brexit: current situation and outlook. (There is a Spanish version of this edition with the
same number).
1906 Jorge E. Galán: Measuring credit-to-GDP gaps. The Hodrick-Prescott filter revisited.
1907
Víctor González-Díez and Enrique Moral-Benito: The process of structural change in the Spanish economy
from a historical standpoint. (There is a Spanish version of this edition with the same number).
1908
Pana Alves, Daniel Dejuán and Laurent Maurin: Can survey-based information help assess investment gaps
in the EU?
1909
OLYMPIA BOVER, LAURA HOSPIDO and ERNESTO VILLANUEVA: The survey of financial competences (ecf):
description and methods of the 2016 wave.
1910 Luis Julián Álvarez: el índice de precios de consumo: usos y posibles vías de mejora.
1911
Antoine Berthou, Ángel Estrada, Sophie Haincourt, Alexander Kadow, Moritz A. Roth
and Marie-Elisabeth de la Serve: Assessing the macroeconomic impact of Brexit through trade and
migration channels.
1912 Rodolfo Campos and Jacopo Timini: An estimation of the effects of Brexit on trade and migration.
1913
Ana de Almeida, Teresa Sastre, Duncan Van Limbergen and Marco Hoeberichts: A tentative
exploration of the effects of Brexit on foreign direct investment vis-à-vis the United Kingdom.
1914
María Dolores Gadea-Rivas, Ana Gómez-Loscos and Eduardo Bandrés: Ciclos económicos y clusters
regionales en Europa.
1915
Mario Alloza and Pablo Burriel: La mejora de la situación de las finanzas públicas de las Corporaciones Locales
en la última década.
1916
Andrés Alonso and José Manuel Marqués: Financial innovation for a sustainable economy. (There is a Spanish
version of this edition with the same number).
2001
Ángel Estrada, Luis Guirola, Iván Kataryniuk and Jaime MartÍnez-MartÍn: The use of BVARs in the analysis
of emerging economies.2002
David López-Rodríguez and M.ª de los Llanos Matea: Public intervention in the rental housing market:
a review of international experience. (There is a Spanish version of this edition with the same number).
2003
Omar Rachedi: Structural transformation in the Spanish economy.
2004
Miguel García-Posada, Álvaro Menéndez and Maristela Mulino: Determinants of investment in tangible
and intangible fixed assets.
2005
Juan Ayuso and Carlos Conesa: Una introducción al debate actual sobre la moneda digital de banco central
(CBDC).
2006
PILAR CUADRADO, ENRIQUE MORAL-BENITO and IRUNE SOLERA: A sectoral anatomy of the Spanish productivity
puzzle.
2007
Sonsoles Gallego, Pilar L’Hotellerie-Fallois and Xavier Serra: La efectividad de los programas del FMI
en la última década.
2008
Rubén Ortuño, José M. Sánchez, Diego Álvarez, Miguel López and Fernando León: Neurometrics
applied to banknote and security features design.
2009
Pablo Burriel, Panagiotis Chronis, Maximilian Freier, Sebastian Hauptmeier, Lukas Reiss,
Dan Stegarescu and Stefan Van Parys: A fiscal capacity for the euro area: lessons from existing fiscal-federal
systems.
2010
Miguel Ángel López and M.ª de los Llanos Matea: El sistema de tasación hipotecaria en España.
Una comparación internacional.
2011
Directorate General Economics, Statistics and Research: The Spanish economy in 2019. (There is a
Spanish version of this edition with the same number).
2012
Mario Alloza, Marien Ferdinandusse, Pascal Jacquinot and Katja Schmidt: Fiscal expenditure
spillovers in the euro area: an empirical and model-based assessment.
2013
Directorate General Economics, Statistics and Research: The housing market in Spain: 2014-2019.
(There is a Spanish version of this edition with the same number).
2014
Óscar Arce, Iván Kataryniuk, Paloma Marín and Javier J. Pérez: Thoughts on the design of a european
Recovery Fund. (There is a Spanish version of this edition with the same number).
2015
Miguel Otero Iglesias and Elena Vidal Muñoz: Las estrategias de internacionalización de las empresas chinas.
2016
Eva Ortega and Chiara Osbat: Exchange rate pass-through in the euro area and EU countries.
2017
Alicia de Quinto, Laura Hospido and Carlos Sanz: the child penalty in Spain.
2018
Luis J. Álvarez and Mónica Correa-López: Inflation expectations in euro area Phillips curves.
2019
Lucía Cuadro-Sáez, Fernando S. López-Vicente, Susana Párraga Rodríguez and Francesca Viani:
Fiscal policy measures in response to the health crisis in the main euro area economies, the United States and the
United Kingdom. (There is a Spanish version of this edition with the same number).
2020
Roberto Blanco, Sergio Mayordomo, Álvaro Menéndez and Maristela Mulino: Spanish non-financial
corporations’ liquidity needs and solvency after the COVID-19 shock. (There is a Spanish version of this edition with the
same number).
2021
Mar Delgado-Téllez, Iván Kataryniuk, Fernando López-Vicente and Javier J. Pérez: Supranational
debt and financing needs in the European Union. (There is a Spanish version of this edition with the same number).
2022
Eduardo Gutiérrez and Enrique Moral-Benito: Containment measures, employment and the spread of
COVID-19 in sSpanish municipalities. (There is a Spanish version of this edition with the same number).
Unidad de Servicios Generales I
Alcalá, 48 - 28014 Madrid
E-mail: publicaciones@bde.es
www.bde.esYou can also read