West Coast Trade Report - Pacific Merchant Shipping ...
←
→
Page content transcription
If your browser does not render page correctly, please read the page content below

West Coast Trade Report
                                                                                                              June 2021

A First Look at May’s TEU Numbers
Note: The ports we survey take from a few days to a few        the number of loaded export TEUs shipped in May. Largely
weeks to report their container trade statistics. Because      because of its prowess in generating unprecedented
West Coast ports are generally much more agile in compiling    volumes of empty outbound containers, LA easily retained
and releasing their monthly TEU counts than are ports          its position as the nation’ busiest container port with
elsewhere in the country, these “First Glimpse” numbers are    1,012,048 loaded and empty TEUs handled in May.
necessarily incomplete and may give a misleading indication
                                                               At the Port of Long Beach, the 444,736 inbound loaded
of the latest trends.
                                                               TEUs that arrived this May were up 53.1% over the same
Once again, we’re going to downplay the absurd year-           month two years earlier when just 290,568 loads sailed
over-year leaps in May’s trade containerized numbers.          into port. Outbound loads meanwhile rose 12.2%. Total
Global trade last May was dreadful, and so nearly every        TEU traffic (loads plus empties) jumped 58.2% to 907,216
port did exceptionally well by comparison. (Well, there        from 573,623 in May 2019. Long Beach was the nation’s
was Boston. But, as they often say in New England, it’s        second most active container port this May.
a rebuilding year.) More illuminating is how each port’s
                                                               At the Port of Oakland, inbound loads (92,558 TEUs) were
figures compared with their TEU counts in the more
                                                               up 7.7% from 85,970 TEUs in May 2019, while outbound
normal, pre-pandemic May of 2019. So, for those ports
                                                               loads slipped by 4.3%. Overall, Oakland handled just 1.5%
which have thusfar reported their May 2021 TEU tallies,
                                                               more total TEUs this May (226,406) than it had two years
here’s how they stack up in contrast to May 2019.
                                                               earlier (223,102).
At the Port of Los Angeles, which this month celebrated
                                                               Up in the Pacific Northwest, the Northwest Seaport
handling its 10 millionth TEU in the fiscal year ending at
                                                               Alliance Ports of Tacoma and Seattle handled 132,714
the end of this month, inbound loads in May (535,714
                                                               inbound loaded TEUs this May, an 18.8% improvement
TEUs) were up 25.2% over the 427,789 loads the port
                                                               over May 2019. Outbound loads (65,527 TEUs), however,
received in May 2019. However, export loads (109,886
                                                               were down 11.4% over the same span.
TEUs) plunged by 34.3% from the 167,357 export loads
recorded two years earlier. As a result, LA found itself       Vancouver received 191,637 inbound loaded TEUs in May,
toppled from first place in 2019 to fourth place in terms of   a 46.5% bounce over May 2019. Outbound loads, however,

Pacific Merchant Shipping Association
70 Washington Street, Suite 305, Oakland, CA 94607
                                                                                                 pmsaship.com
510-987-5000 info@pmsaship.com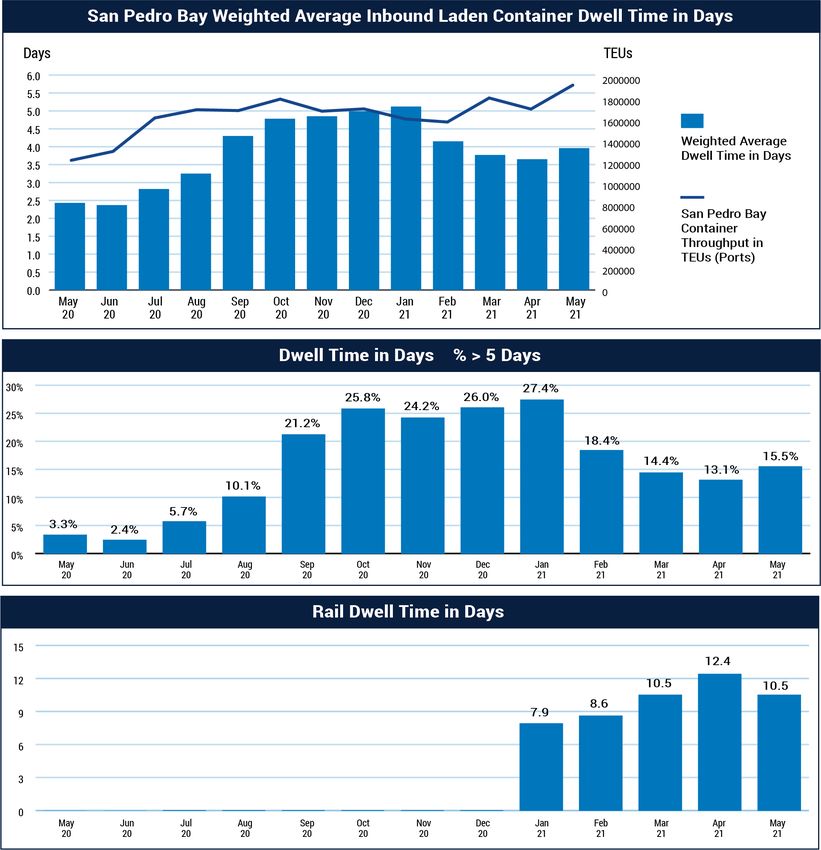
West Coast Trade Report

A First Look at May’s TEU Numbers                      Continued

slipped by 2.3% from two years earlier. The other British      Savannah saw a 28.2% jump in total container traffic from
Columbia port we track, Prince Rupert, once again stood        May 2019. Import loads (137,812 TEUs) were up 27.2%,
out as the only major Pacific Coast port that handled          while export loads nudged up by 8.6%. Over at the Port
fewer loaded inbound container traffic in May than it had      of Virginia, import loads (144,916 TEUs) were up 21.2%,
two years ago. Inbound loads this May (56,706 TEUs)            while export loads (99,717 TEUs) rose by 13.2%. Total
were down 1.5% from May 2019, while export loads were          container traffic was up 20.7%.
off by 16.2%. Total TEU movements through the port this
                                                               On the Gulf Coast, Houston handled 132,853 inbound
May were 4.1% under May 2019’s level.
                                                               loaded TEUs this May, a 24.0% jump from the same month
Back East, Boston’s Conley Terminal had a wicked bad           two years earlier. Its outbound loads (95,439 TEUs) were
May. Inbound loads (8,410 TEUs) were off by 26.5% from         down by 18.2% from May 2019. Total container traffic at
two years earlier, while its 5,944 outbound loads were         the big Texas port in May (288,127 TEUs) was up 9.5%
down by 13.3%. Down South along the Atlantic Seaboard,         from two Mays ago.
Charleston’s 107,050 inbound loaded TEUs this May
                                                               Regionally, the Big Five U.S. West Coast ports handled
represented a 21.6% gain over May 2019. Outbound loads,
                                                               1,205,722 inbound loaded TEUs this May, up 31.6% from
though, rose by just 2.6%. Total container traffic this May
                                                               May 2019. Outbound loads this May totaled 382,484
amounted to 230,870 TEUs, 12.9% higher than the number
                                                               TEUs, down 20.1% from May 2019.
that had crossed Charleston’s docks two years earlier.

Detailing the April 2021 TEU Numbers

Please note: The TEU tallies cited here are not derived from   mainland U.S. and two British Columbian ports we track.
forecasting algorithms or the partial information available    Inbound loads for all eighteen ports totaled 2,411,144
from U.S. Customs and Border Protection but instead            TEUs, up 20.1% from April 2019.
represent the actual TEU counts reported by the major
                                                               The bulk of the surge’s burden fell on the five major USWC
North American seaports we survey each month. The U.S.
                                                               ports, which collectively saw a 23.6% bump in inbound
mainland ports we monitor collectively handle over 90% of
                                                               loads since April 2019.
the container movements at continental U.S. ports.
                                                               Exports, as Exhibit 2 reveals, continued to spiral lower
The usual year-over-year comparisons of TEU counts are
                                                               at most ports. Collectively, the U.S. and British Columbia
all but meaningless this spring. The COVID-19 outbreak
                                                               ports we track recorded a 7.6% fall-off in export loads
severely stunted world trade as well as global economic
                                                               from April 2019. USWC ports saw a combined 14.4%
output to the extent that even a minuscule rebound in
                                                               reduction. However, Long Beach eked out a minor
trade could be expected to yield preposterously high
                                                               increase, while Virginia, Maryland, Charleston, and Jaxport
growth numbers. So for this and at least the next couple
                                                               all shipped more outbound loads this April than in the
of months, we will be offering two sets of comparative
                                                               same month two years earlier.
statistics. We begin with Exhibit 1 which compares the
import numbers for this April with the same month in the       Exhibit 3 provides the April and year-to-date total
two preceding years.                                           container traffic figures for the U.S., Canadian, and
                                                               Mexican ports we monitor.
Exhibit 1 displays the complete inbound loaded container
traffic numbers for April as reported by the sixteen

                                                                                                    June 2021          Page 2
West Coast Trade Report
Exhibit 1 April 2021 - Inbound Loaded TEUs at Selected Ports
Apr 2021 Apr 2020 % Apr 2019 % Apr 2021 Apr 2020 % Apr 2019 %
Change Change YTD YTD Change YTD Change
Los Angeles 490,127 370,111 32.4% 360,745 35.9% 1,830,735 1,275,122 43.6% 1,436,171 27.5%
Long Beach 367,151 253,540 44.8% 317,883 15.5% 1,513,334 1,046,663 44.6% 1,191,625 27.0%
San Pedro Bay
857,278 623,651 37.5% 678,628 26.3% 3,344,069 2,321,785 44.0% 2,627,796 27.3%
Totals
Oakland 100,096 80,003 25.1% 80,702 24.0% 355,237 298,475 10.0% 307,286 15.6%
NWSA 120,145 96,992 23.9% 112,652 6.7% 475,232 375,565 16.5% 457,943 3.8%
USWC Totals 1,077,519 800,646 34.6% 871,982 23.6% 4,174,538 2,995,825 39.3% 3,393,025 23.0%
Boston 9,865 11,546 -14.6% 12,247 -19.4% 37,335 47,896 -22.0% 47,888 -22.0%
NYNJ 359,265 284,074 26.5% 297,825 20.6% 1,457,992 1,178,673 23.7% 1,203,674 21.1%
Maryland 44,501 45,258 -1.7% 42,984 3.5% 165,580 167,918 -1.4% 172,840 -4.2%
Virginia 137,954 100,310 37.5% 119,266 15.7% 509,071 405,882 25.4% 441,420 15.6%
South Carolina 105,054 82,899 26.7% 87,675 19.8% 396,297 337,761 17.3% 346,324 14.4%
Georgia 236,479 166,679 41.9% 175,661 34.6% 908,196 672,482 35.1% 721,298 25.9%
Jaxport 24,214 23,461 3.2% 27,094 -10.6% 109,958 98,916 11.2% 113,319 -3.0%
Port Everglades 28,974 23,164 25.1% 32,308 -10.3% 117,067 107,226 9.2% 115,906 1.0%
Miami 47,644 28,493 68.3% 32,831 45.1% 187,736 135,611 38.4% 142,932 31.3%
USEC Totals 993,950 765,884 29.8% 827,891 20.1% 3,889,232 3,152,365 23.4% 3,305,601 17.7%
New Orleans 11,103 9,926 11.9% 10,527 5.5% 41,348 45,531 -9.2% 43,950 -5.9%
Houston 128,834 100,034 28.8% 100,627 28.0% 477,105 383,306 24.5% 392,502 21.6%
USGC Totals 139,937 109,960 27.3% 111,154 25.9% 518,453 428,837 20.9% 436,452 18.8%
Vancouver 171,687 148,718 15.4% 145,168 18.3% 648,670 517,866 25.3% 575,504 12.7%
Prince Rupert 28,051 52,730 -46.8% 51,686 -45.7% 165,356 187,451 -11.8% 184,047 -10.2%
BC Totals 199,738 201,448 -0.8% 196,854 1.5% 814,026 705,317 15.4% 759,551 7.2%
US/BC Totals 2,411,144 1,877,938 28.4% 2,007,881 20.1% 9,396,250 7,282,344 29.0% 7,894,629 19.0%
US Total 2,211,406 1,676,490 31.9% 1,811,027 22.1% 8,582,223 6,577,027 30.5% 7,135,078 20.3%
USWC/BC 1,277,257 1,002,094 27.5% 1,068,836 19.5% 4,988,564 3,701,142 34.8% 4,152,576 20.1%
Source Individual Ports
June 2021 Page 3West Coast Trade Report
Exhibit 2 April 2021 - Outbound Loaded TEUs at Selected Ports
Apr 2021 Apr 2020 % Apr 2019 % Apr 2021 Apr 2020 % Apr 2019 %
Change Change YTD YTD Change YTD Change
Los Angeles 114,449 130,321 -12.2% 155,533 -26.4% 457,882 534,142 -14.3% 602,005 -23.9%
Long Beach 124,069 102,502 21.0% 123,804 0.2% 499,449 482,126 3.6% 477,815 4.5%
San Pedro Bay
238,518 232,823 2.4% 279,337 -14.6% 957,331 1,016,268 -5.8% 1,079,820 -11.3%
Totals
Oakland 79,096 82,164 -3.7% 79,291 -0.1% 312,000 322,068 -3.1% 310,680 0.4%
NWSA 58,932 66,955 -12.0% 81,305 -27.5% 245,821 281,314 -12.6% 306,630 -19.8%
USWC Totals 376,546 381,942 -1.4% 439,933 -14.4% 1,515,152 1,619,650 -6.5% 1,697,130 -10.7%
Boston 6,669 5,354 24.6% 7,754 -13.0% 26,040 24,599 5.9% 25,980 0.2%
NYNJ 121,671 97,312 25.0% 131,311 -7.3% 451,806 466,381 -3.1% 486,540 -7.1%
Maryland 21,515 15,523 38.6% 20,940 2.7% 82,719 77,383 6.9% 76,032 8.8%
Virginia 95,618 71,158 34.4% 85,378 12.0% 362,618 322,081 12.6% 329,250 10.1%
South Carolina 73,333 56,611 29.5% 73,295 0.1% 287,758 272,428 5.6% 276,835 3.9%
Georgia 128,206 120,852 6.1% 129,726 -1.2% 487,899 505,539 -3.5% 514,442 -5.2%
Jaxport 51,129 31,524 62.2% 42,353 20.7% 190,586 152,083 25.3% 167,675 13.7%
Port Everglades 33,506 20,119 66.5% 36,084 -7.1% 126,247 121,432 4.0% 139,751 -9.7%
Miami 30,462 24,964 22.0% 30,719 -0.8% 116,172 126,034 -7.8% 139,145 -16.5%
USEC Totals 562,109 443,417 26.8% 557,560 0.8% 2,131,845 2,067,960 3.1% 2,155,650 -1.1%
New Orleans 23,232 20,076 15.7% 24,545 -5.3% 90,260 98,650 -8.5% 95,502 -5.5%
Houston 91,766 91,808 -0.05% 106,654 -14.0% 378,045 436,416 -13.4% 399,370 -5.3%
USGC Totals 114,998 111,884 2.8% 131,199 -12.3% 468,305 535,066 -12.5% 494,872 -5.4%
Vancouver 87,587 91,942 -4.7% 97,394 -10.1% 331,674 347,784 -4.6% 385,133 -13.9%
Prince Rupert 10,000 22,526 -56.6% 20,271 -50.7% 56,397 67,161 -16.0% 66,936 -15.7%
BC Totals 97,587 114,468 -14.7% 117,665 -17.1% 388,071 414,945 -6.5% 452,069 -14.2%
US/Canada
1,151,240 1,051,711 9.5% 1,246,357 -7.6% 4,503,373 4,637,621 -2.9% 4,799,721 -6.2%
Total
US Total 1,053,653 937,243 12.4% 1,128,692 -6.6% 4,115,302 4,222,676 -2.5% 4,347,652 -5.3%
USWC/BC 474,133 496,410 -10.6% 557,598 -15.0% 1,903,223 2,034,595 -6.5% 2,149,199 -11.4%
Source Individual Ports
June 2021 Page 4West Coast Trade Report
Detailing the April 2021 TEU Numbers Continued
Weights and Values Exhibit 3 April 2021 Total TEUs (Loaded and Empty) Handled at
We know that the TEU is the container Selected Ports
shipping industry’s preferred metric.
Here, though, we offer two alternative
measures—the declared weight and value
Apr 2021 Apr 2020 % Change Apr 2019 % Change
of the goods housed in those TEUs. The
percentages in the following exhibits Los Angeles 3,539,397 2,488,748 42.2% 2,945,200 20.2%
are derived from data compiled by the
U.S. Commerce Department that are Long Beach 3,122,315 2,202,651 41.8% 2,434,845 28.2%
published with a five-week time-lag.
NYNJ 2,848,979 2,316,907 23.0% 2,398,108 18.8%
Exhibit 4: USWC Ports and the
Georgia 1,815,111 1,516,928 19.7% 1,516,928 19.7%
Worldwide Container Trade.
Exhibit 4 shows how the three major Vancouver 1,275,686 1,013,078 25.9% 1,133,669 12.5%
USWC gateways have been faring with
respect to their respective shares of NWSA 1,182,868 1,036,556 14.1% 1,256,237 -5.8%
containerized imports discharged at
Manzanillo 1,106,208 933,478 18.5% 984,816 12.3%
mainland U.S. seaports in April. However,
we do wish to remind readers that the Virginia 1,085,414 861,609 26.0% 854,230 27.1%
major USWC port complexes do not
Houston 1,027,039 994,627 3.3% 946,860 8.5%
entirely monopolize the container trade
through ports in the states of California, South Carolina 872,465 770,017 13.3% 802,554 8.7%
Oregon, and Washington. San Diego
and Port Hueneme are both important Oakland 849,114 783,491 8.4% 828,153 2.5%
conduits for refrigerated containers laden
Montreal 545,291 567,551 -3.9% 561,860 -2.9%
with fresh fruit imports from Central
and South America. And Portland (the JaxPort 466,214 394,214 18.3% 443,481 5.1%
one in Oregon) is making strides in re-
establishing itself as a container port, Miami 426,637 348,857 22.3% 376,101 13.4%
with the number of total TEUs handled
Lazaro Cardenas 398,264 366,838 8.6% 429,468 -7.3%
in April (8,928 TEUs) up 79.3% from last
year’s (4,980 TEUs) and from zero TEUs Port Everglades 349,338 340,692 2.5% 357,350 -2.2%
in April 2019. Still, the Big Five did handle
95.1% of all containerized tonnage Maryland 335,385 342,275 -2.0% 358,715 -6.5%
imported and 96.3% of the containerized
Prince Rupert 333,200 330,037 1.0% 346,055 -3.7%
tonnage exported through all USWC ports
in April. Philadelphia 223,240 209,112 6.9% 192,075 16.2%
Altogether, USWC ports—big and small— New Orleans 176,950 203,010 -12.8% 206,423 -14.3%
handled 38.9% of all containerized
imports through American mainland Boston 75,955 92,994 -18.3% 97,988 -22.5%
ports in April. That was up from 37.5%
US/Canada Total 20,550,598 16,813,670 22.2% 18,056,832 13.8%
a year earlier, which was up from 36.8%
in April 2019. Those same USWC ports US Mainland Only 18,396,421 14,902,688 23.4% 16,015,248 14.9%
handled 34.7% of all containerized export
tonnage through U.S. mainland ports this Source Individual Ports
June 2021 Page 5West Coast Trade Report
Detailing the April 2021 TEU Numbers Continued
Exhibit 4 Major USWC Ports Shares of U.S. Exhibit 5 Major USWC Ports Shares of U.S.
Mainland Ports Worldwide Container Mainland Ports Containerized Trade with
Trade, April 2021 East Asia, April 2021
Apr 2021 Mar 2021 Apr 2020 Apr 2021 Mar 2021 Apr 2020
Shares of U.S. Mainland Ports Containerized Import Tonnage Shares of U.S. Mainland Ports’ East Asian Container Import Tonnage
LA/LB 28.0% 27.5% 26.9% LA/LB 46.0% 45.0% 44.6%
Oakland 4.0% 3.8% 4.3% Oakland 5.1% 3.9% 4.9%
NWSA 4.9% 5.2% 4.9% NWSA 7.8% 7.9% 7.2%
Shares of U.S. Mainland Ports Containerized Import Value Shares of U.S. Mainland Ports’ East Asian Container Import Value
LA/LB 33.7% 34.2% 34.1% LA/LB 50.9% 50.9% 51.5%
Oakland 3.8% 3.1% 3.8% Oakland 4.7% 3.7% 4.6%
NWSA 6.3% 6.5% 6.3% NWSA 9.4% 9.4% 9.1%
Shares of U.S. Mainland Containerized Export Tonnage Shares of U.S. Mainland Ports’ East Asian Container Export Tonnage
LA/LB 19.0% 19.0% 21.0% LA/LB 31.6% 30.1% 33.9%
Oakland 7.8% 6.9% 7.3% Oakland 10.4% 8.9% 10.6%
NWSA 6.9% 7.2% 7.8% NWSA 11.5% 11.5% 12.6%
Shares of U.S. Mainland Conatainerized Export Value Shares of U.S. Mainland Ports’ East Asian Container Export Value
LA/LB 17.7% 17.6% 21.6% LA/LB 35.8% 33.7% 40.3%
Oakland 7.2% 7.2% 8.1% Oakland 12.5% 12.0% 13.7%
NWSA 3.9% 4.3% 4.4% NWSA 8.2% 8.4% 8.2%
Source: U.S. Commerce Department. Source: U.S. Commerce Department.
April, down from 37.1% a year earlier and from 36.5% in In April, all of the ports in California, Oregon, and
April of 2019. Washington handled 56.7% of all containerized imports
that arrived from the Far East at U.S. mainland ports.
Exhibit 5: USWC Ports and the East Asia Trade. That was up from 54.6% a year earlier and from 56.1% in
Exhibit 5 displays the shares of U.S. container trade the first quarter of 2019. They also handled 54.4% of all
involving the Far East handled by the major USWC containerized tonnage exported to the Far East in April,
ports. While the Big Five continue to dominate USWC down from 57.6% a year earlier and from 58.1% in April
containerized trade with the Far East, their shares are 2019.
slipping. April 2021 data show the Big Five handling
98.1% of all import tonnage from the Far East that entered On the export side of the ledger, all USWC ports great and
small handled 54.4% of all containerized export tonnage
USWC ports and 98.3% of all export tonnage involving
bound for the Far East from America’s mainland ports.
the Far East from USWC ports. Those shares were down,
That was down sharply from 57.6% a year earlier and from
though, from the 99.0% of import tonnage and 99.8% of
a 58.1% share in April of 2019.
exports they had handled in the last relatively normal April
in 2019.
June 2021 Page 6West Coast Trade Report
Detailing the April 2021 TEU Numbers Continued
Who’s #1? TEUs) comes out on top, besting not only East Coast rival
As the Port of New York/New Jersey is characteristically PNYNJ (121,671 TEUs) but also running ahead of Long
tardy in posting its most recent month’s statistics, we’ll Beach (124,069 TEUs) while swamping the Port of Los
tell you that, in April at least, the Port of Los Angeles Angeles (114,449 TEUs).
was the nation’s busiest container port, having handled
On a year-to-date basis, Long Beach handled the most
946,966 loaded + empty TEUs. The neighboring Port of
outbound loads (499,449 TEUs) through April, followed
Long Beach ran a competitive second with 746,188 total
closely by Savannah with 487,899 TEUs. LA, with 457,882
TEUs. Together, the San Pedro Bay complex managed to
outbound loads, came out ahead of PNYNJ (451,806
move 1,693,154 TEUs, a staggering 40.1% leap over last
TEUs) and outdistanced Houston (378,045 TEUs).
April’s pandemic-suppressed 1,208,729 TEUs but also up
Honorable mention goes to the Port of Virginia, which
an impressive 24.1% from the 1,364,588 TEUs they had
shipped a total of 362,618 laden TEUs through April of
handled in April 2019. In third came the Port of New York/
this year.
New Jersey (PNYNJ) with 712,799 total TEUs. Fourth
place went to Savannah with 466,635 total TEUs. The Whither Prince Rupert?
Northwest Seaport Alliance Ports of Tacoma and Seattle For some years now, the Port of Prince Rupert up in
ranked fifth among the U.S. ports we track with a total of British Columbia has been touted by Canadian authorities
301,074 TEUs in April. (For our friends elsewhere in North as an arriviste, a port that was built to steal container
America, Vancouver handled 342,292 total TEUs in April, traffic away from the Ports of Seattle and Tacoma. It
while 278,873 TEUs crossed the docks at Manzanillo.) might, it was repeatedly implied, even pilfer business from
the massive Southern California ports. After all, it boasts
The Port of Los Angeles was also the nation’s busiest
of having the deepest natural harbor in North America
port year-to-date, with 3,539,397 total TEUs through this
and is quick to remind everyone that it is 2-3 days nearer
April. Second was Long Beach with 3,122,315 TEUs,
to Asia than are other Pacific Coast ports. On the other
while PNYNJ placed third with 2,848,979 TEUs. Savannah
hand, we don’t recall any instances where a container has
handled 1,815,111 total TEUs through April, while the
actually frozen to the ground at Long Beach or LA.
NWSA ports took care of 1,182,868 loads and empties.
The port has, as we’ll see, gained higher shares of
For carpers who don’t think empty boxes should count,
container traffic through British Columbia. But it has also
Los Angeles remained in the lead with 604,576 loaded
seen its stumbles.
TEUs in the month of April. In second place with 491,220
loads was the Port of Long Beach, not that far ahead of As we noted earlier, Prince Rupert is the only major Pacific
PNYNJ’s 480,936 loaded TEUs. Savannah and Virginia Coast port that handled fewer loaded inbound containers
were well behind with 364,685 and 233,572 laden TEUs, through May of this year than it had in the same months
respectively. But both bested the 179,077 loads handled a year earlier. That sharply contrasts with the vertigo-
by the NWSA ports. inducing double-digit year-over-year gains experienced by
all of the other major Pacific Coast ports. But that’s not
In the category of inbound loads discharged in April, Los
the worst of it. The 222,063 inbound loads the port has
Angeles (490,127 TEUs) easily exceeded Long Beach
handled so far this year is the meagerest inbound total for
(367,151 TEUs) and PNYNJ (359,265 TEUs). Inbound
those months since 2017. Last year, the port discharged
loads at Savannah meanwhile totaled 236,479 TEUs.
223,890 TEUs in the first five months, a tally that was
Virginia’s 137,954 inbound loads and Houston’s 128,834
itself down from the 241,625 inbound loads that had
inbound loads both trumped the NWSA ports’ 120,145
arrived in the same period in 2019. That, though, was an
laden import TEUs.
improvement over the 222,975 TEUs that had sailed into
It’s where we start talking about exports that the rankings port by this point in 2018. So, in effect, Prince Rupert has
start moving around. In terms of outbound loads in April, only regained the loaded import numbers it had posted
the most fascinating news is not that Savannah (128,206 three years ago.
June 2021 Page 7West Coast Trade Report
Detailing the April 2021 TEU Numbers Continued
Not surprisingly, total TEU movements (empties + loads) Nuts to You
this May were 4.1% under May 2019’s totals. Even worse, Agricultural exporters across the country appear to be
the port’s total container volume so far this year is thriving, despite the insistence of some that the efforts
running 3.8% below its 2019 numbers. of farmers to reach foreign markets are being stymied
by profit-motivated shipping lines and port terminal
Exhibit 6 and Exhibit 7 show how Prince Rupert has fared operators. (Who knew the farm belt went socialist?)
against the competition in recent years. Being Americans, The latest news from the frontlines out here in California,
we’re much too polite to comment on whether the port that scourge of capitalism, comes from the federal
has satisfied the expectations once expected of it. marketing groups that oversee tree nut crops in California
Exhibit 6 Pacific Coast Ports Container Import Shares: 2015 - May 2021
Source: Individual Ports
Shares of Laden Import TEUs
40%
35%
30%
25%
20%
15%
10%
4.0% 4.2% 5.1% 4.8%
5% 3.7% 3.6% 3.4%
0
2015 2016 2017 2018 2019 2020 2021YTD
n Los Angeles n Long Beach n Oakland n NWSA n Vancouver n Prince Rupert
Exhibit 7 Pacific Coast Container Export Shares: 2015-May 2021
Source: Individual Ports
Shares of Laden Outbound TEUs
35%
30%
25%
20%
15%
10%
5% 2.5% 2.5% 2.5% 3.1% 3.0% 3.2% 3.0%
0
2015 2016 2017 2018 2019 2020 2021YTD
n Los Angeles n Long Beach n Oakland n NWSA n Vancouver n Prince Rupert
June 2021 Page 8West Coast Trade Report
Detailing the April 2021 TEU Numbers Continued
and adjacent southwestern states. Almonds, California’s By contrast, farmers and especially food processors
leading farm export commodity, saw a 42.6% year-over- are more likely to be concerned with how many dollars
year jump in export tonnage in May. Now we recognize they’re earning. This leads to a likely disparity: volumes
that last spring was not the best month for exporting, and values do not necessarily move in tandem. Shifting
what with the plague and all that. But, according to the commodity pricing often gets in the way.
California Almond Board’s latest numbers, this May’s
export volume was also up an impressive 22.8% over pre- So, what, you may ask, constitute “agricultural exports”?
pandemic May 2019. Meanwhile, the California Walnut We’re glad you asked since it provides us an opportunity
Board (walnuts being the state’s fifth most valuable farm to cite the official definition used by the U.S. Department
export), May witnessed a 23.1% increase over last May of Agriculture:
but, more importantly, a 20.8% bump over May 2019. And Agricultural commodities consist of nonmarine food
then there’s the latest word from the pistachio groves, products, natural fibers, unmanufactured tobacco, and other
where May’s exports of California’s second most valuable farm products subject to federal legislation such as Section
agricultural export were up a mere 52.7% year-over-year. 22 of the Agricultural Adjustment Act. Some processed
Unlike soybeans, corn, and wheat, almost all overseas agricultural commodities are included if the value added
shipments of tree nuts travel in containers. So the only by manufacturing accounts for less than 50 percent of the
conclusion that seems reasonable to draw is that the final value of shipments as reported in the latest Census
seasoned agricultural exporters up and down California’s of Manufactures. Examples of processed agricultural
valleys have had little trouble finding enough TEUs to commodities include cereal flours, dairy products, canned
fill up with nuts to send over the Port of Oakland, from meats, canned fruits and vegetables, vegetable oils, animal
which the vast majority of the state’s—and therefore the hides, fur pelts, wine, and beer. Textiles, leather products,
nation’s—almonds and walnuts are loaded onto container distilled beverages, forestry, and fishery products are
ships bound for markets worldwide. (Most pistachio classified as nonagricultural commodities.
exports exit through the Ports of Los Angeles and Long
We fully appreciate that some readers may object to
Beach.)
the exclusion of lobsters and bourbon from the list. Our
Seaborne Agricultural Exports: Containers vs. sympathy knows no bounds. But please address your
Bulk Shipments complaints to the USDA. Otherwise, indulge yourself
Upon a reader’s request, we now offer up a bushel in the following two exhibits on bulk vs. containerized
of recent numbers on seaborne agricultural exports, seaborne agricultural exports. Remember, these are
differentiating containerized from bulk shipments by both the numbers for seaborne shipments only. They do
value and tonnage. We were able to find comparable data not include overland agricultural exports to Canada
going back to 2012, beyond which methodological and and Mexico. Nor do they encompass airborne exports
definitional changes cloud the statistics. of such perishables as fresh cherries, asparagus, and
strawberries. Tonnage figures are expressed in millions of
What’s behind the numbers we have? There’s always metric tons (mmts).
bound to be disagreement over agricultural trade
statistics. Start with the question of what to include. Exhibit 8 reveals that bulk carriers do the heavy lifting.
While crops grown on farms would certainly appear That’s expected given that over ninety percent of U.S.
to qualify, what about processed or manufactured soybean exports and over 97% of all exports of wheat,
foods? Should Idaho potatoes transported to fast-food corn, and grain sorghum are shipped overseas in bulk.
restaurants in Japan be lumped together with Twinkies The containerized share of the seaborne agricultural
shipped to Australia? Then there is the question of which export trade rose from 20.8% in 2012, the earliest year for
metric to use. The maritime industry prefers to measure which comparable statistics are available, and peaked at
shipments in tons or TEUs, depending on whether the 25.6% in 2019 before settling to 22.9% last year. During
goods are being transported in bulk or in containers. that period, containerized agricultural exports increased
June 2021 Page 9West Coast Trade Report
Detailing the April 2021 TEU Numbers Continued
to 42,999 mmt from 28,548 mmt, a jump of 48.9%. Bulk Year-over-year, bulk agricultural export tonnage to all
tonnage meanwhile grew to 143,330 mmt from 108,385 overseas markets leapt by 48.6% from the same period
mmt, a bump of 32.2%. In the first four months of this a year ago, while tonnage shipped in containers grew by
year, distribution of shares has been distorted by the 1.3%.
surge in bulk of soybean and grain shipments to China.
Exhibit 8 Seaborne Agricultural Exports: Containers vs. Bulk
Source: U.S. Commerce Department
Millions of Metric Tons
160,000
140,000
120,000
100,000
80,000
60,000
40,000
20,000
0
2012 2013 2014 2015 2016 2017 2018 2019 2020
n Containerized Tonnage n Bulk Tonnage
Jock O’Connell’s Commentary:
“Once More into the [Export Promotion] Breach, Dear Friends”
People in the maritime shipping industry habitually use In years past, U.S. government initiatives to boost exports
the TEU to chart the ups and downs of world trade. But were spurred by hand-wringing over the country’s balance
hardly anyone else does, and that can be a problem. of payments deficit. And since America last recorded
a balance of payments surplus in 1975 (and even then
Why’s that? Doesn’t every industry tend to be myopic
in measuring its accomplishments. Aren’t those whose hadn’t done so consistently since the 1960s), fretful
income depends on moving containers between ship and headlines—along with the sundry export promotion
shore as entitled to obsess about TEUs as lawyers are schemes they spawned—have routinely surfaced.
about billable hours? This time is different, though. The deficit driving the latest
It is up to the point where you start assuming that your calls for a NEP is not last year’s $676.68 billion trade
preferred metric is the one that should frame a debate imbalance. Instead, judging by who’s been doing the
over national trade policy. calling, it’s evidently being driven by anxieties stemming
from the soaring volume of TEUs that have been
Which gets us to the question of how a bracing logistical
departing for foreign shores completely empty.
challenge brought on by a once-in-a-century pandemic
should lead to calls for a National Export Plan (NEP). Hearings this month before the Federal Maritime
June 2021 Page 10West Coast Trade Report
Commentary Continued
Commission and the House Committee on Transportation In the current instance, unless Joe Biden is allowed to
and Infrastructure Subcommittee on Coast Guard and invest billions on the physical and digital infrastructure
Maritime Transportation served to bring the matter into that facilitates efficient and economical goods movement,
a disconcerting focus. The complaint, lodged mostly it and unless Americans start saving more, nothing will
seems by agricultural exporters, is that ocean carriers really change. A mere program of incentivizing exporters
(who are more and more being tagged with the pejorative won’t accomplish much more than antagonizing trading
epithet “foreign-owned”) have been thwarting American partners, while running the risk of violating any number of
exporters from exporting American goods, especially international trade agreements.
American food and fiber…at least by sea, at least in
Second, temporary dislocations—such as the clogged
containers.
supply chains caused by the pandemic—should never be
So here we have a logistical crisis, albeit one with broad used to define long-term public policy options. Like past
economic consequences, that has inspired proposals for plagues, this too shall pass. And when it does, we’ll likely
a national strategy aimed at, in the words of one leading see the re-emergence of the patterns and levels of trade
advocate, “incentivizing exports.” we saw before Tony Fauci became a household name. In
the meantime, congestion should not be misdiagnosed as
So why should this merit my raised eyebrow? sclerosis.
In part, because I’ve been to this rodeo before, indeed Third, containerized trade is simply not the sum total
repeatedly since I was studying economics in college of the nation’s export trade, although you might get a
back when the U.S. last had a habit of running trade different impression from reading the papers. Let’s break
surpluses. I remember the agonies of Gerald Ford down the numbers. To start, U.S. exports through April
and Jimmy Carter in wrestling with seemingly out-of- of this year have totaled $789.44 billion. Nearly 30% of
control deficits that would be dwarfed by the ones that that trade was in the form of services, while shipments
caused Ronald Reagan to devalue the dollar in 1985. I of goods accounted for the balance. Scoff if you will, but
listened as Barack Obama announced a National Export every dollar I and other non-incentivized service providers
Initiative in his 2010 State of the Union address, and I earn from a foreign client counts as much in the tally of
cringed as Donald Trump thought tariffs would be the the national trade account as every dollar a subsidized
hydroxychloroquine of trade policy. farmer in Iowa makes from shipping a container full of
rutabagas to Bolivia.
Still, the deficit so far this year is the worst since the Great
Recession struck in 2008. Then there’s the generally unacknowledged fact that
containerized shipments are a junior partner in America’s
Okay, are there other reasons to be skeptical about a NEP
merchandise export trade. Consider Exhibit A, which
apart from the nation’s less than spectacular track record
shows each mode of transport’s average share of the
in export promotion?
value of U.S. merchandise exports from 2015 through
First, let’s start with what all reputable economists 2020.
know instinctively to be true but cannot ever seem
As the export pie is sliced, the largest single share goes to
to adequately explain to politicians, journalists, and
“Other” which encompasses our prodigious overland trade
the general public. And that is that trade deficits are
with Canada and Mexico as well as the civilian aircraft
fundamentally macro-economic phenomena no more
manufactured by Boeing that are flown to their overseas
treatable by export incentives than were those ailments
customers. (Our North American trading partners, it’s
my dear mother remedied with Carter’s Little Liver Pills.
occasionally helpful to note, import just over one-third
Palliative elixirs, regardless of who’s selling the snake oil,
of our merchandise exports. And very little of it goes by
may give the illusion of relief, but only for a moment. At
water.)
worst, they divert attention from the more realistic but
usually more costly and arduous treatments. Fully 34.6% of America’s $1.424 trillion merchandise
June 2021 Page 11West Coast Trade Report
Commentary Continued
So containers, which play such an overwhelming role in
Exhibit A U.S. Merchandise Exports Mode of
Transport: 2015-2020 America’s import trade, account for the minority share of
Source: U.S. Commerce Department oceanborne exports.
Finally, there’s the matter of what we export in containers,
Shares of Export Dollar Value and therefore what the chief candidates for export
incentives may be. Each year about this time, the
venerable and esteemed Journal of Commerce, in concert
with its sisters-in-corporate-law organizations PIERS and
17.1% IHS Markit, puts out a list of America’s Top 100 Exporters.
It’s a curious list. Firms are ranked not by the value
35.3% of their exports but by the number of loaded export
containers they shipped abroad from U.S. seaports.
17.5% Someone unfamiliar with the diverse contours of the U.S.
economy might easily conclude from the Journal’s roster
of exporters that American industry is principally engaged
in the production of scrap materials and animal feed.
30.1%
Noticeably absent from the JOC list are names like Boeing
or Microsoft or ExxonMobil or Intel or Johnson & Johnson,
companies that are among the top U.S. exporters by
dollar value. They find no prominence on the Journal’s
n Containerized n Non-Containerized roster simply because they don’t make much use of
n Airborne n Other containerized shipping to reach their foreign customers.
Oil companies use tankers. High-tech companies and
cherry growers ship by air. And pilots fly Boeing’s jets to
their client airlines around the world.
export trade travelled by sea, with almost equal shares of
So, whether the goal is to boost America’s merchandise
moving in containers and bulk. Exceeding the combined export trade or merely to repair a politically sensitive
value of all seaborne exports are the exports handled surplus of empty outbound containers, it pays to know
by aircraft, either air-freighters or the lower decks of what we export and how we get it there.
passenger airplanes. The value share is way out of
Metrics count, sometimes erroneously.
proportion to the air feight tonnage involved, but that is
because items that are highly perishable or have high
value-to-weight ratios typically fly to market. This is why Disclaimer: The views expressed in Jock’s commentaries
the value of exports shipped through LAX easily exceeds are his own and may not reflect the positions of the
the value of exported merchandise shipped through either Pacific Merchant Shipping Association.
the Port of Long Beach or the Port of Los Angeles. It is
also why San Francisco International Airport routinely
handles half-again the value of exports shipped through
the Port of Oakland.
June 2021 Page 12West Coast Trade Report
Facts Are Stubborn Things
By John McLaurin, President
Pacific Merchant Shipping Association
A lot has been said lately about the need for 24-hour In addition, we can’t violate laws of physics. You can only
marine terminal gate operations. It appears to be the put so much cargo in one space at any given point in time.
default solution by some to “port congestion.” It’s a great
Despite all of these supply chain challenges, record
sound bite. It is a simple and easily understood solution to
amounts of cargo are moving through ports all over the
a complex and difficult problem—wherein lies the problem.
country—and during a pandemic when people were putting
We have a supply chain that is overwhelmed due to excess their health at risk by simply showing up to work. The
demand and cargo volume. Port congestion implies that Port of Los Angeles just announced the movement of
every other component of the supply chain is working one million TEU’s for one month, a “Western Hemisphere”
smoothly. It isn’t. record.
In August of last year, I participated in a conference I don’t doubt that there are individual specific problems.
call with port authorities, truckers, ocean carriers and But let’s acknowledge and be proud of what we have been
Beneficial Cargo Owner (BCO) representatives. The topic of able to accomplish in the past year. We have gone from
conversation: port congestion. overseas factories being shut down and commerce all over
the world coming to a standstill to the largest volume of
A BCO representative described the problem that he was
cargo ever moved through our ports, by our truck and rail
encountering in a very holistic and simple fashion. He
partners and final mile delivery drivers. We have delivered
stated:
record volumes of ag exports. And the supply chain
I have cargo in China, but I can’t get a box. delivered needed medical supplies and personal protective
When I get a box, I can’t get a ship. equipment all over the world.
When I get a ship, I can’t get a berth.
What should be done going forward?
When I get a berth, I can’t get a truck.
When I get a truck, I can’t get a chassis. First we need to work together to fully utilize the first and
When I get a chassis, I can’t find space at a warehouse to take second shifts before considering opening the gates 24/7.
the cargo. There is unused gate capacity during the first and second
shifts at LA/LB marine terminals (see graphic on page 14).
That isn’t port congestion—that is a supply chain that is
All parts of the supply chain need to be open and working
absolutely saturated with cargo.
to receive cargo.
Every container ship and every container in the world is
Second, governments should allow the separate areas
currently in use. Chassis are difficult to find—with on-
of the supply chain to draw down on the congestion and
street dwell time at a week or more (indicating their use
make continual progress without new rules or procedures
as a storage unit rather than a mode of conveyance).
that will make the situation worse.
Eastbound rail cargo has been held up at marine terminals
due to a lack of rail cars and rail power. And warehouses Third, government should utilize available funds to upgrade
and distribution centers are full. infrastructure for ports and transportation systems as a
critical part of the economic and job recovery program.
There isn’t empty equipment or space lying around unused.
Terminal operators and trucking companies have acquired Last, new laws and regulations establishing energy,
land to store containers, waiting for cargo owners to pick climate, and transportation goals should be evaluated for
them up. The same problems that exist in the United States their impact on supply chain efficiency goals. Mandating
are being experienced all over the world. changes that are not technically or economically feasible
June 2021 Page 13West Coast Trade Report
Facts Are Stubborn Things Continued
will have an impact on the ability of the supply chain to to acknowledge that we have a supply chain capacity
deliver goods in a timely manner. problem and to simply demand 24/7 gate operations while
ignoring every other component of the supply chain is not
Do we have serious problems and challenges? Yes, and
a solution.
we must work together to improve the system so it can
handle the large influx of cargo efficiently. But we have
Truck Gate Activity Per Hour at Container Terminals
Ports of Los Angeles and Long Beach
January 3, 2021 through April 3, 2021
200,000
180,000
160,000
140,000
120,000
100,000
80,000
60,000
40,000
20,000
0:00 1:00 2:00 3:00 4:00 5:00 6:00 7:00 8:00 9:00 10:00 11:00 12:00 13:00 14:00 15:00 16:00 17:00 18:00 19:00 20:00 21:00 22:00 23:00
Interested in membership in PMSA?
Contact Laura Germany for details at: lgermany@pmsaship.com or 510-987-5000.
PMSA Copyright © 2021
It is prohibited by law to forward this publication to any other person or persons. This material may not be re-published, broadcast,
rewritten or distributed without written permission from PMSA. Follow PMSA on Twitter @PMSAShip and Facebook.
June 2021 Page 14West Coast Trade Report
Import Dwell Time Is Up For May; Rail Dwell Time Is Down
June 2021 Page 15You can also read