2020 MINNESOTA SPRUCE GROUSE SURVEY - files
←
→
Page content transcription
If your browser does not render page correctly, please read the page content below
2020 MINNESOTA SPRUCE GROUSE SURVEY
Charlotte Roy, John Giudice, Chris Scharenbroich
Forest Wildlife Populations and Research Group
Minnesota Department of Natural Resources
Grand Rapids, Minnesota
1 September 2020
SUMMARY OF FINDINGS
         The Minnesota Department of Natural Resources (MNDNR) initiated the first annual
spruce grouse (Falcipennis canadensis) survey in 2018 with the help of dozens of cooperators
and citizen volunteers. In the second year of the survey, we invested additional effort to
determine sources of variation in fecal pellet detection through repeat surveys. We were going
to repeat this effort in 2020, but the COVID-19 pandemic prevented us from completing as many
repeat surveys as planned. Participants surveyed for spruce grouse pellets at 273 sites in 2018,
314 sites in 2019, and 241 sites in 2020. Spruce grouse pellets were detected at 79 sites in
2018 (proportional use = 0.29; 95% confidence interval (CI): 0.24–0.34), 87 sites in 2019 (0.28;
95% CI: 0.24–0.34), and 81 sites in 2020 (0.33; 95% CI: 0.28–0.40). Participants counted a
mean of 15.2 (95% CI: 8.8–21.6), 22.0 (95% CI: 14.7–29.3), and 21.2 (95% CI: 14.5–27.9)
pellet groups at used sites in 2018, 2019, and 2020, respectively. Based on our updated
Bayesian multi-season occupancy model, the estimated mean detection probability during initial
visits was 0.35 (95% credible interval (CRI): 0.29–0.42) in 2018, 0.36 (95% CRI: 0.31–0.43) in
2019, and 0.43 (95% CRI: 0.35–0.53) in 2020. However, the slightly higher mean detection
probability in 2020 may partly reflect the limited and clustered distribution of repeat surveys
completed due to the pandemic. This is important because if annual variation in detection
probability was large, then we would likely need to consider conducting revisit surveys each
year, or at least periodically. When adjusted for probability of detection, the estimated probability
of initial site use was 0.77 (95% CRI: 0.66–0.83) in 2018, 0.75 (95% CRI: 0.66–0.86) in 2019,
and 0.70 (95% CRI: 0.56–0.81) in 2020. We also found very little turnover in site use between
years, e.g., the probability of a site changing status between years was 0.12 (95% CRI: 0.05–
0.21) in 2018–2019 and 0.08 (95% CRI: 0.01–0.19) in 2019–2020. Thus, based on the 3-year
dataset, the spruce grouse population appeared to be stable or possibly decreasing slightly
(mean finite rate of change = 0.98 [95% CRI: 0.86–1.14] in 2018–2019 and 0.93 [95% CRI:
0.78–1.04] in 2019–2020, where a value of 1 denotes a stable population, >1 indicates an
increasing population, and 15% decline).
INTRODUCTION
        Spruce grouse, Falcipennis canadensis, are a conifer-dependent gamebird in Minnesota
and are expected to experience a range contraction due to climate change-induced habitat loss
(Scheller and Mladenoff 2005, Prasad et al. 2007, Iverson et al. 2008). Thus, spruce grouse will
likely have a more limited distribution in the southern portions of their range, which includes the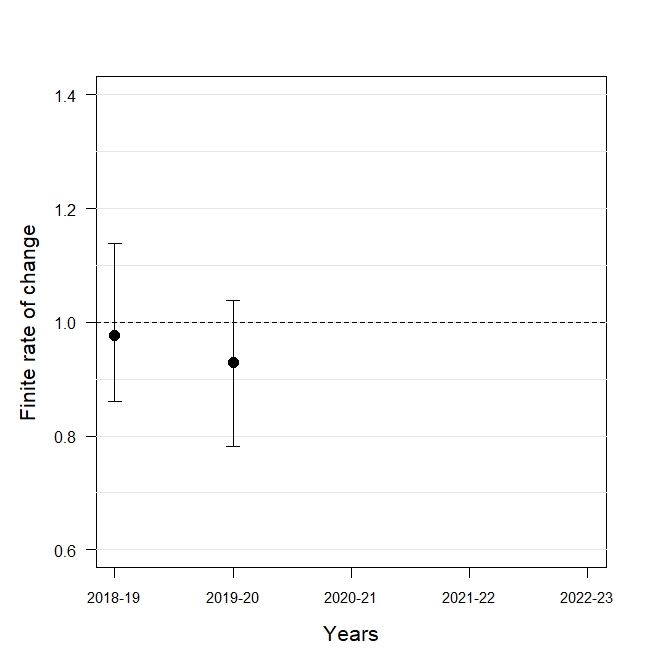
Great Lakes region, in the future. Minnesota is unique among the Great Lakes states in that it
still permits spruce grouse hunting, although they are a Species of Greatest Conservation Need
because they are vulnerable to decline (Minnesota Department of Natural Resources, MNDNR
2015). The spruce grouse is considered a Species of Special Concern in Michigan (Michigan
DNR 2005) and was listed as threatened in Wisconsin in 1997 (Wisconsin DNR 2004). Yet, the
only data the MNDNR collected on spruce grouse before 2018 was estimated total harvest as
part of the annual Small Game Harvest Mail Survey (Dexter 2016). Estimated total harvest of
spruce grouse has been 10,000–27,000 birds/year since 2006 (Dexter 2016). However,
variation in spruce grouse harvest among years may be more reflective of the number of ruffed
grouse (Bonasa umbellus) hunters; thus these harvest data cannot be used as a population
index for spruce grouse (Gregg et al. 2004).
         During 2014–2017, we developed survey methodology to provide an index of the spruce
grouse population (Roy et al. 2014, 2015, 2016, 2017, 2020). We evaluated an auditory survey
using playback of female cantus calls (Roy et al. 2020), which is the most common approach to
survey spruce grouse (Fritz 1979, Boag and McKinnon 1982, Schroeder and Boag 1989,
Whitcomb et al. 1996, Lycke et al. 2011), and also evaluated a fecal pellet survey (Roy et al.
2020) as a means to monitor the population. Fecal pellets are easily detected in late winter/early
spring as the snow pack dissipates and pellets that have been deposited and frozen during
winter become visible on the snow surface, indicating spruce grouse use of forest stands. The
pellet survey was more efficient and had higher detection rates than the auditory survey. We
also found road effects to be negligible in high-use cover types (e.g., jack pine (Pinus
backsiana) and black spruce (Picea mariana)). Thus, we designed a monitoring program based
on a survey of sites centered on road-based points (hereafter, survey “sites”) in spruce grouse
cover types dispersed across their range in Minnesota.
         In 2018, MNDNR launched the annual spruce grouse pellet survey with the cooperation
of biologists from the Chippewa National Forest, Grand Portage Band of Lake Superior
Chippewa, Leech Lake Band of Ojibwe, Minnesota Department of Natural Resources, Red Lake
Band of Chippewa Indians, Superior National Forest, 1854 Treaty Authority, Vermilion
Community College, and dozens of citizen volunteers. This survey is expected to be able to
detect meaningful changes in the population over a 10-year period (e.g., >15% decline) and is
intended to provide population information (i.e., status and distribution) that can be used to
make management decisions.
METHODS
          The pellet survey is comprised of 67 survey routes with 4-5 road-based sites per route
spaced >400 m apart. Each route has >1 point with >30% black spruce or jack pine habitat.
Observers use a Global Positioning System (GPS) to walk a circular transect with a 100-m
radius (i.e., 628-m length) centered on roadside sampling points. Observers record single
grouse pellets and roost piles
are repeated up to 5 times at a subset of sites (where seasonal technicians and/or volunteers
were available) to allow modeling of the detection process and to help determine whether repeat
visits will be necessary to account for annual variation in the detection process.
Beginning in 2020, we standardized our Bayesian model structure (Kéry and Schaub
2012, Su and Yajima 2015) based on what we learned in 2018–2019. That is, we did not
conduct an exhaustive variable-selection exercise in 2020. Our model contained the following
parameters for the initial state (in year 1): an indicator variable for the presence of jack pine
and/or black spruce, the proportion of the transect that went through spruce grouse habitat (in
year 1), and a random effect for the geographic clustering of sites into routes. For the
observation process, we included covariates for survey conditions (1-10, with 10 being very
good), visit, year, and a random effect for route. We did not attempt to use covariates to model
transition probabilities, although we did allow them to vary annually. We computed 95% credible
intervals (CRI) around estimates.
The COVID-19 pandemic affected spruce grouse surveys in 2020. Surveys are usually
conducted during March, April, and the first part of May to coincide with the timing of snowmelt,
such that some snow is still on the ground but melting and exposing pellets deposited during the
winter. Governor Walz issued Executive Orders 20-20 and 20-33, which restricted nonessential
field work by state employees and volunteers during 27 March – 4 May. The Governor issued
Executive Order 20-48 on 4 May, which allowed field research and monitoring to resume. The
MNDNR Commissioner approved some Wildlife Staff to conduct spruce grouse surveys
beginning 20 May, but survey conditions were suitable only in the most northern portions of the
survey region in late May and few surveys were conducted after 20 May.
RESULTS & DISCUSSION
In 2020, 53 of 67 routes (median 5 points per route, range: 2–5) were surveyed by 20
cooperating biologists, 6 citizen volunteers, and 2 seasonal technicians between 3 March and 3
June (Table 1, Figure 1). Spring 2020 was generally warmer with less snow than the previous 2
years. Because of the pandemic, fewer revisit surveys were conducted in 2020 (n = 112; 46% of
sites were visited 2-3 times) and revisits were mostly in the western portion of the survey region.
Observers detected spruce grouse pellets at 67 (26%) of 241 survey sites during the initial visit
and at 31 additional sites in revisit surveys. On average 15.1 (range: 1–119) spruce grouse
single pellets and roosts were detected in initial visits. Similarly, ruffed grouse pellets and roosts
were detected at 139 (58%) sites in initial visits with a mean count of 5.6 (range: 1–33) pellets
per used site. Observers detected pellets of both species at only 38 sites (16%) in 2020,
whereas pellets of neither species were detected at 78 sites (32%). This is similar to
concordance rates observed in 2019 (14% and 29%, respectively).
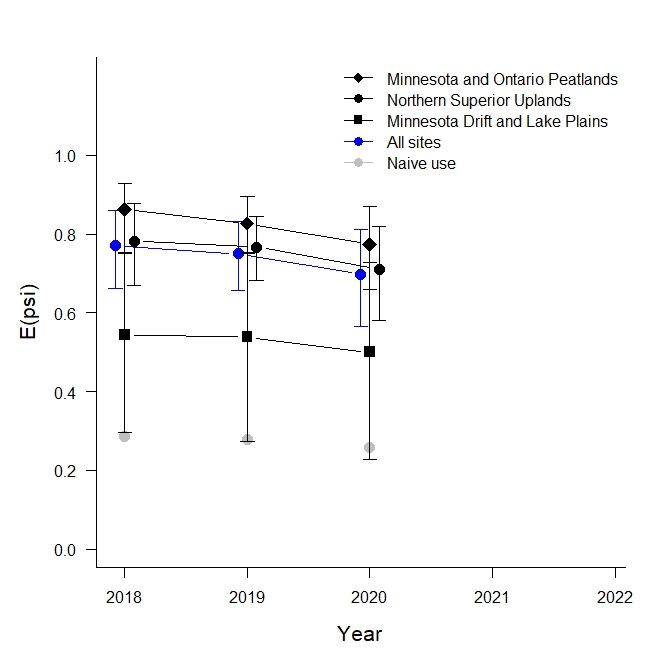
The overall probability of spruce grouse site use, adjusted for imperfect detection, was
0.77 (95% CRI: 0.66–0.86) in 2018, 0.75 (95% CRI: 0.66–0.83) in 2019, and 0.70 (95% CRI:
0.56–0.81) in 2020 (Figure 2). When survey sites were grouped by ecological section, the
Northern Minnesota and Ontario Peatlands had the highest probability of site use (mean annual
estimate = 0.82), followed by the Northern Superior Uplands (0.75), and the Northern Minnesota
Drift & Lake Plains (0.52). The latter seems high given naïve occupancy was 1 pellet
was detected in the initial survey) was much lower (0.35) than our model-based estimate of site
use (0.70) and was consistent with previous analyses. This difference is the result of imperfect
detection (i.e., many of the sites classified as “unused” after the initial survey probably had
3pellets that were present but not detected). If the conditional probability (i.e., given a site was
truly used) of detecting >1 pellet was close to 1, then a naïve estimate of site use based on a
single-visit survey would be sufficient for monitoring spruce grouse populations and their
distribution. However, if the mean conditional probability of detection is relatively low and the
detection process varies greatly over space or time, then a naïve estimate of site use might be
misleading. We estimated the mean probability of detection for a single-visit survey as 0.35
(95% CRI: 0.29–0.42) in 2018, 0.36 (95% CRI: 0.31–0.43) in 2019, and 0.43 (95% CRI: 0.35–
0.53) in 2020. This means that 57–65% of survey sites classified as “unused” in the initial
survey may have had spruce grouse pellets present but they were missed (overlooked) or not
available for detection (e.g., buried in the snow). Conducting 2 follow-up surveys for a total of 3
visits improved the conditional probability of detection to 0.61–0.71, which allows us to compute
a better estimate of true site use. In other words, by finding additional pellets in subsequent
visits (or not finding pellets at sites where they were detected previously), a correction factor can
be applied to account for missed pellets and produce a more accurate estimate of true site use.
Based on 2 years of data with repeat surveys, annual variation in the detection process
appeared to be negligible (i.e., range = 0.35–0.43) relative to other sources of sampling
variation. Thus, data collection next year will help verify that a single visit is sufficient to monitor
the population.
ACKNOWLEDGMENTS
Special thanks to G. Mehmel and S. Laudenslager for their suggestion and support of survey
development. Biologists at Grand Portage Band of Chippewa Indians, Red Lake Nation, 1854
Treaty Authority, Leech Lake Band of Ojibwe, U.S. Forest Service, and MNDNR Wildlife
provided valuable feedback on survey design and assisted with surveys. Special thanks to all
the cooperators and volunteers that assisted with this survey, with special thanks to cooperators
in the Superior National Forest and 1854 Treaty Authority who conducted additional surveys
during the COVID-19 pandemic in 2020. Seasonal technicians that assisted with repeat surveys
included L. Hause, A. Elliott, J. Bates, and N. Dotson. Citizen-scientist volunteers usually
include D. Johnson, A. Swarts, R. Anderson, J. Bigelow, G. Larson, J. Keenan, J. Asfoor, C.
Hagley, J. Elton Turbes, W. Fleischman, J. Riley, D. Beseman, A. Schayler, H. Ledeen, B.
Rothauge, M. Littler, A. Mollin-Kling, M. Bendel, C. Stignani, K. Boettcher, E. Gdula, C. Jensen,
G. Jensen, N. Malinowski, D. Kuder, M. Rothstein, D. Klett, J. Ridlbauer, A. Vinar, E. Berg, R.
Berg, D. Elliott, A. Krulc, A. Sporre, R. Langerud, N. Scheffler, M. Gabrys, and S. Anderson.
However, during the pandemic, citizen-scientist volunteers could not conduct surveys. L. Gilbert
assisted with paperwork for volunteers and logistics. L. Shartell and M. Carstensen reviewed
this report. This work was funded through the Federal Aid in Wildlife Restoration Act.
LITERATURE CITED
Boag, D. A., and D. T. McKinnon. 1982. Spruce grouse. Pages 61-62 in D.E. Davis, ed.
Handbook of census methods for terrestrial vertebrates. CRC Press, Inc., Boca Raton,
Florida.
Dexter, M. 2017. 2016 Small game hunter mail survey. 2016_Small_Game_Harvest_Survey
Fritz, R. S. 1979. Consequences of insular population structure: distribution and extinction of
spruce grouse populations. Oecologia 42:57-65.
Gregg, L., B. Heeringa, and D. Eklund. 2004. Conservation assessment for spruce grouse
(Falcipennis canadensis). U.S. Department of Agriculture Forest Service, Eastern
Region. 33 pp.
4Iverson, L., A. Prasad, and S. Mathews. 2008. Modeling potential climate change impacts on
trees of the northeastern United States. Mitigation and Adaptation Strategies for Global
Change 13:517-540.
Kéry, M., and M. Schaub. 2012. Bayesian population analysis using WinBUGS: a hierarchical
perspective. Academic Press, San Diego, California, USA.
Lycke, A., L. Imbeau, and P. Drapeau. 2011. Effects of commercial thinning on site occupancy
and habitat use by spruce grouse in boreal Quebec. Canadian Journal of Forestry
Research 41:501-508.
Michigan Department of Natural Resources. 2005. Michigan’s wildlife action plan SGCN status
and species-specific issues. Falcipennis_canadensis Last accessed July 24 2013.
Minnesota Department of Natural Resources. 2005. Minnesota’s Wildlife Action Plan 2015-
2025. Wildlife Action Plan 2015-2025 Last accessed 2 September 2020.
Prasad, A. M., L. R. Iverson, S. Mathews, and M. Peters. 2007-ongoing. A climate change atlas
for 134 forest tree species of the eastern United States. U.S. Forest Service Northern
Research Station, Delaware, Ohio. http://www.nrs.fs.fed.us/atlas/tree/ Last accessed 17
January 2017.
Roy, C., M. Larson, and J. Giudice. 2014. Developing Survey Methodology for Spruce grouse: A
Pilot Study. Pages 127-132 in Summary of Wildlife Research Findings 2013.
http://files.dnr.state.mn.us/publications/wildlife/research2013/forest.pdf#view=fit&pagem
ode=bookmarks
Roy, C., J. Giudice, and C. Scharenbroich. 2015. Monitoring spruce grouse in Minnesota: A
Pilot Study (2014-2015). Pages 38-53 in Summary of Wildlife Research Findings 2014.
http://files.dnr.state.mn.us/publications/wildlife/research2014/forest.pdf#view=fit&pagem
ode=bookmarks
Roy, C., J. Giudice, and C. Scharenbroich. 2016. Monitoring spruce grouse in Minnesota: A
Pilot study (2014-2016). Pages 69-92 in Summary of Wildlife Research Findings 2015.
https://files.dnr.state.mn.us/publications/wildlife/research2015/full.pdf#view=fit&pagemod
e=bookmarks
Roy, C., J. Giudice, and C. Scharenbroich. 2017. Monitoring spruce grouse in Minnesota: A
Pilot study (2014-2017). Summary of Wildlife Research Findings 2016. 2016 Spruce
Grouse Research Summary
Roy, C., J. Giudice, and C. Scharenbroich. 2020. Evaluation of cantus-call and pellet surveys for
Spruce Grouse (Falcipennis Canadensis canace) at the southern extent of their range.
Journal of Field Ornithology 91:44-63.
Scheller, R. M., and D. J. Mladenoff. 2005. A spatially interactive simulation of climate change,
harvesting, wind, and tree species migration and projected changes to forest
composition and biomass in northern Wisconsin, USA. Global Change Biology 11:307-
321.
5Schroeder, M. A., and D. A. Boag. 1989. Evaluation of a density index for territorial male spruce
grouse. Journal of Wildlife Management 53:475-478.
Su, Y., and M. Yajima, 2015. R2jags: Using R to Run ‘JAGS’. R package version 0.5-7.
CRAN.R project
Stevens, D. L., and A. R. Olsen. 2014. Spatially balanced sampling of natural resources.
Journal of the American Statistical Association 99(465):262-277.
Whitcomb, S. D., F. A. Servello, and A. F. O’Connell, Jr. 1996. Patch occupancy and dispersal
of spruce grouse on the edge of its range in Maine. Canadian Journal of Zoology
74:1951-1955.
Wisconsin Department of Natural Resources. 2004. Wisconsin endangered and threatened
species laws and list. Wisconsin Endangered and Threatened Species List Last
accessed 24 July 2013.
6Table 1. Spruce grouse (SPGR) routes and sites surveyed in northern Minnesota in 2020 by
staff, cooperators, and volunteers, and detections of SPGR and ruffed grouse (RUGR) pellets
(singles and roosts per used site) during initial visits. Citizen volunteers usually assist with
surveys in most survey areas, but the COVID-19 pandemic interrupted volunteer efforts in 2020.
No. citizen Sites Proportion sites Proportion sites used
Cooperator Area Routes
volunteers surveyed used by SPGR by RUGR
Aurora SNF1 1 3 14 0.00 0.93
Baudette DNR2 0 3 14 0.14 0.43
Bemidji DNR 0 2 9 0.00 0.22
Chippewa NF3 1 4 19 0.00 0.47
Cook SNF 0 4 20 0.15 0.65
Duluth DNR 0 2 9 0.00 0.78
Ely SNF 0 2 10 0.50 0.30
Grand Marais SNF 0 3 14 0.29 0.50
Grand Rapids DNR 0 1 4 0.00 0.75
I Falls DNR 0 3 13 0.15 0.23
Leech Lake Res. 0 2 7 0.00 0.29
Orr DNR 0 4 15 0.07 0.40
Red Lake Res. 0 2 9 0.00 0.89
Red Lake WMA 1 5 24 0.67 0.62
1854 Treaty Authority 0 4 20 0.80 0.65
Tofte SNF 1 5 22 0.46 0.54
Two Harbors DNR 1 3 13 0.08 0.92
Tower DNR 0 1 5 0.40 1.00
Total 0 53 241 0.26 0.58
Not Surveyed 32 15 77 -- --
1SNF= Superior National Forest
2DNR = Minnesota Department of Natural Resources –Section of Wildlife
3Some volunteers worked in groups on the same route, and some volunteers did routes in >1 work area.
7Figure 1. Distribution of sampling sites in northern Minnesota. Ecological Classification System
sections included the Northern Minnesota and Ontario Peatlands (n = 85 sites) in the northwest,
the Northern Superior Uplands (n = 188 sites) in the east, and the Northern Minnesota Drift and
Lake Plains (n = 44 sites) in the southcentral survey region.
8Figure 2. Estimated spruce grouse site use by Ecological Classification System section and
across all sections in northern Minnesota during 2018–2020. Expected values are based on a
hierarchical dynamic occupancy model and naive use is the proportion of sites where pellets
were detected in the initial survey. Error bars denote 95% credible intervals.
9Figure 3. Estimated finite rate of change in site use by spruce grouse in northern Minnesota
during 2018–2020 based on a hierarchical dynamic occupancy model. Values below the dashed
line denote a decrease in site use between years, whereas values above the line indicate an
increase in site use between years. Error bars denote 95% credible intervals.
10You can also read