2020 Q2 MARKET UPDATE AND OUTLOOK
←
→
Page content transcription
If your browser does not render page correctly, please read the page content below

2 0 2 0 Q 2 M AR K E T U P D AT E AN D O U T L O O K

MARKET UPDATE & OUTLOOK
Executive Summary – 2020 Q2
U.S. – Full Truckload U.S. – Bulk
Pre-March conditions softening Capacity remains strong
Mid-March hoarding created temporary capacity Partnerships are more critical given scarcity of specialized
shortages in essential markets equipment and soft conditions
April over capacity situation takes over across all Tale of two markets – essential and non-essential product
industries and geographies flows creating uncertainty in tier 1 supply chains
U.S. – Less than Truckload Mexico – Truckload
Volumes down Significant influence of government policy with restrictions
Shipment densities in flux due to recalibration of on labor and wages
customer and business strategies Automotive to ramp in coming weeks
Carriers with high operating ratios should be monitored Oil and travel sectors which are key economic drivers in
closely as the situation develops Mexico under pressure
Foreign exchange rate holding at ~24 Pesos/USD
U.S. – Intermodal Canada – Truckload / LTL
West Coast container imbalances stabilizing A reduction in southbound moves into U.S. are straining
Abundant dray capacity backhauls into U.S.
Competition with soft truckload market becoming more Drivers becoming more reticent to accept layovers –
fierce concerns about U.S. are affecting load acceptance
Opportunities for cost savings and higher service levels Some LTL carriers are beginning to limit rural activities
are abundant
International – Air International – Ocean
Continued significant rate volatility Blank sailings continue to as a means to balance supply-
Some airlines requesting forwarders to pre-pay for demand
blocked space 11 carriers currently at high risk in Altman Z-score
Reports of passenger space being used for critical cargo bankruptcy index
as PPE and other mission critical products are increasing Warehousing constraints exist for key non-essential supply
tonnage chains
MARKET   UPDATE   AND   OUTLOOK

U.S. FULL
TRUCKLOAD

FULL   TRUCKLOAD

               KEY FACTORS IMPACTING SUPPLY
• Pre-March 2020: Loose capacity conditions offering
  continued favorability for improved route guide
  performance and cost mitigation strategies across all
  modes including truckload.
• March 2020: Consumer hoarding from COVID-19
  created significant supply imbalances. Lower demand
  from non-essential markets, combined with record
  demand from essential consumer markets, created
  increased empty miles within the nation’s fleets and a
  loss of fleet productivity.
• April 2020: Within two to three weeks after the non-
  essential/essential disruption in March, the trucking
  market began to exhibit over supply marked by an
  increase in calls from carriers offering capacity and
  rapidly retreating spot rates.
FULL   TRUCKLOAD

CURRENT CONDITIONS
     D RY VAN T R E N D S
FULL TRUCKLOAD
TRANSPLACE 2020
W E E K LY VA N S P O T V S C O N T R A C T AV E R A G E R AT E S
Contract rates for dry van have been slowly trending upwards $2.08 over the last couple of weeks.
Spot rates have dropped sharply for the last couple of weeks at $1.71.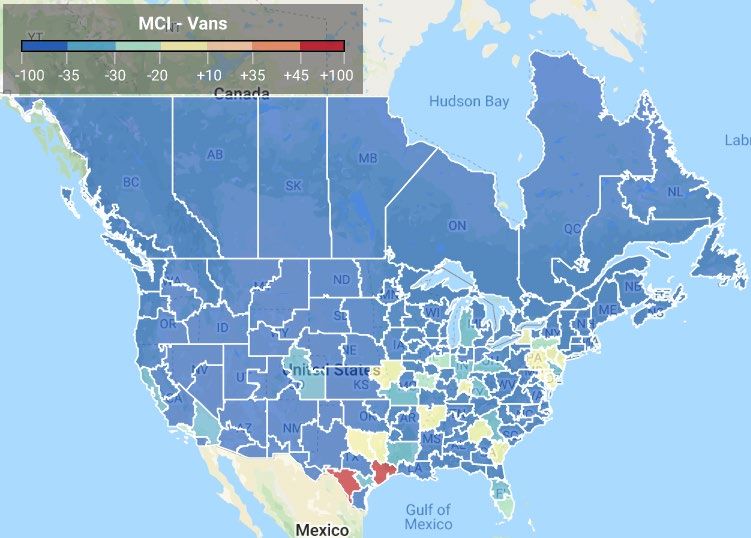
FULL TRUCKLOAD
MARKET UPDATE AND OUTLOOK
FREIGHT ENVIRONMENT
Freight Indicators
COVID-19 containment has dramatically changed the freight environment as most routine commerce has ended and
unemployment has surged.
Although freight volumes in most commodities have turned negative, panic buying in March led to a surge in demand for
transportation of food and certain items, such as paper and cleaning products. Transportation of a wide range of goods is
sharply lower due to extraordinary conditions in both supply and demand.
Social distancing has led to the closing of nonessential businesses, which has resulted in reduced opportunities for
consumer spending. The same factors also have led to an unprecedented surge in unemployment claims, which sharply
constrains disposable income.
The uncertainty surrounding COVID-19 impacts also chills business investment. A prior outlook for weak growth in most
commodities has now turned negative for most everything except food.
Freight Outlook
With the exception of near-term restocking of high demand items, the COVID-19 crisis will sharply reduce freight in both
industrial and consumer sectors.
Expedited van operations should benefit somewhat from the reduction in airfreight capacity as airlines dramatically cut back
on flights.
FTR’s total truck loadings forecast for 2020 is a 4.0% drop in total truck loadings in 2020, down from 1.3% growth prior to the crisis.
All segments now forecast for negative comparisons with 2019 except refrigerated.
Dry van loadings are forecast to fall 2.6% in 2020. The pre-crisis forecast was for growth of 0.7%. All major dry van commodities look
negative except food.
Refrigerated loadings are forecast to grow 1.3% in 2020, down from 2.2% growth previously.
Flatbed loadings are forecast to fall 6.0% in 2020. The pre-crisis forecast had been for 0.6% growth. The outlook for all major flatbed
commodities is negative.
Source: FTR Trucking Update – April 2020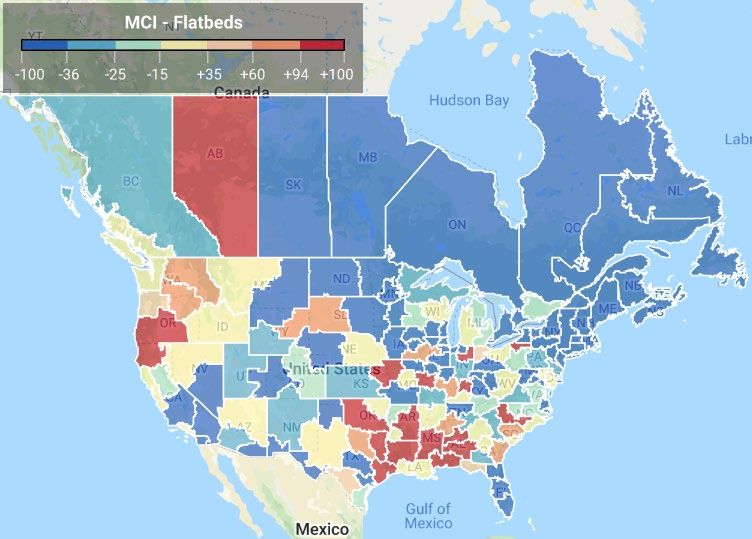
FULL TRUCKLOAD
MARKET UPDATE AND OUTLOOK
DIESEL PRICE OUTLOOK
Carrier Conditions
The Trucking Conditions Index is set to turn sharply negative. Positive readings are unlikely until mid-2021.
Diesel prices represent one of the few bright spots for carriers, although the collapse in crude prices could bring trouble for some in addition to fuel surcharge
credits unseen in recent decades.
The Trucking Conditions Index had weakened to just barely positive prior to the COVID-19 crisis. The outlook for March and April is stronger due principally to
rapidly falling diesel prices and slightly stronger utilization during the restocking push, but the TCI does not consider extraordinary factors, such as steps required
to protect drivers, sterilize facilities, adjust office arrangements, etc.
Beyond April, weaker utilization and rates likely will send the TCI solidly negative. The current forecast is for trucking conditions to remain negative until
mid-2021.
Diesel prices were at more than 49 cents (16%) during the first 12 weeks of the year. The national average diesel price for the week ending March 23 was $2.586
a gallon, which is the lowest price since August 2017.
Crude prices have collapsed due to a sudden drop in demand to a breakdown in OPEC as Saudi Arabia launched a price war in March to hurt
competitors, including Russia and the U.S.
Source: FTR Trucking Update – April 2020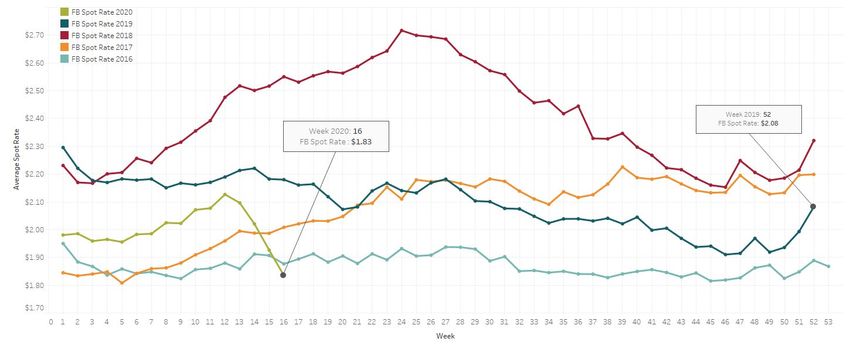
MARKET   UPDATE   AND   OUTLOOK

U.S. LESS-THAN-
TRUCKLOAD
LESS-THAN-TRUCKLOAD
KEY FACTORS IMPACTING DEMAND
S TAB I L I Z I N G TO N N AG E C O N T I N U I N G S O F T C O N D I T I O N S
Institute for Supply Chain Management (ISM) and
Purchasing Managers’ Index (PMI) is a good indicator of LTL
freight volumes as industry has significant exposure to the
manufacturing economy.
• A reading above 50 indicates manufacturing economy
is expanding.
• 2020 PMI reading have been over 50 (Jan = 50.9,
Feb = 50.1) after several months below 50.
COVID-19 has significantly impacted LTL volumes beginning
in late March, and carriers report shipment count is down
from 10% to 30%.
Average weight per shipment is declining; primarily due to
less TL spillover due to the softening of the TL market and
general economic conditions and less product being ordered
at a time.
Tonnage and shipment count are down, but average weight
per shipment is beginning to increase slightly.
Source: Stephens, Stifel and ISMLESS-THAN-TRUCKLOAD
KEY FACTORS IMPACTING SUPPLY
T E R M I N A L C O N S O L I D AT I O N & C O S T S T R U C T U R E
Terminal Reduction and Automation: Carrier Cost Structure:
The decrease in terminals was due to better utilization Labor dominates cost structure ranging from 56% to
of the service centers in addition to upgraded, larger 65% with ODFL, lowest OR in industry, leading with
service centers. 65% of cost.
Continued focus from carriers to better utilize Insurance & claims have been stable but expected to
technology to more efficiently operate terminal increase slightly in 2020.
operations and automate with customers to reduce
errors and labor expenditures. Purchased transportation ranges from 2.7% (ODFL) to
12.7% (YRCW).
Source: StifelLESS-THAN-TRUCKLOAD
CURRENT PRICING IMPACT
D U E T O S L O W I N G T O N N A G E , O P E R AT I N G R AT I O ’ S A R E F L AT T E N I N G
Operating Ratios (OR):
Overall, OR’s increased in 2019 vs. 2018, but XPO improved
significantly from 86.2% to 82.8%.
Primary reason is due to overall decline in tonnage followed by a
decrease in average weight per shipment which historically have lower
profitability.
Pricing discipline, improved technology (dimensioners & data), and
ability to more efficiently charge accessorials are primary factors driving
OR improvement, over recent years, in addition to expanding additional
value-add offerings that come at higher margins (guaranteed service,
MABD services, custom solution services, AK/HI/PR services, etc.).
Source: StephensLESS-THAN-TRUCKLOAD
2020 RATE OUTLOOK
Contractual Renewals:
Expect 2020 contractual renewals to be in low single digits.
• Maintaining and growing market share is critical to carriers.
• Carriers are still price discipline and if business is not profitable
a larger increase will occur.
• Low single digit contractual renewals are expected focused on
retaining market share.
COVID-19 will impact pricing as volume changes across carriers
networks are impacted.
Uncertainty on long-term impact of COVID-19 to LTL networks.
Driving Factors:
Yield is revenue per hundredweight and is trending positive due to a
reduction of average weight since it is a calculation of revenue per
hundredweight.
Focus on retaining current business levels while maximizing annual
increase renewal.
Focus on increasing market share on new business to off-set
declining tonnage levels.
Carriers are focused on reducing their internal cost when integrating
with shippers/3PLs in order to reduce the impact of increases.
Source: FTR & StephensLESS-THAN-TRUCKLOAD
INDUSTRY OBSERVATIONS
W H AT W E A R E O B S E R V I N G F R O M T H E M A R K E T
COVID-19 Carrier Impacts:
• Carrier’s report shipment count is down 10% to 30%
• Many carriers issued furloughs to counteract the significant reduction in volumes
• Many carriers implemented new signature process to reduce driver exposure and interaction
• Many carriers issued revised guarantee and return process to limit financial exposure
Carrier’s are focusing on automation to improve their operating cost
• Rate incentives and reductions are available to shippers
• Focus on “paperless BOL’s”
Carrier’s are focusing on retaining current business levels without negatively impacting OR and aggressively targeting
new business for growth.
Watch YRCW’s financials closely as they amended their credit facility on 4/8/2020 to temporarily waive its $200M LTM
adjusted EBITA maintenance covenant through 12/31/2020 to allow for greater financial flexibility.
Beaver Express, a small regional OK based LTL carrier, went out of business in March 2020.
Central Freight Lines announced definitive purchase agreement to acquire Volunteer Express, TN based LTL carrier,
in April 2020.MARKET UPDATE AND OUTLOOK U.S. INTERMODAL
INTERMODAL
KEY FACTORS IMPACTING SUPPLY
Dray Capacity:
Dray capacity continues to be plentiful across the intermodal network.
The dray carriers are considered essential businesses and therefore they are
fully operational during the coronavirus pandemic.
The AB5 legislation for California did not go through so it has been business as
usual there.
Equipment:
53’ intermodal equipment is still plentiful across the intermodal network. As
equipment builds on the West Coast due to the coronavirus pandemic,
equipment providers have repositioned some empty equipment to inland
locations.
There was a shortage of 40’ intermodal equipment inland in February and March
due to a lack of imports. This has improved in April and equipment providers
have lifted most of the embargos that were in place on westbound traffic. There
was significant congestion at the southern California ports in February and
March. That is no longer an issue as well.
Rail Service:
The railroads are considered essential businesses and therefore they are fully
operational during the Coronavirus pandemic.
Rail service continues to improve. One of the service measurements is the
average Intermodal train speeds. The results in the first quarter exceeded the
average for the last 10 years.INTERMODAL
KEY FACTORS IMPACTING DEMAND
Intermodal year to date volume was down 9% in the first quarter compared to
2019. The chart to the right has detailed results through February.
There continues to be a shift on imports from the West Coast to the
Southeast and Gulf Coast. This has negatively impacted volume off the West
Coast.
Chinese New Year and the coronavirus pandemic had significant impact on
imports for all regions in the first quarter. Import volume has started to
improve in April.
The volatility of the over the road truck market due to the coronavirus
pandemic generated some volume for Intermodal in March, but that has
dropped off in April.
Longer term supply issues for over the road will drive volume to intermodal.
Factors that will impact this include:
• The long-term shortage of drivers
• Bankruptcies
• An increase in the percentage of drivers required to be drug tested, a
federal mandate on hair follicle testing, and the launching of the
National Drug and Alcohol DatabaseINTERMODAL
CURRENT PRICING IMPACT, OUTLOOK AND
RECOMMENDATION
Railroads: In the first quarter, railroads
had continued to hold rates and in some
cases, they had been willing to take rate
reductions. Dynamic rates on westbound
lanes have increased due to the increase
in westbound demand and the drop in
eastbound volume.
Dray Carriers: The response varies by
market and by provider, but generally
speaking they are still willing to at least
hold rates.
Recommendation: With the current
volatility in the truck market and with the
long term over the road supply concerns,
this is still a great time to secure long term
Intermodal capacity and rates.
Source data and charts: FTR Intermodal Update - December 2019MARKET UPDATE AND OUTLOOK BULK TANK TRUCK
BULK

         KEY FACTORS IMPACTING SUPPLY

Carriers continue to invest     Adding new drivers            Carriers are focused on         Core asset based
  in retaining programs       overall still very much a     balancing lanes, resulting in   carriers need a steady
coupled with pay increases           challenge                opportunities for lower          flow of orders to
                                                                   linehaul rates            balance their lanes
BULK
CURRENT IMPACT
Overall market condition
The first quarter of 2020 coupled with the last two quarters experienced little change within
the bulk tank truck mode except for the increased demand by customers producing products
needed for high demand coronavirus end products.
Rate increases are not being tabled at this time. Core asset-based carriers are not taking
reductions in the primary lanes.
New business lanes experiencing stable rate structures.
Significant YOY improvement in the following areas:
Lead time capacity coverage has been reduced due to coronavirus.
Primary and secondary tender acceptance rates have increased significantly during April with
a significant drop in the usage of bulk brokers.
Broker usage has continued to decline with spot rates dramatically declining.
Favorable backhaul opportunities in the core lanes of Houston/Chicago/North Jersey/Atlanta.BULK
CURRENT IMPACT
Note: Shippers manufacturing commodities for end-users related to virus are experiencing different results.
Southeast Northeast
Significant turn around over last year where Inconsistent capacity as demand has fluctuated day-
capacity has vastly improved. to-day and week-to-week.
Coverage can be secured with 2 to 3 days Regional short haul more capacity constrained
notice. versus long haul based on increased long haul
focus.
Opportunities for rate reductions depending on
“in-network” destinations. Recommend Strategic RFP.
Recommend a strategic RFP direction for this
market segment.
Midwest
Capacity eased YOY, however carriers are still
Southwest looking for inbound into this market.
Increased production investments of $130 billion Short haul has limited additional capacity due to
have materialized into new demand. limited capacity additions and long haul preferences.
Capacity significantly increased resulting in Capacity on long haul to core chemical markets has
aggressive pricing for new business. increased due to better asset utilization.
Recommend open RFP for this market segment. Recommend Strategic RFP.BULK
MARKET UPDATE AND OUTLOOK
We are expecting to see ramped up volumes from mid-May moving forward.
Bulk tank truck conditions should experience an uptick as a result of the virus impact.
Fuel is decreasing, helping to reduce/offset linehaul costs.
The current expectation is that the bulk market will offer flat to moderate increases (2 to
4%) in the back half of 2020 as pricing is expected to regain normal inflationary levels.
As the virus market conditions improve, we should experience a return to strong primary
and secondary tender acceptance.
Broker assuage for capacity should continue to see stable/reduced linehaul rates.
Quality driver shortage still remains a major headwind market condition for this mode.BULK
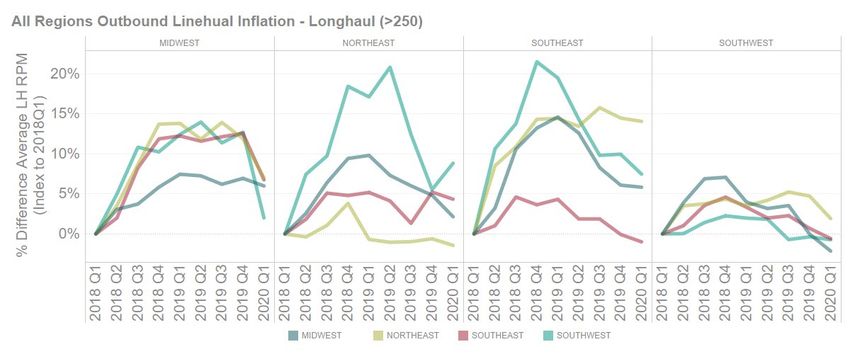
REGIONAL RATE TRENDS
Quarterly region to region averages for linehaul only
> 250 miles
Relative deltas to 2018Q1
Basic approach, but:
• Consistency in average LoH over time
• Consistency in average CPL over time
• Patterns are relatively consistent
• Sufficient for general market direction
Excluded Western region because not passing consistency checksBULK TRANSPLACE REGIONAL RATE TRENDS
BULK

AAR CHEMICAL RAIL VOLUMES
MARKET   UPDATE   AND   OUTLOOK

MEXICO
MEXICO
KEY FACTORS IMPACTING SUPPLY
U.S. Customs and Border Protection (CBP) announced a new website for COVID-19
updates. The website has information for the trade community issued by CBP as well
as links to information for Partner Government Agencies.
The automotive industry continues with many manufacturers closed. We expect plant
openings between May 4 and May 17. As soon as the manufacturers start ramping up,
capacity for exports could be absorbed creating capacity issues for other industries.
Mexico’s GDP Banxico (Banco de Mexico) forecast came out at -3.5% for the balance
of 2020, but other analysts expect worse results.
Total sales of commercial trucks in Mexico plunged 46.8% in March, according to
Mexico's National Association of Manufacturers of Buses, Trucks, and Tractor-trucks
(ANPACT).
Class 8 truck sales fell 42.7% to 532 units sold in March, compared to 928 the same
time last year (ANPACT).MEXICO
KEY FACTORS IMPACTING DEMAND
Economic and pandemic crisis impacts are creating unemployment, and are
also starting to affect transportation and theft, which could start increasing
during this period.
The Mexican government announced lockdown measures will be extended
until May 30; however, in locations where there are no COVID-19 cases,
people are expected to gradually return to activities on May 18, while
implementing social distancing measures.
The Mexican government announced on April 21 that Mexico has officially
entered Phase 3 of the pandemic, which is the most serious stage in the
spread of the coronavirus.
The exchange rate in Mexico continues to fluctuate but is still much higher
than the last few years at a historic of 19 pesos per dollar. We expect the F/X
fluctuation to maintain in the 23-25 pesos per dollar for the foreseeable
future.
This indicator affects transport companies in Mexico that have income in
pesos as all their parts and some of their payments could be based on U.S.
dollars. Importers will also be affected with higher costs creating less
equipment and capacity for export materials in Mexico.MEXICO
CURRENT IMPACT
Nuevo Laredo and Laredo authorities are restricting travel between ports and building
capacity, prohibiting individuals from traveling between the hours of 10:00pm to 6:00am
daily and limiting the number of individuals per location to 10 people.
Both U.S. and Mexico Customs authorities confirm border operations between U.S. and
Mexico continue on normal schedules. Port information including hours can be
found HERE.
Mexico Customs confirms all airports, land ports, and seaports continue operating on
normal schedules.
Most border cities have enforced the use of face protection for all types of locations and
outdoor activities.
The exchange rate continues to fluctuate at a historic high of $24 pesos per U.S. dollar
affecting the import of some goods into Mexico.MEXICO
OUTLOOK AND RECOMMENDATIONS
The Mexican economy is slowing down, therefore demand of freight is slowing down. This is
a good time of the year to negotiate 2020 rates in Mexico for domestic and cross-border
freight. Be mindful that any significant changes in supply, capacity, or demand in services
could lead to unanticipated outcomes as government policy and industry sectors can and will
change without much notice.
Carriers will be appreciative of reasonable volume and rate commitments for next year and
potentially over a two-year period which could be beneficial for both the shipper and carrier;
however, two-year commitments can be strained in a recovery.
Intermodal capacity for cross-border freight is available at most of the export ramps. Also, it is
a good time of the year to negotiate volume and rate commitments for 2020.
Shippers should increase security awareness as theft in the central part of Mexico
surrounding the Veracruz-Mexico City-Queretaro corridors is increasing.
It is now the time of the year to review C-TPAT programs and reinforce security processes for
exporters to the U.S.MARKET UPDATE AND OUTLOOK CANADA
CANADA
KEY FACTORS IMPACTING SUPPLY
Carrier capacity at this time remains strong, although at times ‘bumpy’, as the incidence of declined
tenders (some at the last minute) has increased. There certainly has been increased communication as
carriers are continuing to reach out looking for loads.
There are a number of COVID-19 related trends that are impacting carrier capacity:
• An emerging trend over the past week is that drivers are becoming reluctant to move loads that
require travel more than 24 hours away from their homes.
• The most concerning issue is that with the growing incidence of cases within the U.S., an
increasing number of Canadian based drivers are no longer willing to cross the border to move
loads destined to the U.S. This is especially the case the longer the length of haul, as drivers are
concerned with securing a return load north and of falling ill so far from home.
• Canadian manufacturing facilities are beginning to close or scale back production. The ripple
effect is that fewer loads are moving south, thus reducing the capacity to move northbound loads
out of the U.S.
• There is also a degree of misinformation causing confusion within the carrier community. Many
shippers have now provided letters to drivers moving their goods, outlining the essential nature of
the products being moved.
The very early result of the above trends is that carrier rate levels, especially on moves greater than
roughly 500 miles are beginning to escalate.CANADA
KEY FACTORS IMPACTING DEMAND
After the sluggish economic activity of Q4 2019, but prior to the COVID-19 situation, the Canadian economy
was expected to show improvements in 2020. Understanding the major uncertainties around global trade
tensions and difficulties in the oil sector, Canada’s economic outlook for 2020 was improving as a result of
stronger residential construction, as well real estate investment and household consumption were continuing
to gain ground.
Fast forward to mid-March and many provincial governments have declared a ‘state of emergency’ with the
intent of shutting all non-essential services and ‘physical distancing’ has become the new norm.
In order to reduce uncertainty within this environment, the Canadian government has recently introduced a
series of unparalleled economic measures to provide both Canadians and Canadian businesses with
financial programs in an attempt to stabilize the economic impact which this COVID-19 situation will have on
the Canadian public. Regardless, many companies are dealing with many unknowns.
With world oil prices falling as a result of the combined factors of the COVID-19 outbreak (less demand for
fuel) and the Saudi decision to break from the other OPEC+ members and produce more oil, the Canadian
dollar has weakened considerably in mid-March and currently sits at 70.6 cents to the U.S. dollar (March
30). As a comparative, on January 1, 2020, the Canadian dollar was at 77.0 cents.CANADA
CURRENT IMPACT
Most Canadian carriers are continuing to operate essentially at full capacity and calls are continuing to
be received from carriers offering their services. Some ‘hot buttons’ within our current environment
include:
• The current and growing concern is that with the increasing incidence of COVID-19 infections, particularly in
certain states within the U.S. Canadian drivers are becoming increasing reluctant to move loads into the U.S.
There is a heightened degree of anxiety within the driver community.
• Beginning to see an increase in tendered loads being given back, primarily due to drivers not available.
• Off-load times and out-right delays at many facilities are now beginning to tie-up drivers and equipment.
• Load planning on multi-stop trips are now having to take into consideration these delays.
• With the closure of many non-essential businesses, LTL carriers are taking additional steps to ensure that
freight can be delivered, including returning shipments back to shippers at full cost. Many LTL carriers are also
scaling back their service to more rural areas as the volume of freight has fallen.
Through the present COVID-19 situation, there has been an unprecedented level of communication
between Transplace and customers, working collaboratively to ‘troubleshoot’ issues and develop
‘workarounds’ to ensure uninterrupted service and the most cost effective solutions.
Through Q1 2020, prior to the present situation, there had been minimal rate action (negotiated GRI’s)
from the major carriers handling our customer’s freight activity.CANADA
CURRENT IMPACT
Results of benchmarking Q1 Canadian dry van spot rates on key geographic markets from Toronto and
Montreal:
Q4 '19 to Q1 '19 to
Q1 '20 Q1 '20
Between Toronto & Montreal :
TOR TO MTL flat down 5.2%
MTL to TOR stable - down 0.7% down 4.1%
To Western Canada :
Ex TOR up 2.5% down 1.0%
Ex MTL down 0.5% up 4.2%
To Atlantic Canada :
Ex TOR up 4.2% up 3.7%
Ex MTL down 4.1% down 6.6%
Southbound Cross-border - Short down 1.4% down 5.9%
Southbound Cross-border - Long up 0.5% down 2.8%
Source : TransCore LinkLogisticsCANADA
OUTLOOK AND RECOMMENDATIONS
Volumes in the food and CPG industries domestically will continue to remain higher than normal.
Many receiving facilities are experiencing a high volume of inbound freight. This coupled with reduced
labor in many facilities is leading to a host of ‘trickle-down’ issues:
• Increased off-load times and the tying-up of drivers and equipment
• Many shippers are moving orders direct and bypassing intermediate warehouses
• Last minute cancellation of orders, some even in route, thus requiring other options
• Off-load times have impacted the transit timing of multi-stop loads
• Given the nature of multi-stop truckload trips, there has also been an increased emphasis on developing trips
that are more ‘carrier friendly’ – fewer stops and an increased recognition of how long to complete the entire
trip
The next couple of weeks will be interesting. Will the freight flow remain as it has been for the past
week (post the initial surge), or will parts (segments / regions) of the industry begin to downsize or
outright shut down? We are beginning to see more evidence that supports the latter.
Work with key providers to understand their risks and forge cost reduction strategies that are
sustainable where the greatest financial risk and exposure exist. Bridging through the crisis will be key
in Canadian markets where specialized capabilities are needed.CANADA
MARKET UPDATE AND OUTLOOK ANECDOTES
COVID-19 will likely lead to a number of residual forces that will have an influence on North American
supply chains:
• Many of the network ‘workarounds’ that have been driven in response to COVID-19, such as
increasing the amount of direct deliveries and by-passing warehouses, as well as reconsidering
one’s MOQ policies, to drive less labor requirements, will continue. These network cost
considerations will lead many companies to re-evaluate best practices.
• Bricks and mortar retail, a sector already in a precipitous decline, is seeing online shopping being
used by millions who had never previously shopped online. Many of these shoppers will not return
to physical stores. The growth in last mile ‘small package’ deliveries will soar. This demand will
open up new opportunities and will force existing LTL fleets to more closely consider how they
handle residential deliveries.
• The trickle-down effect is enormous. Supply chains may have to quickly adapt to reconfigured
networks. What is the optimal trade-off: regional DC’s versus a greater number of ‘district’ hubs?
Companies transportation management systems will adapt and integrate to ‘last mile’
environments.MARKET UPDATE AND OUTLOOK INTERNATIONAL
INTERNATIONAL

COVID-19 GLOBAL SUPPLY CHAIN IMPACTS
U.S. ports and warehouse and freight transportation providers will remain open as essential services.
60% of air cargo capacity has been removed from the market.
• Air freight spot market heavily impacted by cancellation of commercial passenger flights. TAC Index data shows air rates from
Shanghai to North America are up 70%.
• Shippers will continue to face tighter air freight capacity and higher rates as medical supplies and perishables get priority.
• U.S. passenger airlines are using passenger planes to move cargo for the first time in decades.
Most Chinese manufacturers are back online but some factories have reduced production due to a shortage of raw materials and
skilled labor.
Sea-Intelligence Maritime Consulting has forecast a 10% decline in container shipping demand, equivalent to 17m TEU.
Container shipping industry better positioned for slower growth due to the pandemic than passenger airlines states Rahul Kapoor,
head of research and analytics for IHS Markit. Carriers will exercise discipline collectively in regards to slashing capacity when
demand plummets. New container ship orders is at the lowest point in a decade demonstrating discipline.
The global pandemic will force corporations to approach sourcing in a new manner including contingency inventory, safety stock
approaches, network redundancy, multi-supplier agreements, and the end of just-in-time that will profoundly impact future supply chain
management.
Use of Force Majeure is being cautioned by insurance companies as to invoke the clause is much harder than common belief.INTERNATIONAL COVID-19 GLOBAL SUPPLY CHAIN IMPACTS
INTERNATIONAL
IMO 2020 CURRENT MARKET CONDITIONS
Declining bunker fuel prices are nullifying benefits of
installing scrubbers on container ships.
Very low-sulfur fuel oil (VLSFO) has decrease 60% since
early January.
Spread per metric ton between VLSFO and high-sulfur
fuel oil (HSFO) is just $65, down from $300 January 6.
Due to lag in bunker fuel surcharge assessment on
current shipments, shippers are paying fuel surcharges
based on VLSFO in January while carriers are
purchasing fuel at much lower prices in current market
which gives carriers positive cash flow in short term.
MSC is the first major ocean carrier caught carrying non-
compliant high-sulfur fuel. MSC Joanna, 9,784 TEU
post-panama vessel, has been prohibited from operating
in UAE waters for 1 year. MSC is investigating internally.INTERNATIONAL
OCEAN CONTAINER TRADES
Transpacific Eastbound to U.S. U.S.- South America Container Trade
TPEB container spot rates impacted by COVID-19 Containerized trade growth between U.S. and South America
since Chinese New Year have been relatively flat decelerated last year. Volumes grew 2.5% in 2019 compared to
but volumes appear to be recovering although not 5.9% in 2018.
surging to where ship space is tight.
Carrier Updates
Week 11 spot market showed double digit growth
Hapag Lloyd outperformed other ocean carriers recording a net profit
but slight dip in market for Week 12 (↓ 4.4% to
of $418M in 2018. The carrier has warned of the impact of
USEC & ↓ 3.8% to USWC).
coronavirus on 2020 earnings.
Transatlantic Trade
CMA CGM reported a $229M net loss in 2019.
Cargo volumes increased on trans-Atlantic routes
in 2019, ports of NY/NJ dominant U.S. import
gateway. Total containerized trade U.S. – EU
increased 4.1% to 5.67m TEU. 2018 growth was
4.5%.
U.S. imports account for 65% and exports 35%.
Houston has seen strong export growth U.S. to
EU, 11% increase in 2019 YoY, total 342,471
export volume.
Top two ports in EU are Antwerp and Rotterdam
for this trade.INTERNATIONAL U.S. CONTAINER VOLUMES
INTERNATIONAL
U.S. – CHINA TARIFF UPDATE
U.S. imports from Asia saw a year-over-year decline in 2019 for the first time in a decade due to
the trade war: 10% decline in Chinese imports. 2018 decline in U.S. imports from Asia was 2.2%.
The last interruption in steady growth on the Transpacific Eastbound container volumes occurred
during the 2008-09 global economic recession where imports from Asia in 2009 declined 14.2%,
specifically China imports decreased 12.4%.
USTR (Trade Representative’s) office is soliciting comments on lifting additional tariffs on imports
to battle the coronavirus pandemic.
• Exclusions have been granted recently for medical products from China including masks,
examination gloves, and antiseptic wipes.
• Trump administration resistant to broader removals of imposed tariffs.INTERNATIONAL
OTHER NEWS OF INTEREST
FMC Demurrage And Detention Rulemaking: Shippers, transportation intermediaries (OTIs) and truckers want
the Federal Maritime Commission (FMC) to finalize and publish its new interpretive rule addressing fair demurrage
and detention charges at U.S. ports. https://www.fmc.gov/proposed-interpretive-rule-on-demurrage-and-detention-
issued/
U.S. East Coast Port Momentum: Data shows that in the ongoing rivalry for Asia inbound cargo between the U.S.
West Coast, and East Cost ports, the U.S. East Coast continues to gain momentum. Container freight indexes
demonstrate that long-term rates continue to decline for West Coast ports and are increasing for East Coast ports
although anomalies such as the trade war and COVID-19 influence these patterns.
ICTSI Portland – ILWU Damages Negotiations: In November 2019, a jury awarded ICTSI Portland $93.6M in
damages the ILWU would pay due to tarnishing the reputation of the port of Portland through work slowdowns and
decreased productivity. A U.S. district court in March 2020 reduced the amount to $19M. ICTSI declined the reduced
offer on March 20, so a new trial will be held to negotiate the amount of the award. The guilt of the ILWU will not be
reconsidered.
PIL (Pacific International Lines) Pulls out of Transpacific Trade: In mid-February, PIL announced it was
departing the Asia – North America service. PIL had been deeply impacted by the downturn in global container
trades and collapse in traffic due to ongoing Chinese trade war and coronavirus pandemic. PIL is currently in talks
with creditors on debt repayment plans. The carrier sold six 11,923 TEU capacity vessel and it’s South Pacific
subsidiary, Pacific Direct Line.
CMA CGM Joining Gray Chassis Pool in Memphis: CMA and APL joining the pool makes this less likely there will
be chassis shortages should volume spike post COVID-19 recovery. Gray pool, open choice enthusiasts believe it
increases shipper efficiency, provides more affordable and timely chassis access, and improves on time container
arrival at terminals and vessel loading, keeping bookings on vessels intact. Need for chassis splits should be
reduced as well.T R U C K L O A D APPENDIX
WEEKLY SPOT     RATE   INDEX

            TRANSPLACE 2020
AV E R A G E S P O T R AT E I N D E X B Y O R I G I N R E G I O N S – W E E K 1 6
                                     VAN
WEEKLY SPOT RATE INDEX
DAT TRENDLINES
N AT I O N A L S P O T R AT E S : VA N , F L AT B E D , R E E F E R
Downward trend has not flattened out yet
There's not much good news for truckers this week. Spot rates continue to fall for vans, reefers, and flatbeds, and declining load-to-
truck ratios signal that a rebound is not happening just yet. The weak freight market reflects the economic malaise due to coronavirus-
related shutdowns and historically low oil prices.
Source: DAT Trendlines Apr 13th, 2020 to Apr 19th, 2020 –https://www.dat.com/industry-trends/trendlinesWEEKLY SPOT RATE INDEX
DAT TRENDLINES
N AT I O N A L VA N D E M A N D A N D C A PA C I T Y
Source: DAT Trendlines: Apr 13th, 2020 to Apr 19th, 2020 https://www.dat.com/resources/trendlines/van/demand-and-capacityWEEKLY SPOT RATE INDEX
VAN HEAT MAP
L A S T 7 B U S I N E S S D AY S
Dry van load-to-truck
ratio heat maps, the
darker the color, the
tighter the capacity.
Source: DAT L/T – Previous 7 days– Apr 13th, 2019 to Apr 19th, 2020
https://marketmaps.dat.com/defaultWEEKLY SPOT RATE INDEX
TRANSPLACE 2020
W E E K LY VA N S P O T V S C O N T R A C T AV E R A G E R AT E SWEEKLY SPOT RATE INDEX
MORGAN STANLEY TL FREIGHT INDEX
D RY VAN
Source: Morgan Stanley Research; *2007-2017 average trend line excludes financial crisis years of 2008 and 2009WEEKLY SPOT RATE INDEX TRANSPLACE 2020 W E E K LY AV E R A G E VA N S P O T R AT E
WEEKLY SPOT    RATE   INDEX

TRANSPLACE 2020
W E E K LY AV E R A G E VA N C O N T R A C T R AT E
WEEKLY SPOT         RATE    INDEX

                                                             DAT TRENDLINES
                                                        N AT I O N A L F L AT B E D D E M A N D A N D C A PA C I T Y

Source: DAT Trendlines : Apr 6th, 2020 to Apr 12th, 2020 https://www.dat.com/resources/trendlines/flatbed/demand-and-capacity
WEEKLY SPOT RATE INDEX
FLATBED HEAT MAP
L A S T 7 B U S I N E S S D AY S
Flatbed load-to-truck
ratio heat maps, the
darker the color, the
tighter the capacity.
Source: DAT L/T – Previous 7 days– Apr 6th, 2019 to Apr 12th, 2020
https://marketmaps.dat.com/defaultWEEKLY SPOT RATE INDEX
TRANSPLACE 2020
W E E K LY F L AT B E D S P O T V S C O N T R A C T AV E R A G E R AT E SWEEKLY SPOT RATE INDEX TRANSPLACE 2020 W E E K LY AV E R A G E VA N C O N T R A C T R AT E
WEEKLY SPOT         RATE    INDEX

                      MORGAN STANLEY TL FREIGHT INDEX
                                                                                       F L AT B E D

                                                                                         Through April 15

Source: Morgan Stanley Research; *2007-2017 average trend line excludes financial crisis years of 2008 and 2009
WEEKLY SPOT RATE INDEX
TRANSPLACE 2020
W E E K LY AV E R A G E F L AT B E D S P O T R AT E
• Only lanes > 250 milesWEEKLY SPOT RATE INDEX
CASS FREIGHT INDEX REPORT
MARCH 2020
Highlights from March's indexes:
North American freight volumes fell 10.1% year over year in February, marking the
largest decline since 2009
With excess capacity, truckload linehaul rates remain down year over year (-6.6%)
Intermodal shipping costs are continuing to fall, showing a decrease of 4.4% y/y in
March
And this ends any chance of 2Q20 seeing y/y growth in domestic U.S. shipments
and freight costs. This has quickly gone from a China production concern to a U.S.
(and global) consumer spending problem. No business, no jobs, and no income for
many leads to much less freight moving around.
Source: CASS Freight Index Report – March 2020 https://www.cassinfo.com/freight-audit-payment/cass-transportation-indexes/march-2020WEEKLY SPOT RATE INDEX
CASS FREIGHT INDEX REPORT
VOLUME PERSPECTIVE
• Shipment volumes dropped 9.2% vs March 2019 levels
(Chart 1), but the index improved sequentially for the
second straight month off the January bottom. April will
undoubtedly be worse and likely the worst month in a
long time
• There has been a clear divide between winners and
losers of these shut-in orders with demand for groceries,
home improvement, e-commerce, and consumer staples
increasing, while restaurant, auto, and (mall) retail falling
to practically zero volume.
• .
Source: CASS Freight Index Report – March 2020WEEKLY SPOT RATE INDEX
CASS FREIGHT INDEX REPORT
EXPENDITURES PERSPECTIVE
Enough About Volume and Demand, What About Pricing?
Back to the Cass Index, freight expenditures, like shipment volumes, also fell in March, down 8.2% y/y The gap between volume
and spending comps continues to close, as pricing has been adjusted lower in the truckload market.
We expect transport pricing growth to stay soft this month and next, but we’re watching capacity exits and a potential re-stocking
event to drive rates higher again later this year.
Source: CASS Freight Index Report – March 2020WEEKLY SPOT RATE INDEX
CASS FREIGHT INDEX REPORT
TL LINEHAUL INDEX
• The Cass Truckload Linehaul Index (Chart 5), measuring per-mile linehaul rates, takes a look at the largest (and most
fragmented) market in the domestic transportation landscape. Linehaul rates declined 6.6% y/y in March (the worst comp
reported since June 2009), as rates remained under pressure through the end of the seasonally soft first quarter.
Source: CASS Freight Index Report – March 2020You can also read