2021 BUDGET PRESENTATION - OUR PLAN FOR DELIVERING VALUE TO OUR CUSTOMERS - Grant County PUD
←
→
Page content transcription
If your browser does not render page correctly, please read the page content below
2021 BUDGET
PRESENTATION
OUR PLAN FOR DELIVERING VALUE TO OUR CUSTOMERS
Topics Covered

     Budget Initiatives &
                            Strategic Initiatives
     Process

     Summary of Results     Appendix – Scenarios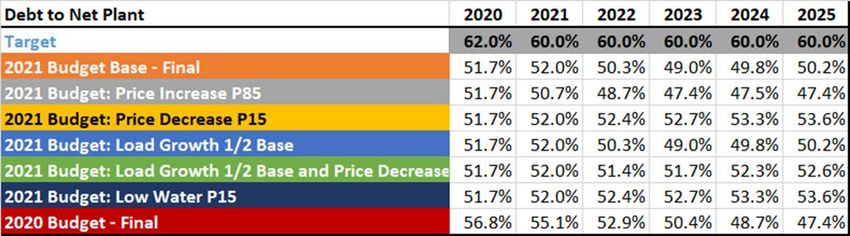
Keys for the Budget & Planning
 Process

                                       Invest in      Invest in Key
1. Provide value for current and        Assets         Technology
   future Grant PUD customers
2. Maintain the utility’s financial
   health                              Contain        Reduce Need
                                      Controllable   for Future Rate
                                        Costs           Increases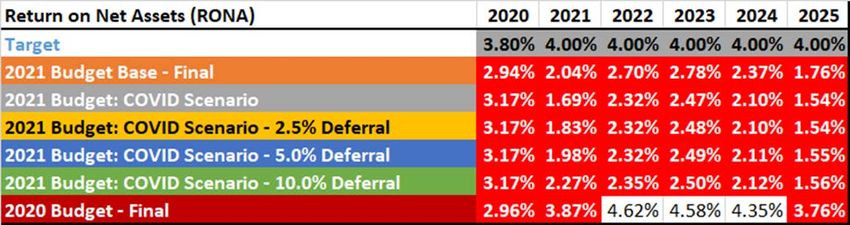
01
Major Budget Initiatives &
Budget Process

Major Budget Initiatives & Process

2021 Budget aligned with customers’
top priorities:
•   Provide reliable electric power with few outages.
•   Good customer service.
•   Provide real-time information and communication on energy, use and outages.
•   Keeping electricity prices as low as possible.

                                                             Source: 2019 Customer Satisfaction Survey
Major Budget Initiatives & Process

Major 2021 Budget Initiatives:
1.   Grant PUD’s financial position
2.   Implementation of data optimization – continuation of process
3.   Labor / headcount needs to be balanced with strategic initiatives
4.   Refinement of Enterprise Project Portfolio Management (EPPM) for Capital
Major Budget Initiatives & Process

2021 Budget Process:
1. Bottom up input from all cost centers for O&M and labor
2. Chief executive officer (CXO) review and request for revisions
3. Refinement of O&M and labor with cost centers
4. Capital spending expectation refinement with EPPM and Project
   Management Office (PMO)
5. Second round CXO review
6. Budget for Public Presentation

02
Strategic Initiatives Overview
Strategic Initiatives Overview:
  Operational Excellence
Organization: Human Performance Improvement, Corrective Action Program, Continuous Improvement, and Organizational
Change Management, that coordinate with Organizational Leadership and Development.

Defined: Operational Excellence is a mindset from which the organization can continuously improve, provide value to our
customers, and increase our competitive advantage and reliability.

Vision:
Every employee can see the flow of value to the customer and improve, maintain or fix that flow before it breaks down.

When something goes wrong, employees have the principles and tools to fix the problem without being dependent on
management to provide the solution. Employees focus on improving, maintaining and repairing the flow while management
focuses on growing and improving the business of the organization.

Results:
Increased organizational reliability and resiliency.
Increased visibility for meeting customer needs and providing valued services.
Strategic Initiatives Overview:
 Organizational Leadership & Development
Strategic Plan Objective #2: Design and sustain an engaging & fulfilling Grant PUD culture.

Mission: We exist to support organizational health by creating clarity around how we lead, train and treat people at Grant PUD.

Vision: To reinforce a people-centric culture where employees acknowledge problems, focus on possibilities and share
responsibility for their growth.

Key Actions (examples, not complete list):

Education and Training – Leadership Training, Building Resiliency Series

Onboarding Orientation – Minimize anxiety and early unknowns, ensures early alignment & awareness of organizational culture,
values & norms, increases speed to productivity

Employee Engagement – Surveys on organizational health, rewards & recognition, effective management skills

Workforce Development – Job shadows, education reimbursement, long range resource planning, succession planning
Strategic Initiatives Overview:
  Tech Roadmap
• Technology Roadmap is under refresh to incorporate lessons learned since rollout in late 2018, and
  to incorporate changes in direction from new business leadership.

• Budget reflects a slowing in the pace of change for technology to allow business and IT to stabilize
  and normalize operations for technology deployed in 2020 (CCS and HCMS).

• GEN2/ESRI will consume significant resources from IT and T&D in 2021 to enable successful roll-out
  in early 2022.

• Key opportunities in 2021 include Enterprise-wide Asset Management and Core Financial System
  refresh.
03
Summary of Results
Total expenses for 2021 (before offsets)
All figures in Millions                    2018         2019        2020      2020      2021
                                          Actual       Actual       YEP      Budget    Budget
Operations & Maintenance –Total:          $112.7 $126.4 $137.7 $126.6 $143.6
     Electric System O&M – Total:          $37.6        $52.2       $59.2     $55.7     $59.4
          Electric System O&M – Direct:            *            *    $20.9     $23.9     $22.4    *Historical
                                                                                                 breakout not

          Electric System O&M – Labor:
                                                                                                   available
                                                   *            *    $38.4     $31.7     $37.0

     Priest Rapids Project O&M – Total:    $75.1        $74.2       $78.5     $70.9     $84.1
          PRP O&M – Direct:                        *            *    $32.5     $32.7     $39.5

          PRP O&M – Labor:                         *            *    $45.9     $38.2     $44.6

Taxes:                                     $16.8        $17.9       $17.7     $18.3     $18.1
Total expenses for 2021 (before offsets) – Cont.
All figures in Millions 2018 2019 2020 2020 2021
Actual Actual YEP Budget Budget
Capital –Total: $125.1 $123.7 $131.3 $140.7 $143.3
Electric System Capital – Total: $44.0 $57.2 $69.6 $61.1 $73.7
Electric System Capital – Direct: * * $60.4 $42.7 $60.7 *Historical
breakout not
available
Electric System Capital – Labor: * * $9.3 $18.4 $13.0
Priest Rapids Project Capital – Total: $81.2 $66.5 $61.7 $79.6 $69.7
PRP Capital – Direct: * * $49.6 $62.6 $52.4
PRP Capital – Labor: * * $12.1 $17.0 $17.2
Debt Service (net of rebates): $86.5 $87.8 $73.0 $85.2 $75.6
TOTAL: $341.1 $356.9 $359.7 $370.9 $380.6Operations and Maintenance Expense
2020 O&M by Functional Org
Cost Type 2021
Administrative and General Labor $81.6
39%
Purchased Services $32.8
General & Administration $11.4
Operating Materials and
$7.6
Equipment
Information Technology $6.2
Power Production Power Delivery
39% 22% Risk $2.6
Transportation $1.4
Total $143.6
All figures in millions; non-operational adjustment allocations estimated
Purchased Services includes utilities
• Operations and maintenance (O&M) expense includes both labor and operating expenses, net of labor to capital.
• Total 2021 O&M of $143.6M can be reviewed programmatically in three categories.
• Split by functional organization remains both largely constant over the five-year period and unchanged from
past budgets.2021 Power Production O&M
Cost Type 2021
Fish & Wildlife
Labor $30.6
29%
Purchased Services $16.4
General & Administration $5.8
Engineering
13% Operating Materials and
$2.9
Equipment
Information Technology $0.1
Lands & Risk $0.0
Maintenance and Ops Recreation
41% 8% Transportation $0.0
Cultural Resources
6% Total $55.8
Wholesale Marketing All figures in millions; non-operational adjustment allocations estimated
3% Purchased Services includes utilities2021 Power Delivery O&M
Cost Type 2021
Fiber Crew
31% Labor $24.2
Purchased Services $2.6
General & Administration $0.9
Engineering
18% Operating Materials and
$3.3
Equipment
Information Technology $0.1
Risk $0.0
Construction and Maintenance Transportation $0.0
Dispatch
37%
14%
Total $31.1
All figures in millions; non-operational adjustment allocations estimated
Purchased Services includes utilities2021 Administrative & General O&M
Cost Type 2021
Employment Services
Labor $26.8
11%
Customer Solutions
10% Purchased Services $13.8
Information
Technology General & Administration $4.7
23% Risk, Audit and Compliance
7% Operating Materials and
$1.4
Equipment
Finance
7% IT $6.0
Risk $2.6
EPMO - EPPM
6% Transportation $1.4
Internal Services
28% External Affairs Total $56.7
4%
General All figures in millions; non-operational adjustment allocations estimated
Management 4% Purchased Services includes utilities2021 Consolidated Capital Plan
Budget 2020 = $105.2M Budget 2021 = $113.1M Current vs Budget = $7.9M
$4,312 , 4% $13,135 , $5,520 , 5% $(2,176), - $1,209 , 6%
13% 10%
$20,194 , $26,434 ,
$18,017 ,
19% 23%
16%
$(4,426), -
21%
$13,299 ,
63%
$67,603 ,
$63,176 ,
64%
56%
Fitness/Purchases Run Grow Transform Fitness/Purchases Run Grow Transform Fitness/Purchases Run Grow Transform
Note: Costs exclude Internal Labor
$113 Million in 2021
• RUN: Operational requirement to maintain current or core business/capabilities. - Something that is typical for a like situated firm to undertake on a regular
basis. Operate & Maintain
• GROW: Specifically done for expanding current business/capabilities. - Something that significantly improves efficiencies of scale or expansion of a core
business/capability. Enhance & Expand
• TRANSFORM: Introduction of a new business/capability. - Something that introduces a new strategic capability. Innovate & Drive2021 Electric System Capital Plan
Expected ELEC Capital (2021 Dollars, $M) ELEC System, Budget 2021 = $60.7M
$70.0
$60.7
$57.3 $55.7
$60.0 $54.1 Fitness/Purchases ($23.8M)
$52.5 8%
Miscellaneous (0.2%)
$50.0 13%
Transportation (2%)
$40.0 39% Run ($24.6M)
Technology (2%)
Facilities (10%)
$30.0
Fiber/Broadband (24%)
Grow ($7.6M)
$20.0 T&D (61%)
Annual ELEC Capital
$10.0 40%
Transform ($4.7M)
$-
2021 2022 2023 2024 2025
Note: Costs exclude Internal Labor
Major 2021 ELEC System Capital: Major Transmission/Distribution Capital:
• Fiber Expansion • Substations
o Expected to spend more than $11M of direct capital project dollars for 2021 o Design Build Phase 2 - Royal City Substation, Baird
Substation, Burke Substation
• Design Build Phase 2 o Mobile Substations (41MVA)
o Expected to spend more than $26M of direct capital project dollars for 2021 o South Ephrata Substation
o 76% of the project dollars are associated with 4 projects
• Transmission
• Significant Facilities Work o Design Build Phase 2 - Mtn View Capacitor Bank, Red
o Expected to spend more than $6M of direct capital project dollars for 2021 Rock Transmission Line
o Major work for both the Ephrata and Moses Lake Service Centers o Rapids-Columbia (with BPA)2021 Electric System Capital Plan –
Load Growth
• Forecast over Forecast, load growth rates decrease by 2.1% for 2020-2029
• Expected load growth continues to outpace the historical rate of 3.6%
o The increasing growth rate is associated with new large customers2021 Priest Rapids System Capital Plan
Expected PRP Capital (2021 Dollars, $M) PRP System, Budget 2021 = $52.4M
$70.0 2%
$55.6 $57.2
$60.0 $54.0 6% Fitness/Purchases ($3.4M)
$52.4 $52.4
20%
$50.0 Miscellaneous (2%)
Technology (4%) Run ($37.9M)
$40.0
Turbine/Generator (12%)
$30.0 Facilities (16%)
Powerhouse (67%) Grow ($10.2M)
$20.0
Annual PRP Capital
$10.0
72%
Transform ($0.9M)
$-
2021 2022 2023 2024 2025
Note: Costs exclude Internal Labor
Major 2021 Priest Rapids Project System Capital:
• Powerhouse
o Priest Rapids Embankment Improvements - Expected to spend more than $16M
o Priest Rapids Project Station/Substation Refurbishment/Replacement
o Priest Rapids Dam Unit Controls
• Priest Rapids Turbine Upgrade - Expected to spend more than $13M, PR Generator Rewind - Expected to spend more than $5.5M
• Other
o Fish & Wildlife - Expected to spend ~$1M
o Wanapum Left Embankment - Expected to spend ~$1M2021 Capital Plan – Technology
2021 Capital Plan – Internal Services
/Facilities
Expense Offsets for 2021 Budget

1. Contributions in Aid of Construction…………($6.5M)
   (Money paid by customers to build infrastructure)
2. Sales to Power Purchasers at Cost……......($17.8M)
   (As required by our Federal License)
3. Net Power (expenses minus revenue)……..($77.8M)
   (Net of market power purchases and sells)
4. Conservation Loans…………………………...($0.1M)
   (Money paid back from low-interest
   conservation loans to customers)
5. Total Offsets …………………………………($102.1M)
6. Total Expenses after Offsets………….......$278.4M
Preliminary Budget Summary –
Total Expenditures
Preliminary Budget Summary –
    Net Position

                 **
 **Annual Rate
  Adjustments
   set at 0.1%
beginning 2021
Preliminary Budget Summary – Key Metrics
04
Appendix - Scenarios
Events that could have a
significant impact on budget
Operational Scenario Descriptions
6 Scenarios – provide metrics impact for movement in volatile parts of Grant PUD operations
• Scenarios that provide insight on Grant PUD's exposure to wholesale prices, that is selling and buying from
the market when Grant’s resources don't match load needs.
• High wholesale prices (P85, prices only higher 15% of time)
• Low wholesales prices (P15, prices only lower 15% of time)
• Scenarios that show how Grant PUD's financial metrics respond when load growth (electricity sales to retail
customers) slows down from expected growth.
• Low load growth at ½ growth rate of base forecast
• Low load growth (½ Base) combined with low wholesale prices (P15)
• Scenario that provides the impact of changing water conditions on the Columbia River
• Low water (P15, water flow at dams only lower 15% of the time)
• Looked at scenario where wholesale slice deals, beyond Morgan Stanley are also netted. The only impact
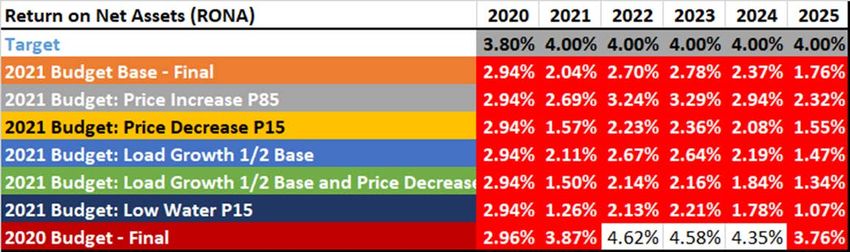
was to improve Days Cash on Hand for 2021.Operational Scenarios – Comparison to Base Budget
Operational Scenarios –
Comparison to Base Budget
Operational Scenarios –
Comparison to Base Budget
Operational Scenarios –
    Priest Rapids Remaining Availability Load Growth

•   Grant’s total rights
    (physical and
    financial) to the
    project are
    exhausted in 2023

•   Grant County retail
    customers’ loads won’t
    surpass expected
    project capabilities until
    after 2030
COVID Scenario - Assumptions
Major Assumptions:
• Sales/Loads
• Sales Forecast: Sales Reduction based on research from EIA, NRECA, CAISO, NY
ISO, ISO NE, Southwest Power Pool, and Midwest ISO
• Average of 5.3% expected retail sales reduction due to COVID recession
• Duration: 50% return to “Normal” post 2021 Q3, 20% post 2021 Q1, and 30% post
2022 Q1
• Wholesale Assumptions
• Supply for wholesale increased due to less retail sales
• Price decrease to match P15 scenario from base financial forecast scenarios
• O&M and Labor reductions in 2021 for COVID Scenarios
• -2.5%
• -5.0%
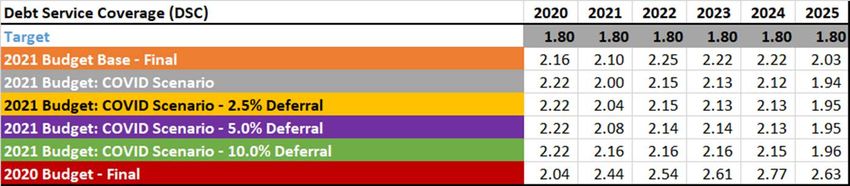
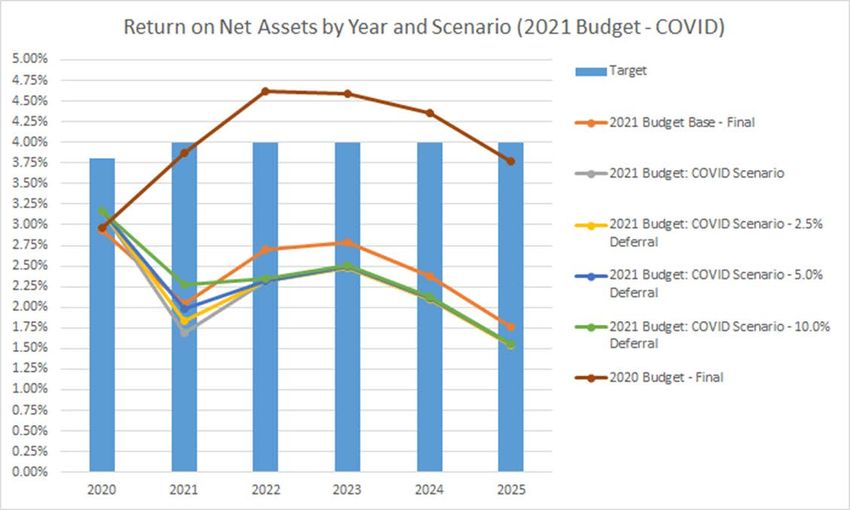
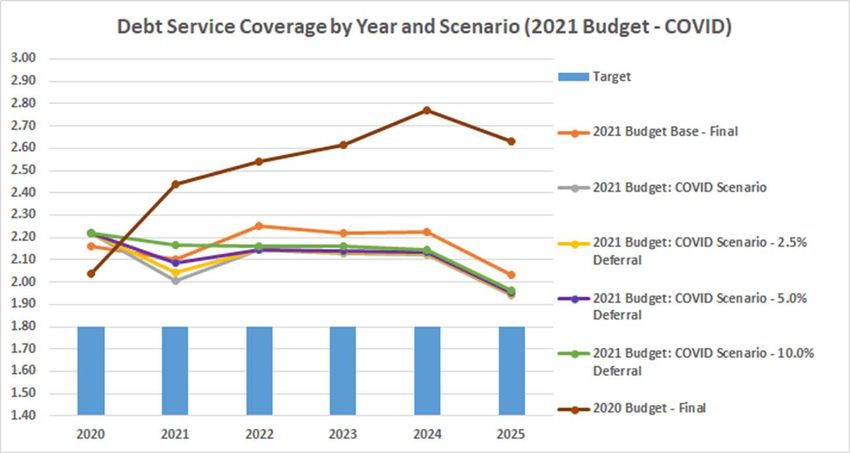
• -10.0%COVID Scenarios – Comparison to Base Budget
COVID Scenarios –
Comparison to Base Budget
COVID Scenarios –
Comparison to Base Budget
You can also read