2021 COMMUNITY PROFILE - KITIMAT - District of Kitimat
←
→
Page content transcription
If your browser does not render page correctly, please read the page content below
KITIMAT

2021
COMMUNITY
PROFILE
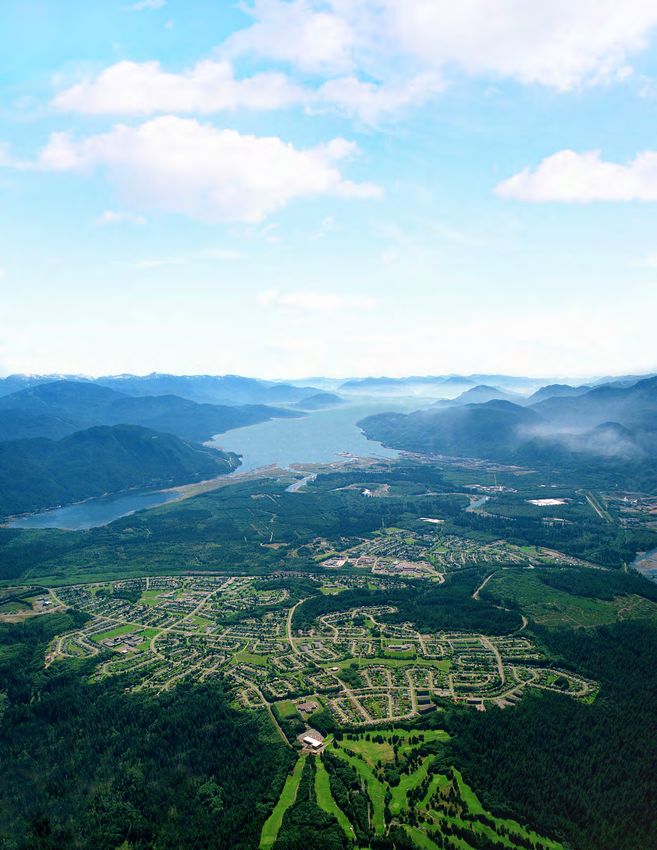
TABLE OF
 CONTENTS
01   GENERAL INFORMATION
02   Location
03   History
06   Climate

08 DEMOGRAPHICS
09   Population
09   Ethnic Origin
10   Citizenship
10   Place of Birth
11   Mother Tongue
12   Mobility Status
13   Immigrant Population
13   Age Distribution
14   Education
16   Housing
17   Labour Force Activity
18   Income

19   ECONOMIC SECTORS
20   Rio Tinto BC Works
21   Tourism
23   LNG Canada
01
GENERAL
INFORMATION

              1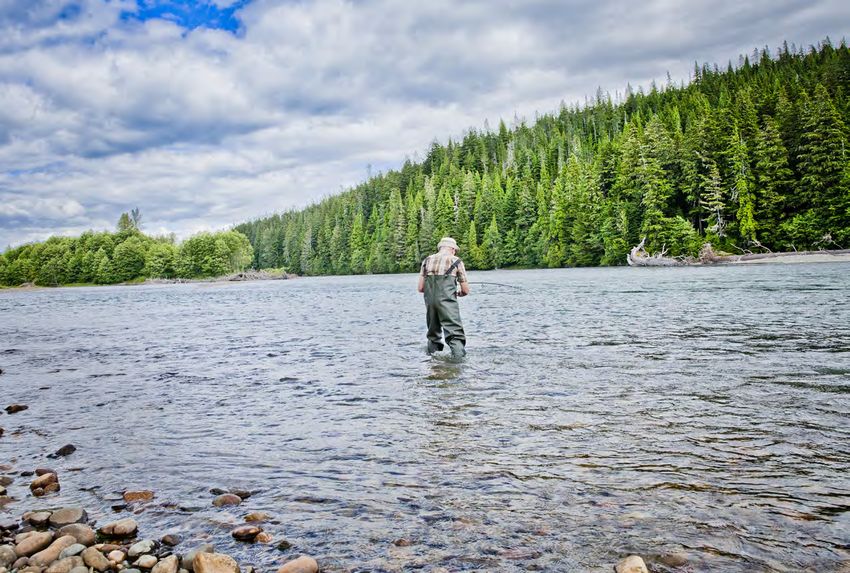
BRITISH
          COLUMBIA
                               ALBERTA                                   MANITOBA

                                              SASKATCHEWAN

           VANCOUVER
PACIFIC                                                                                    ONTARIO
OCEAN

                                         LOCATION
                                         Kitimat is a Pacific Rim gateway located
                                         approximately 650 km northwest of Vancouver
                                         and 110 km east of Prince Rupert. Kitimat sits
                                         at the head of Kitimat Arm, a wide fjord that
                                         extends northeast from Douglas Channel. The
                                         surrounding Coast Mountains create a sheltered
                                         harbour 90 km from open water, suitable for
                                         deep sea transport. A predominantly flat valley
                                         more than 5 km wide connects Kitimat to
                                         Terrace, 60 km to the north.

                 Incorporation Date:     The Kitimat townsite currently occupies

              March 31, 1953             approximately 7.5 km2 of land on the east side
                                         of the Kitimat River. Port and industrial areas
                         Land Area:      cover an additional 4.75 km2 on the west side
                     240.01 km2          of the river, downstream from the townsite.

                                                                                               2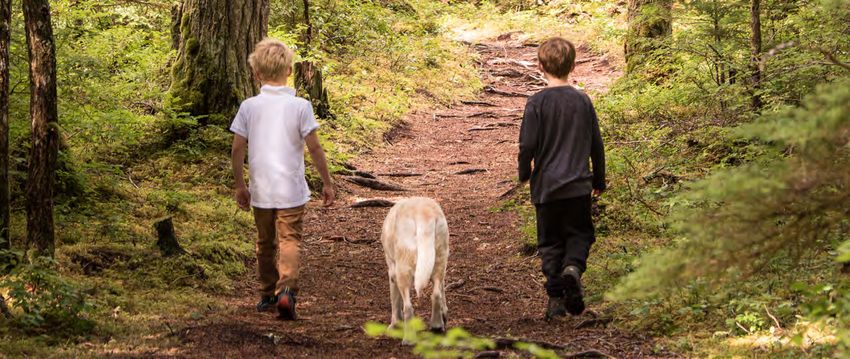
HISTORY
Long before the first European settlers moved to    Rupert was chosen for the railway terminus. A
the Kitimat Valley, the Haisla Nation had estab-    provincial reserve prevented further piecemeal
lished a summer village on the east shore of        development. By 1941, all but a few of these
Kitimat Arm. Winter quarters were located about     early European settlers had departed.
3 km upriver. The native economy was based
primarily on salmon and oolichan fishing. Fields    The modern town of Kitimat became a reality in
at the winter village were cultivated, and struc-   1950, when the Aluminum Company of Canada
tures were erected to store fish caught during      (Alcan) chose a site at the head of Kitimat Arm
the summer and fall months.                         for an aluminum smelter. The potential for, and
                                                    proximity of, hydroelectric power was a major
In the early 1900s, Kitimat was a candidate site    factor in selecting the site. A dam was built
for the Grand Trunk Railway’s western terminus.     on the Nechako River and a tunnel was drilled
A railway route was surveyed and by 1906, set-      through the Coast Mountains, allowing water to
tlers moving into the valley had created a land     fall 792 metres inside Mount Tahtsa to the Ke-
boom. A wharf and hotel were built and the          mano powerhouse at sea level. The powerhouse
right-of-way for a road to Terrace was cleared.     is connected to the Kitimat smelter by an 82 km
This activity was short‑lived, ending when Prince   transmission line.

                                                                                                      3
Construction of the Kitimat townsite was also a        major retail stores, commercial buildings and
major undertaking. Wilderness was transformed          government offices located in the downtown
into an eye-catching town that could attract           centre. In keeping with the pedestrian friendly
workers and lead to permanent home devel-              town planning, the downtown centre is orga-
opment. With this in mind, Kitimat has been a          nized as a pedestrian friendly mall rather than
well‑planned town with a high quality family and       a car-oriented main street, with all areas con-
community life since 1953.                             nected through walkways. Service, storage, and
                                                       supply businesses, as well as industrial repair
Alcan hired the first town planners and invested       shops and auto sales, are located on the west
heavily in the initial planning which is based on      side of the river in the light industrial area called
the Garden City concept. The result is that Kiti-      Service Centre.
mat is a highly walkable, desirable place to live
with individual residential neighbourhoods laid        From the outset, the entire vision and design for
out as super blocks. The homes are accessed by         Kitimat anticipated and encouraged industrial
short local streets and many of them face green        development. A pulp and paper mill was expected
spaces containing a system of pedestrian walk-         to be an early industrial tenant, but it was not
ways over 45 km long. Augmenting the tranquil,         until 1969 that the Eurocan facility was built.
community feel of these neighbourhoods is the          Eurocan ceased operations in 2010. Methanex, a
fact that through traffic is routed around the         methanol and ammonia plant, also operated in
periphery of each neighbourhood. This both             Kitimat until early 2006. Now a new wave of
increases pedestrian safety and reduces noise          development is underway with the October 2018
levels on interior streets. These lovely residential   announcement of a $40 billion investment by
blocks are complemented by a downtown cen-             Royal Dutch Shell PLC and its Asian partners
tre, service centre, and industrial area with most     for a new liquefied natural gas (LNG) export

                                                                                                               4
terminal to be built in Kitimat. Complementing       1952. The closure of Eurocan and Methanex also
this investment, a new gas pipeline is being         affected Kitimat’s workforce and population. The
planned to connect the LNG port to the Montney       constant has been industrial activity and clearly
natural gas formation in northeast BC.               more industrial growth is in Kitimat’s future.

The original town planners projected Kitimat’s       Another factor is the failure to account for the
population would reach 35,000 to 50,000,             symbiotic relationship between Kitimat and
closely paralleling industrial development and       Terrace. The regional population has approached
levelling off after each expansion project or new    30,000 in the past but this was divided amongst
industry was established. The factors which          Kitimat, Terrace, and the surrounding outlying
generated such optimism are still here today: flat   settlements.
land suitable for industrial development, signif-
icant sand and gravel resources, secure hydro-       Kitimat’s population peaked at approximately
electric power supply and a deep water harbour.      13,000 during the late 1970s and early 1980’s.
                                                     With the October 2018 announcement of the
Overall, growth in Kitimat has been lower than       LNG Canada export facility and with construc-
expected mostly because of changing technol-         tion projects underway, population growth is
ogies and the global economy. The Rio Tinto          expected.
(formerly Alcan) aluminium smelter employs
less than one third of the workforce predicted in    As of May 2016, Kitimat’s labour force is estimated
                                                     at 4,230 people.

                                                                                                           5
CLIMATE
Climate was carefully considered when development of Kitimat took place. Streets were designed
to give most homes southwest exposure, maximizing both sunlight and protection from winter winds
and snow. Emissions from the industrial area are naturally carried away from residential areas, south
down Kitimat Arm or north along the western side of the valley.

Kitimat’s climate compares favourably to that of neighbouring coastal and interior communities:

                                                     KITIMAT                      KITIMAT                       TERRACE                   PRINCE RUPERT
                                                  TOWNSITE 2017*               TOWNSITE LTA**                 AIRPORT LTA**                AIRPORT LTA**

  RAINFALL (MM)                                           1597                         1886.1                       1025.3                       2530.4

  SNOW (CM)                                                557                         324.6                         331.5                        92.4

  TOTAL PRECIPITATION (MM)                                2154                        2210.7                        1340.8                       2619.1

  SUNSHINE PRESENCE (HRS)                                  N/A                        1449.9                        1486.5                       1242.1

  SUNSHINE PRESENCE (DAYS)                                 N/A                         238.2                        266.9                         251.5

  WARMEST DAY (°C)                                   35 (AUG. 5)                         37                          37.3                          31.1

  COOLEST DAY (°C)                                   -19 (JAN. 13)                      -25                          -26.7                        -24.4

  DAILY AVERAGE TEMP. (°C)                                 7.7                           7.4                          6.6                          7.5

LTA = Long Term Average
*2017 data, “Kitimat Townsite” taken from Environment Canada Monthly Data Report for 2017
**1981-2010 Environment Canada Long Term Average calculated using weather records for 1981-2010. Kitimat LTA Data is from Fire Hall Weather Station (“Kitimat Townsite”).
Source: Climate Data Services, Environment Canada

                                                                                                                                                                            6
Kitimat’s annual snowfall may seem exceptional but the District of Kitimat’s Public Works Department
keeps main roads clear of snow and clears residential streets on a daily basis. Pedestrian walkways
and sidewalks are also cleared frequently. Winter rainfall helps keep roads bare and reduces snowfall
accumulation on the ground.

Average daily temperature in degrees Celsius by month (2017 data) is as follows:

  WINTER MONTHS*                              SPRING MONTHS*                            SUMMER MONTHS*                               FALL MONTHS*

             2017**      LTA***                         2017**      LTA***                        2017**      LTA***                        2017**      LTA***

  DEC         -0.6°       -0.8°              MAR         -0.1°       3.2°               JUN        13.4°      14.5°              SEP         13.5°       12.6°

  JAN         -2.7°       -1.7°              APR          7.7°        7.1°              JUL        15.6°      16.7°              OCT          6.2°        7.2°

  FEB          1.6°       0.3°               MAY         11.5°       11.0°              AUG        16.9°      16.5°              NOV         0.0°         1.8°

** 2017 data, “Kitimat Townsite”, Taken from Environment Canada Daily Data Report for 2017.
***Environment Canada Long Term Average calculated using weather records from 1971-2000. Kitimat LTA data is from Fire Hall Weather Station (“Kitimat Townsite”)
Source: Climate Data Services Environment Canada

                                                                                                                                                                   7
02
DEMOGRAPHICS
The following human resource and demographic         forbidden to copy data or re-disseminate data,
sections have been compiled using statistical        in an original or modified form, for commercial
data, primarily from Statistics Canada, from Cen-    purposes, without permission from Statistics
sus years 2011 and 2016. Both Census years have      Canada. Information on the availability of the
been used where comparisons are appropriate.         wide range of data from Statistics Canada can
Please note that the 2011 National Household         be obtained from Statistics Canada’s Regional
Survey was voluntary, whereas the 2016 Census        Offices, its World Wide Web site at www.statcan.ca,
was compulsory. Thus, caution should be exercised    and its toll-free access number:
in making comparisons between 2011 and 2016.         1-800-263-1136.

It should be noted that many of the Census           Additional data has been retrieved from BC
statistics are based on 25% sample data, and         Stats (the central statistical agency of the Prov-
inferences are made by Statistics Canada for the     ince of British Columbia) and from the District of
population of Kitimat. As a result, the total pop-   Kitimat publication “Housing Facts.” This Dis-
ulation given in many charts may differ from the     trict publication is available to the public during
2016 Census population estimate of 8,131.            regular office hours or can be found under “Our
                                                     Community/Community Profile” at
Statistics Canada information is used with           www.kitimat.ca
the permission of Statistics Canada. Users are

                                                                                                           8
POPULATION Ethnic Origin of Kitimat Residents: 2016 and 2011
Kitimat’s 2011 population was estimated at 8,335. 2016 CENSUS 2016 CENSUS
ETHNIC ORIGIN (SINGLE) (MULTIPLE) 2011 NHS
According to the 2016 Census conducted by
CANADIAN 860 1,395 2,780
Statistics Canada, Kitimat’s population was 8,131 PORTUGUESE 790 465 1,440
(excluding residents of Kitamaat Village). These ENGLISH 375 1,700 1,745
GERMAN 300 1,050 1,165
figures represent a 2.4% decrease in population
FIRST NATIONS 255 555 675
between the two Census years. In 2017, Kitimat SCOTTISH 145 1,435 1,380
IRISH 130 1,085 920
had an estimated population of 8,507 according
EAST INDIAN 110 40 125
to BC Stats. FRENCH 75 785 760
ITALIAN 70 255 340
FILIPINO 50 35 145
ETHNIC ORIGIN UKRAINIAN 45 395 330
DUTCH 45 280 285
In the 2016 Census, a total of 8,050 Kitimat FINNISH 40 50 90
POLISH 35 220 245
residents declared their ethnic origin. Of those,
NORWEGIAN 30 220 170
3,815 (47%) declared their ethnic background as MÉTIS 30 155 155
single origin while 4,235 (53%) declared multiple WELSH 25 195 240
CHINESE 25 55 90
origin backgrounds. The 2011 National Household
MEXICAN 25 55 40
Survey (NHS) does not provide a breakdown JAPANESE 20 70 100
BELGIAN 15 50 35
of single and multiple responses. As a result,
HUNGARIAN 15 50 80
the sum of ethnic groups in the table to the right SWEDISH 10 200 115
is greater than the total population since some RUSSIAN 10 125 120
DANISH 10 100 150
persons reported more than one ethnic origin in
AUSTRIAN 10 75 85
the Census and NHS. SWISS 10 65 35
SPANISH 0 90 25
Source: Statistics Canada - 2016 Census. Catalogue Number 98-400-X2016354.
AMERICAN (USA) 0 85 165
Statistics Canada; 2011 National Household Survey. Catalogue no. 99-004-XWE
9Citizenship Place of Birth of Kitimat Residents: 2016 and 2011
YEAR CANADIAN NON-CANADIAN ETHNIC ORIGIN 2016 2011 CHANGE
2011 7,810 (94%) 530 (6%) PORTUGAL 435 565
2016 7,715 (96%) 335 (4%) UNITED KINGDOM 200 175
GERMANY 130 120
Source: Statistics Canada - 2016 Census.
Statistics Canada, 2011 National Household Survey. INDIA 80 60
PHILIPPINES 70 110
Place Of Birth
UNITED STATES 45 85
NON- NON- PERMANENT
YEAR IMMIGRANTS IMMIGRANTS RESIDENTS ITALY 45 80
FINLAND 35 N/A N/A
2011 6,700 (80%) 1,575 (19%) 65 (1%)
CARIBBEAN AND BERMUDA 30 N/A N/A
2016 6,550 (81%) 1,415 (18%) 70 (1%)
POLAND 25 30
PAKISTAN 25 0
PLACE OF BIRTH, NON-IMMIGRANTS
NETHERLANDS 20 50
BRITISH COLUMBIA 4,820 (72%)
SOUTH AFRICA 20 25
ELSEWHERE IN CANADA 1,875 (28%)
SOUTH KOREA 20 0
Source: Statistics Canada - 2016 Census. JAMAICA 15 0
PERU 15 0
UNITED ARAB EMIRATES 15 N/A N/A
AUSTRALIA 10 0
MEXICO 10 0
HAITI 10 0
Source: Statistics Canada - 2016 Census. Catalogue Number 98-400-X2016354.
Statistics Canada; 2011 National Household Survey. Catalogue no. 99-004-XWE
10MOTHER TONGUE Mother Tongue, Non-Official Languages
Mother tongue is defined as language first ETHNIC ORIGIN SINGLE RESPONSES
learned and still understood. If two or more PORTUGUESE 550
languages were learned at the same time, mother GERMAN 170
ITALIAN 70
tongue is the language spoken most often at
SPANISH 60
home. Multiple languages are reported only if FILIPINO 55
PUNJABI 50
two or more languages are used equally often.
FINNISH 40
DUTCH 30
CHINESE (NON-SPECIFIC) 30
POLISH 25
Mother Tongue, Official Languages
ABORIGINAL 20
RUSSIAN 15
GREEK 15
ENGLISH 6,495 (78%) HINDI 15
FRENCH 235 ( 3%) ARABIC 10
CZECH 10
NON-OFFICIAL LANGUAGE 1,475 (18%)
UKRAINIAN 10
MORE THAN ONE LANGUAGE 95 (1%) AFRIKAANS 10
OTHER 150
Source: Statistics Canada - 2016 Census.
Source: Statistics Canada - 2016 Census. Catalogue Number 98-400-X2016354.
The breakdown of non-official language mother
tongues by single responses is shown at right.
11MOBILITY STATUS
The concept of mobility focuses on the movement of residents from one place to another: individuals who
have either not moved (non-movers) or have moved (movers) from one residence to another in the
previous year or since the previous Census. Movers are classified as either non-migrants or migrants.
Non-migrants are individuals who have moved to a new address in the same city, town, township,
village, or reserve. Migrants are individuals who have moved to a different city, town, township,
village, or reserve.
One and five year mobility statistics for Kitimat, as reported by Statistics Canada, are listed below.
These numbers indicate Kitimat residents are a relatively stable population. By comparison, 15.6%
of British Columbia residents moved between May 2015 and 2016 (vs. Kitimat’s 14.7%), and 42.6%
moved between May 2011 and 2016 (vs. Kitimat’s 36.2%).
2016 Mobility Status (May 2015 - May 2016)
NUMBER PERCENTAGE
POPULATION 7,695 -
NON-MOVERS (OCCUPY SAME DWELLING IN KITIMAT) 6,795 85.3
MOVERS (OCCUPY DIFFERENT DWELLING IN KITIMAT) 640 8
MIGRANTS FROM WITHIN BRITISH COLUMBIA 320 4.1
MIGRANTS FROM WITHIN CANADA 170 2.1
MIGRANTS FROM OUTSIDE CANADA 45 0.6
Source : Statistics Canada - 2016 Census. Catalogue Number 98-400-X2016354.
Five Year Mobility Status (May 2011 - May 2016)
NUMBER PERCENTAGE
POPULATION 7,520 -
NON-MOVERS (OCCUPY SAME DWELLING IN KITIMAT) 4,800 63.8
MOVERS (OCCUPY DIFFERENT DWELLING IN KITIMAT) 1,300 17.3
MIGRANTS FROM WITHIN BRITISH COLUMBIA 775 10.3
MIGRANTS FROM WITHIN CANADA 480 6.4
MIGRANTS FROM OUTSIDE CANADA 165 2.2
Source : Statistics Canada - 2016 Census. Catalogue Number 98-400-X2016354.
12IMMIGRANT POPULATION Age Demographics of Kitimat Residents: 2016
Immigration is defined in Canada as the movement NUMBER PERCENT
AGE GROUP OF PERSONS OF POPULATION
of individuals from one country to another for 0-4 450 5.5
the purpose of settlement. Most immigrants to 5-9 450 5.5
Canada are considered “landed” as they are 10-14 430 5.3
permitted to live in Canada permanently. Some 15-19 475 5.8
landed immigrants have resided in Canada for a 20-24 450 5.5
number of years, while others are recent arrivals. 25-34 1045 12.9
35-44 965 11.9
45-54 1260 15.5
As of 2016, approximately 1,420 Kitimat resi-
55-64 1310 16.1
dents (17.6% of total population) were immi-
65-74 770 9.5
grants. Of these, 60 residents (4% of immi-
75-84 410 5
grants) migrated between 2011 and 2016, 100
85+ 110 1.4
residents (7%) migrated between 2006 and
Source: Statistics Canada - 2016 Census. Catalogue Numbers 98-400-X2016354,
2010, and 1,255 (88%) migrated before 2006. 98-316-X2016001.
AGE DISTRIBUTION
The breakdown of Kitimat’s 2016 Census population (8,131) into respective age categories and a com-
parison against BC and Canada are displayed below. “Baby-boomers” represent the greatest propor-
tion of Kitimat residents. The median age of the local population was 43 years in 2016, down from 44
the previous Census. While there were decreases in the population of persons aged 54 and below,
there were increases for those aged 55 and above.
POPULATION BY AGE - 2016 CENSUS
15
PERCENTAGE OF POPULATION
BC
CANADA
KITIMAT
10
5
0
-4
9
4
9
4
4
44
4
4
4
84
+
-7
85
5-
-1
-2
-1
-3
-5
-6
0
-
-
15
10
65
20
25
45
75
55
35
AGE DEMOGRAPHIC
13EDUCATION
6,730 Kitimat residents (aged 15 and above) declared their personal level of education to Statistics Canada in
2016. The breakdown by highest level of educational attainment is displayed below. In 2016 the greatest
proportion of Kitimat residents (aged 15 and above) declared they had a high school education (32%).
3,200 Kitimat residents aged 15 and above declared some form of post-secondary education in the
2016 Census. A breakdown by field of study is displayed below. The unusually high proportion of
“Architecture, Engineering and Related’ is attributed to the heavy industry economy in Kitimat.
Highest Degree Obtained
KITIMAT BC
HIGH SCHOOL DIPLOMA OR EQUIVALENT 32.00% 29.40%
NO CERTIFICATE, DIPLOMA OR DEGREE 20.40% 15.50%
APPRENTICESHIP OR TRADES CERTIFICATION 14.60% 8.80%
COLLEGE/NON-UNIVERSITY CERTIFICATE OR DIPLOMA 19.70% 18.10%
UNIVERSITY CERTIFICATE, DIPLOMA OR DEGREE 10.50% 24.80%
Field of Study
KITIMAT BC
ARCHITECTURE, ENGINEERING AND RELATED 36.70% 24.60%
BUSINESS, MANAGEMENT AND PUBLIC ADMINISTRATION 14.40% 24.50%
PERSONAL, PROTECTIVE AND TRANSPORTATION SERVICES 10.60% 7.10%
HEALTH AND RELATED FIELDS 9.80% 18.50%
EDUCATION 5.40% 8.30%
SOCIAL AND BEHAVIOURAL SCIENCES AND LAW 4.80% 14.10%
PHYSICAL AND LIFE SCIENCES AND TECHNOLOGIES 2.70% 5.00%
HUMANITIES 2.40% 7.20%
AGRICULTURE, NATURAL RESOURCES AND CONSERVATION 1.80% 2.90%
VISUAL AND PERFORMING ARTS/COMMUNICATIONS 1.40% 5.70%
MATH, COMPUTER AND INFORMATION SCIENCES 0.80% 4.60%
OTHER FIELDS OF STUDY 0% 0.02%
Source: Statistics Canada - 2016 Census. Catalogue Number 98-400-X2016354.
14KITIMAT VALLEY INSTITUTE Significant expansions are proposed for the
facility. As of January 1, 2019, the facility offers
Kitimat Valley Institute (KVI) is the only post-
eight rooms, a computer lab, two trades training
secondary institute in Kitimat. The Institute is
centres and private parking. It can also accom-
committed to providing efficient training oppor-
modate meetings, conferences, and workshops
tunities that meet academic, industry and insti-
up to 100 people.
tutional training needs. The institute provides
a variety of course offerings including Camp
Kitimat Valley Institute works with educational
Attendant, Class I Drivers License, Cleaning and
partners such as University of Northern British
Demolition, Construction Safety Officer, Entry
Columbia, Coast Mountain College, Hecate Strait
Level Construction, Enhanced Security, Industry
Employment Development Society, Nicola Valley
and Trade Access, Oil & Gas Safety and Occupa-
Institute of Technology, and British Columbia
tional First Aid. Other services provided by KVI
Institute of Technology.
include training in cultural awareness, proctoring
service, and recruitment of qualified employees.
15HOUSING The price range of listed dwellings
(as of January 2019) is reported below:
Kitimat’s rental housing market has changed sig-
nificantly over the years. Vacancy rates climbed Rental Units in Kitimat: January 2019
from 0 percent (during the 1981 methanol facility
construction boom) to 20.8 percent over the RENTAL UNITS NUMBER PERCENTAGE
APARTMENTS 733 57.30%
duration of one year. Single digit vacancy rates
LEGAL SUITES 96 7.50%
were experienced during most of the 90’s, but SOCIAL HOUSING 71 5.50%
rose sharply in 1998 (23.2%), 2000 (37.4%), and OTHER* 380 29.70%
TOTAL 1280 100%
2005 (44.5%). Vacancy rates fell steadily in the
*Includes off-market rental units or buildings with 9 units or less
00’s to a low of 1.0% in Fall of 2013. This was due Source: Housing Facts 2019, District of Kitimat
to an influx of new residents associated with the
smelter modernization project. Average Monthly Rent by Apartment Type
in Kitimat: December 2018
Since completion of the smelter modernization, AVERAGE
APARTMENT TYPE MONTHLY RENT
vacancy rates steadily climbed in 2015 (25.5%)
BACHELOR N/A
and 2016 (36.6%). As vacancy rates increased, 1 BEDROOM $1,234
average rents declined from $1,142 in 2015 to 2 BEDROOM APARTMENT $1,299
2 BEDROOM TOWNHOUSE $997
$930 in Fall 2016.
3+ BEDROOM APARTMENT $2,021
3+ BEDROOM TOWNHOUSE $1,428
Housing Facts 2019 reports a total of 4,674 Source: Housing Facts 2019, District of Kitimat
housing units within the District of Kitimat. Ap-
proximately three quarters (73%) were reported Price Range of Listed Dwellings
owned/occupied with the remainder (25%) being in Kitimat: December 2018
rental properties. The breakdown of reported
APARTMENT TYPE PRICE RANGE
rental units and prices is displayed on the right.
RESIDENTIAL BUILDING LOT $169,000 - $349,000
MULTI-FAMILY/ATTACHED/MANUFACTURED $76,000 - $399,990
SINGLE FAMILY DWELLING $215,00 - $1.49M
As is the case with rental units, private residential
MULTI-FAMILY LOT $4.25M - $6.38M
units are affordable and readily available in Kitimat.
Source: Housing Facts 2019, District of Kitimat
16LABOUR FORCE ACTIVITY
In 2016, 4,230 Kitimat residents declared themselves to Statistics Canada as “in the labour force”.
By definition, labour force participants are those 15 years and over who are currently working or
actively looking for work. 3,695 of 4,230 labour force participants (87.4%) reported being employed
while 530 (12.5%) reported being unemployed (looking for work).
Of the 4,230 labour force participants in Kitimat, 2,420 (57.2%) were male and 1,810 (42.8%) female.
2,130 (88.0%) of the males were reported employed and 295 (12.0%) unemployed. 1,570 (86.7%) of
the females were reported employed and 245 (13.5%) unemployed. The labour force participation
rate was 62.9% in 2016, up slightly from 61.3% in 2010. The breakdown of total labour force partici-
pants into respective industry divisions below reflects Kitimat’s status as a manufacturing centre.
Source: Statistics Canada - 2016 Census. Catalogue Number 98-400-X2016354; Statistics Canada; 2011 National Household Survey. Catalogue no. 99-004-XWE
Area of Employment in Kitimat vs. BC: 2016
FIELD OF STUDY KITIMAT BC
MANUFACTURING 20.20% 6.50%
CONSTRUCTION 16.90% 8.20%
RETAIL TRADE 8.90% 11.70%
HEALTH CARE AND SOCIAL ASSISTANCE 8.00% 11.20%
ACCOMMODATION AND FOOD SERVICES 7.30% 8.50%
PUBLIC ADMINISTRATION 5.90% 5.10%
EDUCATIONAL SERVICES 5.40% 7.20%
WASTE MANAGEMENT AND REMEDIATION 5.10% 4.50%
PROFESSIONAL, SCIENTIFIC AND TECHNICAL SERVICES 4.00% 8.10%
TRANSPORTATION AND WAREHOUSING 3.60% 5.30%
MINING, QUARRYING, AND OIL/GAS EXTRACTION 3.50% 1.10%
OTHER SERVICES (EXCEPT PUBLIC ADMINISTRATION) 3.30% 4.60%
WHOLESALE TRADE 1.90% 3.40%
ARTS, ENTERTAINMENT AND RECREATION 1.40% 2.40%
FINANCE AND INSURANCE 1.20% 3.90%
INFORMATION AND CULTURAL INDUSTRIES 1.10% 2.80%
REAL ESTATE AND RENTAL AND LEASING 1.10% 2.30%
UTILITIES 0.60% 0.50%
AGRICULTURE, FORESTRY, FISHING AND HUNTING 0.50% 2.70%
Source: Statistics Canada - 2016 Census. Catalogue Number 98-400-X2016354.
17INCOME
In 2015, of the 6,725 residents (over the age of 15) in Kitimat, 6,490 (96.5%) residents declared some form
of income to Statistics Canada. The breakdown of after-tax income for those residents with income by
average and median income per male/female is listed below. Average and median incomes for British
Columbia and Canada by male/female are also included for comparison.
In 2016, 3,500 private households in Kitimat declared after-tax income to Statistics Canada. Like
individual incomes, household incomes in Kitimat are higher, on average, than both British Columbia
and Canada. Specifically, in 2015 the median after-tax income of households in Kitimat was $73,635
whereas in British Columbia it was $61,280 and in Canada it was $61,348.
The 2016 Census used two measures to classify persons by low income status: the low-income measure,
after tax (LIM-AT) and the low-income cut-offs, after tax (LICO-AT). The LIM-AT considers a household
low-income if their adjusted income is less than half the Canadian median adjusted income. Based on
the LIM-AT 8.3% of the population of Kitimat was considered low-income, below the rate of 15.5% in Brit-
ish Columbia, and 14.2% in Canada in 2015. Households are defined as low income by the LICO-AT if they
are expected to spend 20 percentage points or more than the average of their after-tax income on food,
shelter and clothing. The percentage of the population that is low-income according to the LICO-AT is
3.9% for Kitimat, 11.0% for BC, and 9.2% for Canada in 2015.
Female Average and Median Income: 2016 Male Average and Median Income: 2016
FEMALES KITIMAT BC CANADA MALES KITIMAT BC CANADA
AVERAGE INCOME $32,314 $31,874 $32,828 AVERAGE INCOME $59,454 $44,282 $45,404
MEDIAN INCOME $27,541 $25,659 $26,621 MEDIAN INCOME $53,792 $35,383 $35,933
Source: Statistics Canada - 2016 Census. Catalogue Numbers 98-400-X2016354, 98-316-X2016001.
2016 Average Annual Income FEMALE MALE
60000
40000
20000
0
KITIMAT BC COMMUNITY CANADA
1803
ECONOMIC
SECTORS
19RIO TINTO BC WORKS
In recent years, Kitimat’s economy has primarily tive, energy efficient and environmentally friendly
been driven by the Rio Tinto Alcan (RTA) alu- available, allowing the modernized plant to re-
minium smelter modernization project, which duce greenhouse gas emissions by approximate-
is now called Rio Tinto BC Works. The compa- ly 50 per cent. All this is powered by renewable
ny’s modernization of BC Works was complet- hydroelectricity from the nearby Kemano hy-
ed in 2016, and the first year of full production droelectric facility, itself undergoing an upgrade
took place in 2017. The modernization project from 2018-2020.
increased production capacity of the smelter
by 50 percent to 460,000 tonnes while still The BC Works modernization cost approximately
maintaining one of the lowest carbon footprint CAD$6.4 billion. Following modernization, it is
aluminiums ever produced. Rio Tinto’s proprietary estimated that Rio Tinto employs 1,000 people
AP40 smelting technology is the most cost effec- directly, and 200 people indirectly.
20TOURISM
The Kitimat River, which boasts world-class sport days in 2013 to 1,422 days in 2016. This growth is
fishing, is a major draw to the region. As a result due primarily to increasing interest in the spring
of its abundant salmon and steelhead there are steelhead and chinook fisheries.
significant numbers of guided and unguided
anglers on the Kitimat River from March right Guided angling on the Kitimat River has significant
through to October. In 2016, the guided angler economic impacts in the local area. In terms of
days on the Kitimat River alone represented direct angler expenditures, almost $2 million was
almost a fifth (19%) of all guided angler days in spent on guided angling on the Kitimat in 2016;
the Lower Skeena region. For such a small system, in terms of GDP, over $1 million was generated,
the economic importance of guided angling on supporting or creating 36 jobs.
the Kitimat River is hard to overstate. Between
2013 and 2016, guided angling on the Kitimat
River, and the associated economic benefits
have more than doubled, going from only 692
21Guided angling activity on Kitimat River, by month, 2013–2016
Source: Ministry of Forests, Lands, Natural Resource Operations and Rural Development, Smithers, BC (2013–2015) and Big River Analytics estimates (2016)
SPRING STEELHEAD CHINOOK SUMMER SALMON
400
300
GUIDED ANGLER DAYS
200
100
0
JAN FEB MAR APR MAY JUN JUL AUG SEP OCT NOV DEC
YEAR: 2013 2014 2015 2016
In addition to freshwater sportfishing, the Douglas Channel hosts guided and unguided saltwater
anglers year-round. Some of the best prawning, crabbing, and salmon fishing are just minutes from
the boat launch at MK Bay Marina, a full service, community based marina located at the head of the
Douglas Channel on Haisla traditional territory.
Beyond sportfishing, Kitimat attracts snowmobilers who enjoy the country’s largest annual snowfalls,
and visitors interested in the many parks and recreational facilities including Hirsch Creek Golf and
Winter Club.
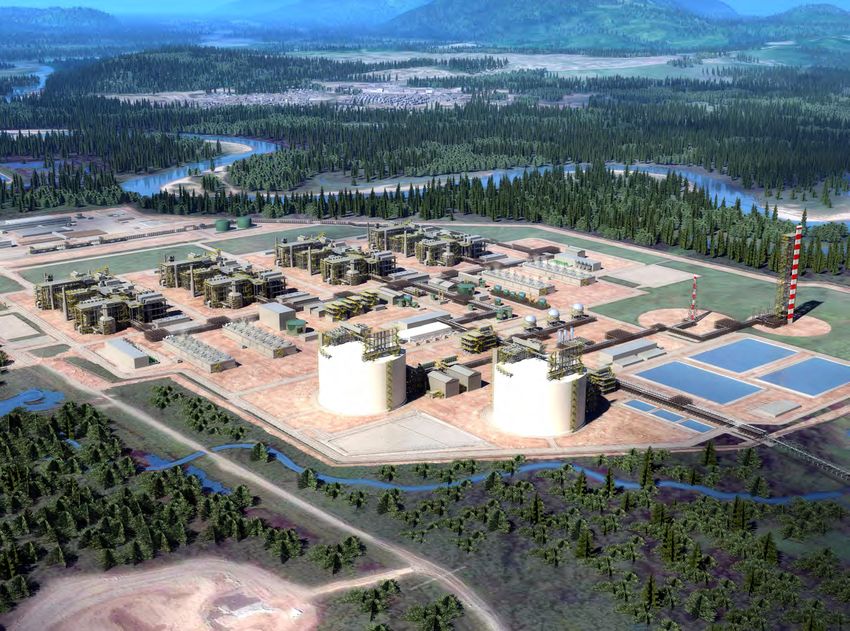
22On October 1st 2018, with the support of First Nations, the Kitimat community and all levels of goverment,
LNG Canada, a joint venture of Shell, PETRONAS, PetroChina, Mitsubishi Corporation, and KOGAS,
announced their positive final investment decision for the Kitimat-based LNG Canada liquified natural
gas export facility. LNG Canada represents the single largest private investment in Canada’s history.
The construction timeline for the first phase of the project will be approximately 5 years. It will take
approximately 18 months from the FID announcement to ramp up to peak construction which will require
between 4,500 and 7,500 workers. Following construction, 300 to 450 people will be employed
during operations. Should the second phase of the project go ahead, operations will require between
450 to 800 people.
23You can also read