2021 PHILADELPHIA STATE OF CENTER CITY - Center City District
←
→
Page content transcription
If your browser does not render page correctly, please read the page content below

STATE OF CENTER CITY
   PHILADELPHIA

  2021
Restoring | Returning | Reanimating
Contents
Introduction                                                           1

Office                                                                12

Health Care & Higher Education                                        18

Conventions, Tourism & Hotels                                         23

Arts & Culture                                                        27

Retail                                                                30

Employment                                                            37

Transportation & Access                                               47

Downtown Living                                                       53

Developments                                                          62

Acknowledgements                                                      64

Center City District & Central Philadelphia Development Corporation        CENTERCITYPHILA.ORG
|1
Chapter Name
Dilworth Park | Center City District
Reanimating the
Center of the City
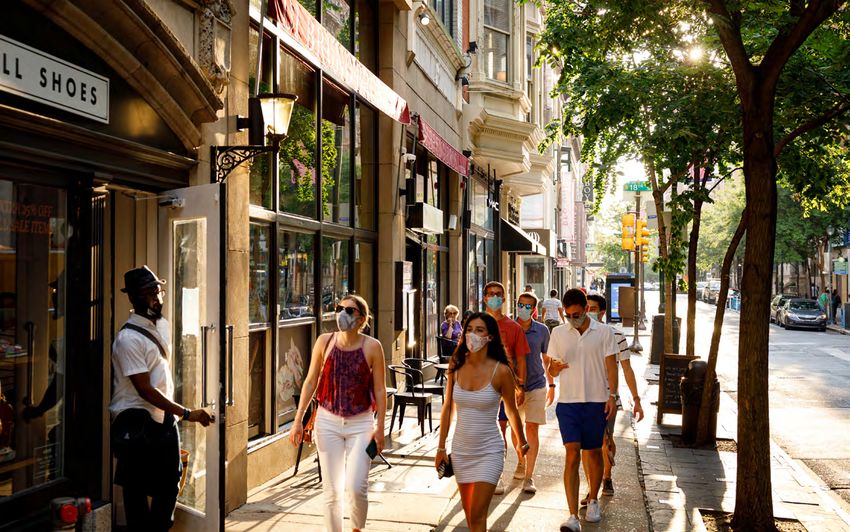
The global pandemic, local stay-at-home mandates and civil boarded-up storefronts and installed new artwork on many. We
unrest created extraordinary challenges for all cities. In Center commissioned 200 decorative banners created by Philadelphia
City, pedestrian volumes initially plummeted by 72%, as office artists. Our landscape teams planted street trees, filled park
workers, hotel guests, regional shoppers, students, theater and flowerbeds with tens of thousands of bulbs and upgraded street
restaurant patrons disappeared. At night, streets were devoid of lighting. We continued to provide fee-for-service cleaning for five
cars, sidewalks were empty. From the very start in March 2020, adjacent residential neighborhoods.
we had all of our on-street and park employees designated
To enhance safety, we deployed new bike patrols and security
“essential workers.” The central lesson from the Center City
vans in afternoons and seven evenings per week, supplement-
District’s founding 30 years ago suddenly had renewed reso-
ing the role of our Community Service Representatives (CSRs).
nance: the revival of economic activity and vitality depends upon
In 2020, CSRs had more than 177,000 sustained conversations
confidence in a public environment that is clean, safe
with pedestrians seeking directions, responding to inquiries
and attractive.
from businesses or addressing safety or streetscape problems.
We staggered shifts to preserve social distance in locker rooms, In 2019 and 2020, our homeless outreach teams, working in
provided crews with safety equipment and, until retailers start- partnership with Project Home and the Philadelphia Police
ed to reopen in June 2020, paid for and delivered lunch to all service detail, persuaded more than 300 individuals to come off
on-street crews. Our dedicated employees, drawn from neigh- the street to connect with services and shelter. While daytime
borhoods across the city, never stopped working, continuing to homelessness and panhandling on Center City sidewalks had
serve as a visible, reassuring presence, responding to every new, been steadily rising since 2015, both declined in 2020, with op-
unexpected challenge that came their way. portunistic panhandling dropping dramatically. Still, the absence
of other people made the presence of those in need more visible
CCD cleaners power-washed sidewalks and removed graf-
and reduced the beneficial effect of many “eyes on the street.”
fiti from building facades and street furniture. They painted
Center City District & Central Philadelphia Development Corporation CENTERCITYPHILA.ORG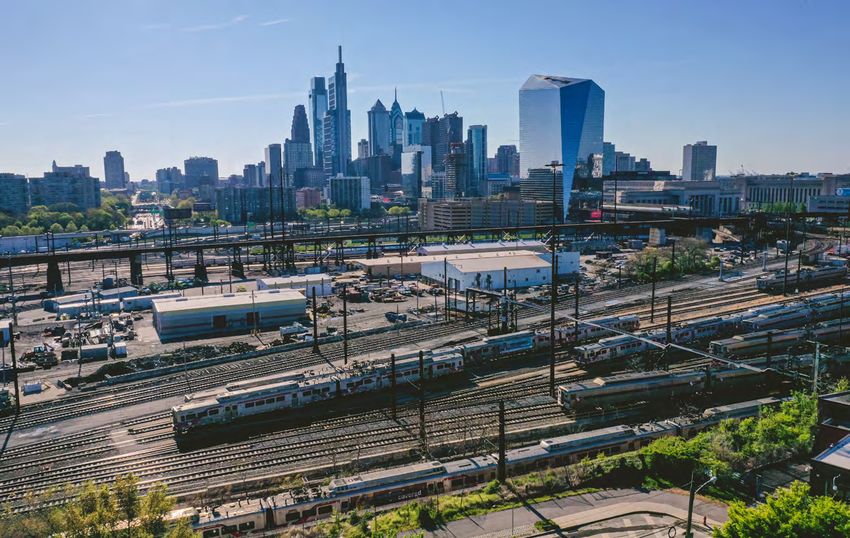
2 | State of Center City

                                                                          Matt Stanley                                                    Matt Stanley

                                                                                                                                   BeauMonde Originals

 Staying mindful of established health guidelines, CCD promoted     A successful Restaurant Week in September promoted outdoor
Center City’s sidewalk level businesses that remained open, en-     dining, takeout options and observance of all safety protocols.
couraging takeout from restaurants, reminding residents across      In January 2021, we launched a #TakeoutPhilly ad campaign to
the region through traditional advertising, email newsletters and   sustain restaurants, especially those unable to invest in heated
social media about the unique shops, boutiques and fine dining      outdoor seating, by encouraging residents to order directly from
opportunities downtown.                                             restaurants and tip generously. CCD licensed the campaign at
                                                                    no cost to neighborhood commercial corridors across the city.
                                                                    Staff worked closely with retail associations and City agencies to
         A successful Restaurant Week                               create “streeteries” in restaurant-dense Midtown Village and Rit-
         in September promoted outdoor                              tenhouse Row, closing streets to traffic on extended weekends,
                                                                    enabling restaurants to seat more customers, expanding dining
         dining, takeout options and
                                                                    beyond the sidewalk.
         observance of all safety protocols.

CENTERCITYPHILA.ORG                                                                 Center City District & Central Philadelphia Development Corporation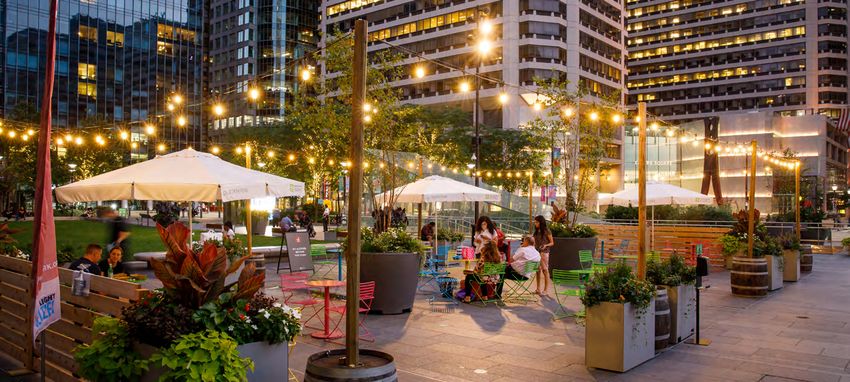
Reanimating the Center of the City |3
785
Building Facades
100
Uniformed Cleaning
Cleaned of Personnel and
Graffiti Tags Supervisors Matt Stanley
Well-managed parks and civic spaces are defining public ame-
nities of downtown. To provide safe spaces for social gathering,
we expedited repairs to Dilworth Park, turned the fountains on by
early summer, frequently cleaned socially distanced seating and
programmed activities that restored vibrancy without attracting
large crowds.
We invited residents to enjoy live entertainment during “Dinner
at Dilworth” with takeout from nearby restaurants. We staged
small-scale seasonal markets featuring local artisans and
hosted performers and a brass quartet from Opera Philadelphia.
Working closely with the City’s Health Department, we reconfig-
ured the Wintergarden on the Greenfield Lawn, reimagined the
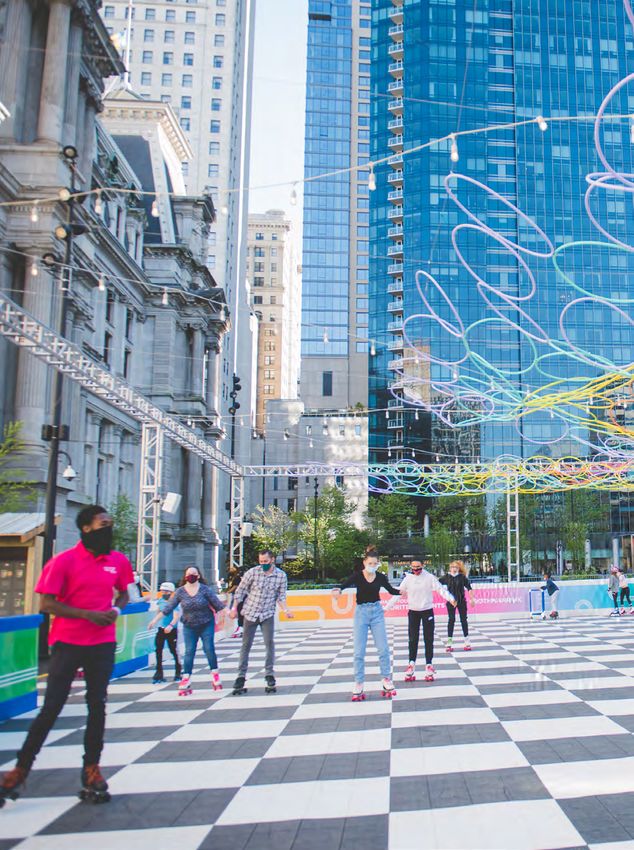
Deck the Hall Holiday Lights display, deployed an open-sided BeauMonde Originals
Rothman Orthopedics Cabin and managed the Rothman
Orthopedics Ice Rink with time limits, reduced capacity and
online-only ticketing. Despite a year of intentionally scaled-back Dilworth Park Annual Visitors
events with crowd limitations, 6 million people visited Dilworth
Park in 2020, about 60% of the volume in 2019.
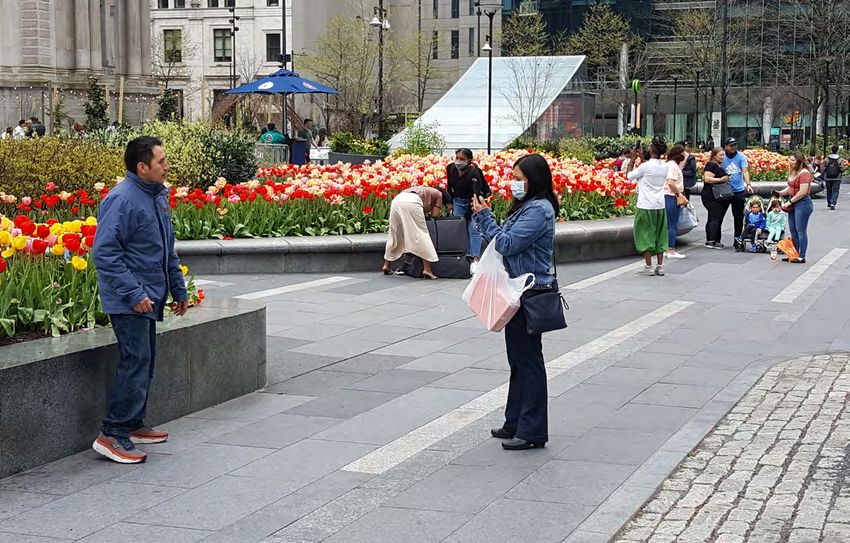
In Sister Cities Park, an expanded Children’s Discovery Garden
reopened in the summer with capacity limits and new elements
that became instant hits with children: a climbing net, a “hid-
ing” nest, a stream dam and push-button water jets. Children’s
programming continued through warmer months, providing
safe outdoor spaces for families. Local artist Janell Wysock was
10,828,000
10,687,000
10,015,000
5,999,000
9,621,000
commissioned to create the fall installation “Color Under the
Canopy,” wrapping the park's trees with colorful panels of fabric.
For the winter, a giant climbing log replaced water in the pond.
Since 1997, CCD has invested $151.3 million in streetscape,
lighting and park improvements. 2016 2017 2018 2019 2020
Source: Center City District
Center City District & Central Philadelphia Development Corporation CENTERCITYPHILA.ORG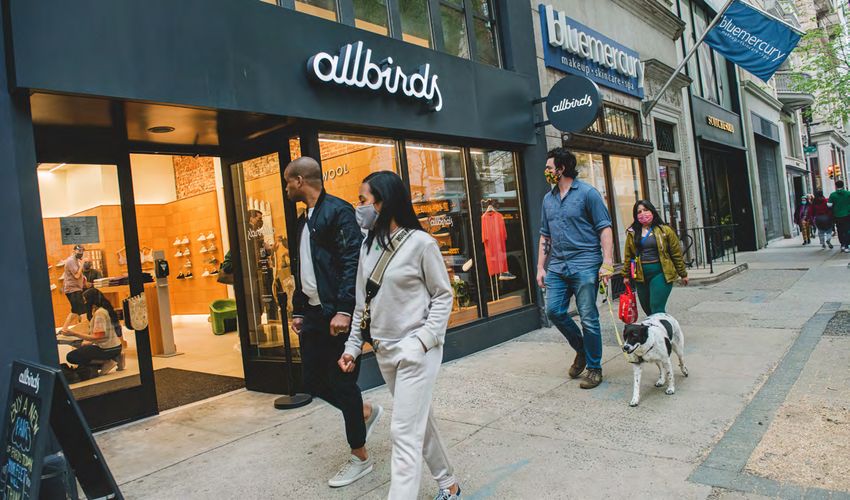
4 | State of Center City

                                                                                                                                              Matt Stanley

Center City District Streetscape Assets, 2020                           Center City District Streetscape Maintenance, 2020

3,740              Light Fixtures
                                                                        STREET LANDSCAPING
                                                                        Trees Planted (Plant Center City)                                             103
Pedestrian Light Poles     2,879    Lighted Parkway
                                                                   12   Trees Pruned                                                                  173
                                    Building Facades                    Trees Replaced                                                                 46
City Hall Lighting -
                               85
10 Locations                        Light Fixtures on 12 Avenue   446   Shrubs, Perennials & Vines Planted                                            225
                                    of the Arts Facades
Light Fixtures Illuminating    64                                       Bulbs Planted                                                               4,200
23 Sculptures                       Light Fixtures Illuminating   254   LIGHTING
                                    6 Underpasses
                                                                        Pedestrian Light Poles Repaired                                                  3

1,453                               1,393
                                                                        Pedestrian Poles Relamped                                                      72
                                                                        Parkway Sculpture Lights Relamped                                                6
Landscaping                         Graphic Displays                    Parkway Façade Lights Replaced                                                   2

Street Trees                  903   Local Artist Banners          199   SIGNS

                                                                  122   Wayfinding Signs Cleaned                                                      110
Planters                      385   CCD Parks Banners
                                                                        Wayfinding Signs Updated                                                       87
Trees in 4 Parks              165   Promotional Banners           943
                                                                        Transit Portal Signs Cleaned                                                   48
                                    Storefront Artwork             55   Parkway Signs Cleaned                                                          13
                                    Printed Posters                69   Bus Shelter Signs Cleaned                                                      36
                                    Digital Screens                 5   CCD PARKS

1,048              Street Furniture                                     Shrubs, Perennials & Grasses Planted
                                                                        Trees Planted
                                                                                                                                                      630
                                                                                                                                                       21
Adjustable Honor               25   Park Bike Racks                32   Trees Pruned                                                                   39
Box Corrals
                                    Park Benches                   31   Bulbs Planted                                                             26,700
Fixed (In-Ground)              15   Streetscape Benches            18
Honor Box Corrals                                                       OTHER
                                    Banner Poles                  157
On-Street Bike Racks           17                                       Graffiti Tags & Stickers Removed                                          36,255
                                    On-Street Bollards            753   (All Street Furniture & Fixtures)

1,268              Signs
Pedestrian Light Poles        442   Lighted Parkway               209
                                    Building Facades
City Hall Lighting -          259
10 Locations                        Light Fixtures on 12 Avenue    65
                                    of the Arts Facades
Light Fixtures Illuminating   240
23 Sculptures                       Light Fixtures Illuminating    53
                                    6 Underpasses

 CENTERCITYTPHILA.ORG
CENTERCITYPHILA.ORG                                                                    Center City District & Central Philadelphia Development Corporation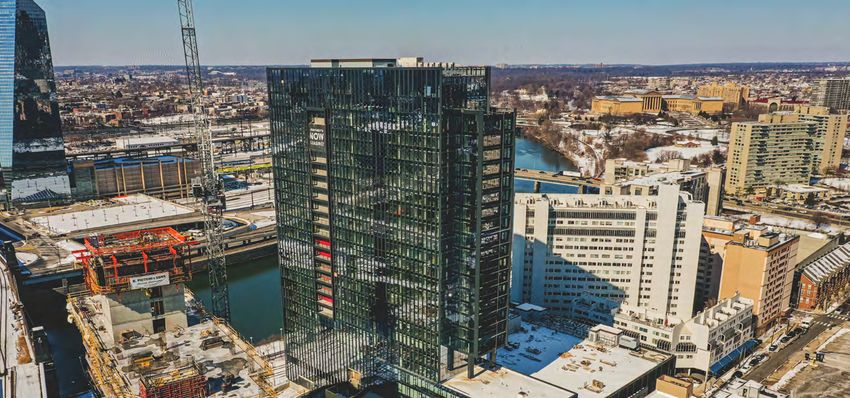
Reanimating the Center of the City               |5

Total CCD Employees by Home ZIP Code                                                        Philadelphia Employment by Area
in Philadelphia

                                                                                        1                                                               Far Northeast
                                                                       1                                                                                      6.7%

                  3               2                                                 2
                                                               5       1
                                      3                                                         Roxborough/              Olney/
          2           1                                                                          Manayunk               Oak Lane            Near Northeast
                                                                   1            1                  1.0%                                           5.9%
                                                  7                                                       Germantown/ 3.8%
                              5                                                                           Chestnut Hill
                                                                       1                                       3.6%
                                                           4                                                                       Bridesburg/
                          1               1                                                                         North          Kensington/
                                                                                                                 Philadelphia       Richmond
                                  5           5                                                    West               6.0%           6.2%
                  2                                   1
                                                                                                Philadelphia
                              6           3
    4                                             4                                               3.0%
                                  1                                                                       University
           4                                                                                              City    Greater
                                                          Number of Employees
                                  3 1         1                                                           11.3% Center City
                                                          by ZIP Code
              4               5                                                                                   42.0%                            11.0%
                                          7                    None
                                                               1-2
          2                                                    3-4                                                                     1.3%
                          9               8                    5-6                                 Southwest        South
                                                               7-9                                Philadelphia   Philadelphia
                                                                                                       1.1%           4.6%
              2                                                                                                                          Source: U.S. Census Bureau, Longitudinal House-
                                                                                                                  Navy Yard              hold Employment Dynamics, 2018.
                                                                                                                   1.2%

                                                                                                 PHL Airport
                                                                                                   3.6%

                          140 (82%) of CCD employees live in the City of Philadelphia; each year CCD
                          contracts provide work opportunities for another 118 Philadelphia residents

Restoring the Economy: Maintaining and animating spaces                                     The absence of more than 115,000 professional, tech, business
was an interim strategy, a holding action, waiting for production                           and financial services workers and thousands of non-essential
and distribution of vaccines to bring the economy back to life.                             health care and education employees, caused ridership on
For those who live or continued to work in Center City, or whose                            SEPTA, parking garage occupancy and pedestrian volumes on
businesses depend on downtown density, our mission has                                      Center City sidewalks to plummet, posing significant challenges
been to focus on clean and safe, enhancing nodes of vitality,                               for restaurants and retail. The loss of tourism and cancellation
countering misinformation with frequent surveys and                                         of conventions and trade shows compounded the challenge for
reports, and rapidly responding to adverse conditions in the                                those sectors dependent on face-to-face interaction. Leisure
public environment.                                                                         and hospitality employment initially dropped by 60% — a loss of
                                                                                            43,300 jobs.
The pandemic initially plunged Center City back to 1990
conditions, exposing weaknesses and limitations in Philadelphia’s                           In effect, the pandemic temporarily unraveled much of the
ongoing revival. The economic shutdown eliminated 120,100 jobs                              work of the last 30 years: the creation of a thriving, mixed-
citywide between March and April 2020, wiping out 16% of payroll                            use downtown whose diverse sectors reinforce each other.
jobs in the city. By February 2021, employment rebounded by                                 Investments in the 1990s and early 2000s, along with more
41,400 jobs, but remained 78,700 below March 2020 levels.                                   competitive tax policy, had created a platform for growth. From
                                                                                            2009 to 2019, Philadelphia enjoyed a remarkable resurgence,
Following telework mandates, about 10% of employees came into                               adding 87,700 jobs citywide, a significant turnaround from four
offices during much of 2020. Working remotely, most continued                               decades prior, when the city lost 267,500 jobs between 1970
to be paid. By contrast, many cleaning, security and other                                  and 2009.
operations personnel in office buildings and on campuses
were furloughed.

Center City District & Central Philadelphia Development Corporation                                                                                          CENTERCITYPHILA.ORG
6 | State of Center City

                                                                    Matt Stanley                                                        Matt Stanley

The decade that followed the Great Recession became the                        Working with restaurants and the
longest sustained period of employment growth in the city since
the 1920s. Approximately half of citywide job gains during that
                                                                               City of Philadelphia, CCD supported
time occurred in Center City and University City, where jobs grew              the expansion of outdoor seating
by 10% and 26%, respectively.                                                  through all four seasons.
Greater Center City is Philadelphia’s largest concentrated em-
ployment center with 42% of all city jobs; Philadelphia residents   options contracted, those with stable retirement or investment
hold 52% of them. Downtown also hosts the highest concentra-        income found home the best place to shelter from the storm.
tion of high paying jobs, including 75% of Philadelphia’s jobs in   While some decamped for second homes at the beach, the
information and finance and 74% of professional and business        mountains or in warmer climates, there is little evidence of
services jobs. Nonetheless, two-thirds of downtown jobs do not      wholesale flight of the middle class from Philadelphia. The
require a bachelor’s degree. SEPTA provides the link that enables   shutdown of foreign immigration in 2020 did reduce the number
25% of working residents of every city neighborhood to connect      of new people moving in, but Philadelphia continued to attract
with opportunity in Center City. The pandemic put these jobs at     more people from Boston, New York and Washington
risk, while causing the 48% of downtown workers who live in the     than those moving the other way. Most chose to live in Greater
suburbs to consider remote work as a long-term option.              Center City.

Downtown Living: In the last two decades, the nine ZIP codes        Expanding the Circle of Growth: Despite success in Center
between Girard Avenue and Tasker Street that comprise Greater       City prior to the pandemic, Philadelphia was growing slowly
Center City became the fastest growing residential area of          compared to other cities, lagging in the addition of both middle-
Philadelphia. Very few downtowns can match the extraordinary        class and high-wage jobs. We lacked dynamic growth in export
range and affordability of diverse neighborhoods, architecture      industries, what economists call “traded” sectors that sell
styles and housing types. Downtown provides proximity to jobs,      outside the region, bringing revenues from across the nation
cultural offerings and thousands of retailers and restaurants.      and around the globe back to Philadelphia. Typically, such firms
Walkable and bikeable neighborhoods have unparalleled               generate demand for even more workers and expand the local
connectivity via transit and automobile to locations throughout     purchase of services. Only five of Philadelphia’s 20 largest
the region and the Northeast Corridor. Between 2000 and 2020,       employers at the start of 2020 were in the for-profit sector and
the population of Greater Center City increased 29% to more         only three were not health care related.
than 190,000, while the city as a whole grew by 5%.                 Among five peer cities on the East Coast, Philadelphia has
While many workplaces were empty, the stay-at-home order            the lowest density of businesses per thousand residents and
intensified use of homes, especially where multiple adults          the lowest number of Black-owned businesses per thousand
worked remotely. Dining rooms, kitchens and spare bedrooms          Black residents. It also has significant lower business density
were commandeered for work, or as places to accommodate or          than surrounding suburbs, since downtown's success was
supervise virtual schooling. As travel, entertainment and dining    not replicated citywide. One consequence is that 43% of the

CENTERCITYPHILA.ORG                                                                Center City District & Central Philadelphia Development Corporation
Reanimating the Center of the City   |7

residents of every Philadelphia neighborhood outside Center City      Center City District

reverse commute to jobs in the suburbs. They work alongside of
suburban residents with better-funded school systems who pay
a 1% wage tax compared to Philadelphia’s 3.8% rate. Despite
population growth downtown, more households are moving
from Philadelphia to the suburbs than are moving the other
way. Philadelphia is still losing working-class and middle-class
households, reinforcing a city increasingly split between wealth
and poverty.

Jump-starting Growth Through Equity Investments and
Tax Policy: The American Rescue Plan (ARP) creates a unique
opportunity for Philadelphia to reposition itself. The temporary
infusion of federal funds can restore cuts, but also free up
resources for permanent and transformational investments that
set the city on a path of more expansive and inclusive growth.

Black- and brown-owned businesses were particularly
harmed by the coronavirus crisis. Many enterprises are sole
proprietorships without access to traditional capital, lacking
banking relationships necessary to receive federal support.
Bolstering minority businesses and commercial corridors
can be a centerpiece of the city’s recovery strategy, leveraging
substantial federal investments and private capital. Building
on existing supplier diversity initiatives can also expand local
purchasing by Philadelphia institutions and businesses,
harnessing unprecedented federal investments in infrastructure
to grow Black- and brown-owned businesses at scale.

Long recommended changes in local tax policy can spur new
growth. The pandemic underscored the risk of relying on volatile
wage and business taxes for 53% of locally generated revenue.
Suburban workers contribute $800 million in wage taxes, 20%
of the City’s local tax revenues. As the pandemic ends, if 10%        BeauMonde Originals

to 20% of suburban residents do not return downtown or to
University City office buildings, health care or educational
institutions, the City will lose between $80 million and $160
million in wage tax revenues. As firms choose to return to their
offices or remain remote, we remain the only large city to tax
both gross and net business income.

Targeted investments in disadvantaged businesses, coupled
with wage and business tax reductions, can jump-start post-
pandemic growth. Growth without equity created a city with huge
disparities. Investments in equity without growth will leave us
a slow growing city with low business density, lacking family
sustaining jobs, limiting opportunities for greater workforce
participation and the expansion of Black- and brown-owned
businesses. The American Rescue Plan lifts Philadelphia above
divisive either/or choices to a both/and strategy of inclusive
growth. As vaccine distribution ramps up, it's time to get to work.

Paul R. Levy                                                          Peter Tobia
President
Center City District

Center City District & Central Philadelphia Development Corporation                                        CENTERCITYPHILA.ORG
8 | State of Center City

                                        VINE ST

                  2100 Block of
                  Cherry Street

                                                                                   BROAD ST
                                                                              City Hall                          MARKET ST

                                                                                              Washington
           Center City                   Center City
           Residents'                    Residents'                                                         Washington                          Society Hill
           Association                   Association                                                          West

                                                                                              West
                                                                       S 15th St

                                                     SOUTH ST

Center City District Fee for Service Areas
Contracts with adjacent civic associations

        Monday             Wednesday                 Friday

        Tuesday            Thursday                  Center City District
                                                                                                                          WASHIN
                                                                                                                                   GTON
                                                                                                                                          AVE

                                       Peter Tobia

                                                          110+
                                                                                                           Community Service
                                                                                                           Representative Contacts
                                                          Police Officers and
                                                          Community Service
                                                          Representatives stand
                                                                                                                                                      Hospitality/Ambassador                        77,765
                                                          joint roll call and
                                                          coordinate deployment                                                                       Safety/Security                               46,752
                                                                                                                                                      Homeless/Panhandlers                           45,137
                                                                                                               177,131
                                                          244
                                                          Alerts sent in 2020
                                                                                                                Total contacts
                                                                                                                   in 2020
                                                                                                                                                      Public Space
                                                                                                                                                      Business Contact
                                                                                                                                                                                                         6,580
                                                                                                                                                                                                          795
                                                                                                                                                      Outreach Transportation                              102

                                                         4,086
                                                                                                                                                Source: Daily Activity Logs 2020, Center City District

                                                         Individuals, businesses
                                                         or organizations
                                                         receiving alerts in 2020

CENTERCITYPHILA.ORG                                                                                            Center City District & Central Philadelphia Development Corporation
Reanimating the Center of the City |9
Peter Tobia BeauMonde Originals
While gun violence has become a major challenge
in some Philadelphia neighborhoods, other crimes
citywide had been trending down pre-pandemic.
By contrast, Part One crimes were increasing in Center
City since 2017. To support recovery and sustain the
economy, attention to quality of life and public safety
are paramount for the restoration of jobs.
BeauMonde Originals
Part 1 Crimes Per Day in the Center City District, 1996–2020
Nonviolent Crimes Violent Crimes Total Part 1 Crimes
20
16.4
16.0
15
13.8 13.6 13.6
12.6
11.7 12.0 11.7
11.6 11.5 11.4 11.3
11.1 11.0 11.2
10.7 10.8 10.7
10.3
9.6 9.5 9.8 9.9 9.7
10
5
14.6 12.2 10.2 11.9
15.2 12.8 10.4 11.4 9.9 9.9 9.1 9.5 10.2 10.9 9.8 10.2 10.7 10.2 8.4 8.6 8.9 10.1 8.5
9.7 8.7
0 1.4 1.2 1.0 1.4 1.3 1.1 1.2 1.1 1.2 1.2 1.4 1.3 1.2 1.0 1.1 1.0 1.2 1.0 0.9 1.1 1.2 1.0 1.3 1.7 1.2
1996 1997 1998 1999 2000 2001 2002 2003 2004 2005 2006 2007 2008 2009 2010 2011 2012 2013 2014 2015 2016 2017 2018 2019 2020
Source: Philadelphia Police Department
Center City District & Central Philadelphia Development Corporation CENTERCITYPHILA.ORG10 | State of Center City
Daytime Homeless Survey, 2015-2020 Panhandling Survey, 2015–2020
Average Daily Counts Average Daily Counts
100 70
60
83
80
50
800
60 40
40
30
600
40
36
20
20
10
400 27
0 0
2015 2016 2017 2018 2019 2020 2015 2016 2017 2018 2019 2020
200 Source: Philadelphia Police Department Source: Philadelphia Police Department
0
Overnight Homeless Survey, 2020
Average Daily Counts
2020 2015-2020 (Average)
800
564
700
600
500
247 326
400
300
200
100
380 345 409 360 393 526 688 547 548 598 456 370
0
January February March April May June July August September October November December
Source: Philadelphia Police Department
Overnight Homeless Survey, 2020
Weekly Surveys, 6th & 9th Police districts
Average Survey Count Last 10 Years (Average) 2020
800
700
CCD works in partnership
600 with Project HOME and
500
Philadelphia Police to
400
300
connect those in need
200 with services and shelter.
100
0
Jan Feb Mar Apr May Jun Ju Aug Sept Oct Nov Dec
Source: Philadelphia Police Department
CENTERCITYPHILA.ORG Center City District & Central Philadelphia Development CorporationReanimating the Center of the City | 11
Center City District Capital Investments, 1997-2020
Includes Design Costs
OTHER
PROJECT YEAR CCD FUNDS FEDERAL CITY STATE FOUNDATIONS DONORS TOTAL
Center City Streetscape 1997-98 $21,000,000 $5,000,000 $26,000,000
Market East Streetscape 2000 $7,500,000 $7,500,000
Office District Lighting 2002 $2,300,000 $400,000 $300,000 $3,000,000
City Hall Façade Lighting 2004 $135,000 $140,000 $525,000 $800,000
Logan Circle Pedestrian Access 2004 $1,500,000 $1,500,000
Parkway Lighting 2004-05 $2,220,000 $3,000,000 $30,000 $5,250,000
3 Parkway Plaza, Phase I 2005 $450,000 $450,000
City Hall Holiday Lighting 2005 $400,000 $400,000
Pedestrian Lighting 2005 $1,250,000 $400,000 $35,000 $215,000 $1,900,000
Bus Shelter Signs 2006-07 $109,200 $109,200
Aviator Park 2006-07 $1,750,000 $1,750,000
Dilworth Plaza, Design 2006-10 $1,555,900 $1,701,900 $151,500 $3,409,300
City Hall Portal Lighting 2007 $125,000 $125,000
Honor Box Corrals 2007 $14,000 $86,000 $100,000
Parkway Signs 2007 $2,600 $450,000 $70,000 $522,600
Pedestrian Lighting 2007 $347,000 $390,000 $365,000 $1,102,000
Sculpture Lighting 2007 $10,000 $10,000
South Broad Lighting, Phase I-IV 2007-12 $350,000 $1,219,000 $1,015,900 $2,584,900
3 Parkway Plaza, Phase II 2008 $516,000 $1,320,000 $42,000 $1,878,000
Transit Portal Signs, Phase I-IV 2008-13 $146,200 $433,300 $587,000 $514,100 $1,680,600
2nd Street Civic Improvements 2009 $955,000 $955,000
Chestnut Park, Phase I 2009 $91,900 $91,900
Delaware River Trail 2009 $250,000 $323,000 $573,000
TreeVitalize 2009 $100,000 $100,000
Chestnut Park, Phase II 2010 $210,500 $210,500
Sister Cities Park, Phase I 2010 $66,100 $186,500 $252,600
LED Lighting 21st, 22nd, 23rd Street
2010-11 $94,000 $40,000 $134,000
Underpasses
Chestnut/John F. Collins Park 2011 $14,700 $190,000 $1,400 $206,100
Sister Cities Park, Phase II 2011 $53,700 $388,700 $1,985,900 $393,700 $2,822,000
Pedestrian Lighting 2011-12 $196,400 - $1,788,700 - - $405,900 $2,391,000
Dilworth Park, Design & Construction 2011-14 $15,764,230 $15,000,000 $5,750,000 $16,350,000 $1,826,285 $6,066,226 $60,756,741
Reading Viaduct, Phase I 2011-14 $75,631 - $750,000 - $32,649 - $858,280
John F. Collins Park 2012 $8,733 - - - - $8,733
Sister Cities Park, Phase III Completion 2012-13 $153,600 $1,117,100 $0 $503,900 $551,900 $10,000 $2,336,500
City Hall Lighting Improvement 2012-14 - - $142,332 - - - $142,332
Bus Shelter Signs 2013 $46,238 $46,238
Pedestrian Lighting 2014 $30,820 $30,820
Dilworth Park Construction 2015 $2,088,811 $23,801 $28,055 $2,140,667
City Hall Gates 2015 $2,393 $1,425,435 $50,000 $1,477,828
City Hall Gates Lighting 2016 $228,500 $414,717 $643,217
Rail Park, Phase 1 2015-20 $1,407,984 $2,800,000 $4,125,300 $2,447,500 $2,540,067 $13,320,851
City Hall Gates Lighting 2017 $286,777 $286,777
Dilworth Park, Pulse 2017-18 $729,646 $20,000 $325,000 $41,550 $1,116,196
Market Street/JFK Bike Lanes 2020 $3,778 $3,778
Pedestrian Lighting 6th Street 2020 $14,890 $14,890
Pedestrian Lighting 9th & 10th Streets 2019-20 $14,349 $332,900 $347,249
TOTAL $48,334,377 $18,275,800 $28,365,164 $27,567,639 $14,973,389 $13,822,428 $151,338,797
Center City District & Central Philadelphia Development Corporation CENTERCITYPHILA.ORG12 | State of Center City
1600 Market Street | David Fonda
Office
The commercial office sector was profoundly disrupted by the In the first quarter of 2020, based on momentum from 2019,
March 2020 public mandates requiring telework in response rents continued to rise in Center City to $33.80 per square foot.
to the pandemic. Building managers and tenants moved Positive absorption of 142,509 square feet lowered vacancy to
quickly, retrofitting space, upgrading air-handling systems and 12.9%. During the second quarter, following the stay-at-home
instituting new cleaning and health safety protocols in lobbies order, vacancy inched up to 13%, ultimately peaking at 15.4% by
and common areas. Most imagined the interruption would be a year-end, as 536,536 square feet of office space was vacated.
matter of weeks, a few months at most. However, when infection However, the surge in vacancy during the fourth quarter was
rates persisted through summer and spiked in the fall, longer- due less to unanticipated departures, and more a byproduct of
term questions began to emerge about the future of work in downsizing planned prior to the pandemic, including Children’s
office buildings. Hospital of Philadelphia and the Army Corps of Engineers
vacating space in the Wanamaker Building.
Most firms adapted quickly to virtual meeting platforms.
Following telework mandates, throughout 2020 no more than Throughout Center City, remote work enabled nearly all tenants
10% of employees on average came into their offices. The to operate and pay rent, while property owners accommodated
absence of 115,000 professional, tech, business and financial those experiencing financial challenges, executing some
services workers and thousands of non-essential health care temporary extensions and adapting to uncertain circumstances.
and education employees, caused SEPTA ridership, parking Many new deals incorporated flexibility. For example, Blank
garage occupancy and pedestrian volumes on Center City Rome executed a lease that gives them the ability to occupy
sidewalks to plummet, posing significant challenges for between 100,000 and 196,000 square feet over a 16-year term
restaurants and retail. Many cleaning, security and other without penalty.
operations personnel in office buildings were furloughed.
CENTERCITYPHILA.ORG Center City District & Central Philadelphia Development CorporationOffice | 13
Major new developments provided grounds for optimism, Center City remains an affordable location for business,
including Parkway Corporation's start of construction for a centrally located and well connected by highway and transit
new headquarters for Morgan Lewis at 2222 Market Street and along the Northeast Corridor with excellent national and global
National Real Estate Development's construction of a 19-story connections through Philadelphia International Airport. The
specialty care pavilion for Thomas Jefferson on the 1100 block region hosts a significant concentration of educational, medical
of Chestnut Street. Philadelphia’s strength in life sciences and research institutions that create talent-rich labor markets,
also extended beyond University City with conversions from supporting the highest concentration of jobs and educated
office space to new lab space at both The Curtis and 1500 workers in the region.
Spring Garden.
Philadelphia offers both a high quality of life and housing
While telework quickly became the primary mode for the office affordability. Home prices in the Philadelphia region, according
sector, there are many reasons to suggest it will not become the to the Bureau of Economic Analysis, are close to the national
norm. Much can be achieved remotely. However, interaction with average, but well below prices in Washington, New York and
clients, collaboration with colleagues, creative brainstorming, Boston. Most important, all of the advantages of density,
mentoring and professional development work best face-to- challenged by the pandemic, will quickly reassert themselves
face. Many of the best new ideas emerge outside planned as the health emergency recedes. What is required to ensure
gatherings. They are sparked by serendipitous conversations Center City’s continued growth is a broad coalition of civic
in the office, on the street, in restaurants, parks and leaders to actively promote Philadelphia as a business
outdoor cafes. location, build on the momentum of the Ready Set Philly
initiative and not passively accept remote work as the norm.
This is where Philadelphia excels. A dense, compact and
In addition, City government needs to recommit to promoting
walkable downtown enables you to run into colleagues,
strong and inclusive economic growth through tax reform,
competitors or friends on the way to lunch. More than 40 million
increased investment in Black- and brown-owned businesses,
square feet of office space provides a broad range of workplace
neighborhood commercial corridors and programs that improve
options from trophy 21st-century towers, to more affordable
quality of life and overall competitiveness.
renovated historic warehouses to highly flexible coworking spaces.
Center City Office Market Trends, 2020
Q1 2020 Q2 2020
TOTAL ASKING TOTAL VACANCY NET ABSORPTION TOTAL ASKING TOTAL VACANCY NET ABSORPTION
SUBMARKET
RENT (PRICE/SF) RATE (SF) RENT (PRICE/SF) RATE (SF)
East Market $29.81 10.0% 45,838 $29.65 9.9% 6,660
Independence Square $31.12 15.0% 10,312 $31.18 14.5% 17,023
Walnut/South Broad $30.83 18.3% -27,621 $30.78 18.7% -15,649
West Market $36.14 12.3% 113,980 $35.90 12.6% 12,365
CENTER CITY $33.80 12.9% 142,509 $33.67 13.0% 20,399
Q3 2020 Q4 2020
TOTAL ASKING TOTAL VACANCY NET ABSORPTION TOTAL ASKING TOTAL VACANCY NET ABSORPTION
SUBMARKET
RENT (PRICE/SF) RATE (SF) RENT (PRICE/SF) RATE (SF)
East Market $30.48 9.5% 22,295 $31.38 15.6% -357,416
Independence Square $31.13 15.7% -59,256 $31.96 17.1% -57,493
Walnut/South Broad $30.89 19.4% -28,117 $30.75 20.2% -33,514
West Market $35.80 13.8% -284,758 $36.31 14.2% -88,113
CENTER CITY $33.76 13.9% -349,836 $34.53 15.4% -536,536
Source: Newmark Knight Frank
Center City District & Central Philadelphia Development Corporation CENTERCITYPHILA.ORG14 | State of Center City
Center City Philadelphia Office Market, 1985–2020
Occupied (SF) Vacant (SF) Occupancy Rate
Square Feet (Millions)
50
95%
40
91%
30 87%
20 83%
10 79%
0 75%
85
86
87
88
89
90
91
92
93
94
95
96
97
98
99
00
01
02
03
04
05
06
07
08
09
10
11
12
13
14
15
16
17
18
19
20
19
19
19
19
19
19
19
19
19
19
19
19
19
19
19
20
20
20
20
20
20
20
20
20
20
20
20
20
20
20
20
20
20
20
20
20
Note: Data includes only buildings in Center City, not University City, and counts several major, Source: Newmark Knight Frank
owner-occupied properties that are not commercially leased.
Central Business District Asking Rents, 2020 Central Business District Occupancy, 2020
San Francisco $82.38 San Francisco 97.2%
NYC - Midtown $80.11 Orlando 92.9%
NYC - Midtown South $78.33 NYC - Midtown South 92.1%
Boston $64.85 NYC - Downtown 92.1%
NYC - Downtown $62.12 NMYC - Midtown 91.9%
Oakland $60.48 Sacramento 89.6%
Washington $57.49 Boston 89.0%
NYC - Brooklyn $53.36 NYC - Brooklyn 88.2%
Fairfield County, CT $49.08 Miami 86.2%
Miami $44.47 Philadelphia 85.3%
Los Angeles $43.60 Baltimore 85.2%
San Diego $41.51 Jacksonville 84.9%
Houston $41.05 Washington 84.7%
Denver $39.83 Orange County, CA 84.6%
Chicago $37.63 Portland, OR 83.3%
Orange County, CA $36.65 Chicago 81.6%
Philadelphia $34.53 Denver 81.6%
Sacramento $33.60 Atlanta 81.5%
Portland, OR $33.21 Oakland 80.6%
Atlanta $33.14 Fairfield County, CT 79.6%
Orlando $28.36 Los Angeles 79.6%
Phoenix $27.33 Phoenix 79.6%
Dallas $26.14 San Diego 78.8%
Baltimore $23.03 Dallas 73.5%
Jacksonville $22.15 Houston 73.4%
$0 $20 $40 $60 $80 $100 20% 40% 60% 80% 100%
Source: Newmark Knight Frank Source: Newmark Knight Frank
CENTERCITYPHILA.ORG Center City District & Central Philadelphia Development CorporationOffice | 15
Class A Rents, Central Business District Compared to Suburbs, 2020
Boston 117%
Washington 78%
Chicago 66%
Denver 64%
Oakland 59%
Sacramento 45%
Fairfield County, CT 44%
Houston 37%
Miami 24%
Philadelphia 23%
Orange County, CA 20%
Portland, OR 18%
Orlando 15%
Atlanta 11%
San Diego 6%
San Francisco 4%
Phoenix 3%
Jacksonville -3%
Los Angeles -4%
Baltimore -10% -13%
Dallas -14%
-20% 0% 20% 40% 60% 80% 100% 120%
Source: Newmark Knight Frank
Philadelphia's affordability, a byproduct of slow growth and
modest demand, can be a central selling point in a campaign
to market Center City as a preferred business location throughout
the Northeast.
Regional Average Asking Rents, 2020
Price per square foot
University City $50.12
The Navy Yard $46.85
Radnor $45.40
Conshohocken $41.06
Bala Cynwyd $34.95
Center City Philadelphia $33.23
King of Prussia/Wayne $31.66
Delaware County $27.85
Plymouth Meeting/Blue Bell $27.63
Malvern/Exton $26.64
Lower Bucks County $25.88
West Chester $25.73
Fort Washington $25.41
Wilmington CBD $24.03
Horsham/Willow Grove $23.67
Source: JLL Research
Center City District & Central Philadelphia Development Corporation CENTERCITYPHILA.ORG16 | State of Center City
Center City Average Asking Rent Center City Occupancy Rate by Class
Dollars per square foot Trophy Class A Class B Trophy Class A Class B
$45 100%
$42.71
$40
95% 93.6%
$35
$32.92
$32 92
$28.97 90% 91.0%
$30 86.5% 86.5%
$26.77
$28.62 85%
$25
85.5% 85.4%
$22.49
$20 80%
2010 2011 2012 2013 2014 2015 2016 2017 2018 2019 2020 2010 2011 2012 2013 2014 2015 2016 2017 2018 2019 2020
Note: The increase in average Trophy class rent in 2020 Source: JLL Research Source: JLL Research
reflects a significant increase at one building.
While life science tenants have many reasons to cluster in
University City, proximity to Thomas Jefferson University and
the availability of many affordable and easily adaptable older
GIRARD AVE
buildings creates an opportunity for Center City landlords.
Greater Philadelphia Spring House Myoderm Global HQ
Life Sciences Inventory Innovation Park 100 Progress Dr, Horsham
727 Norristown Rd, Ambler 65,000 SF
Pipeline Under 141,000 SF
Construction and
Proposed Construction/ Protecs Expansion
Conversions 3700 Horizon Dr, Upper Merion
74,000 SF
Proposed 1500 Spring Garden
200,000 SF
Proposed
Partial Conversion
BROAD ST
Under Construction
Build to Suit
Under Construction VINE ST
Speculative Schuylkill Yards
3025 JFK
Source: Newmark Research 775,000 SF
Cira Centre
2939 Arch
182,000 SF
One uCity Square
1 Filbert 833 Chestnut
390,000 SF MARKET ST City Hall 90,000 SF
Schuylkill Yards One South Broad
3.0 University Place The Curtis
1 South Broad
4104 Market 3151 Market 601 Walnut
92,000 SF
240,000 SF 450,000 SF 300,000 SF
Powelton Yard
100 N 32nd
125,000 SF
PINE ST
Navy Yard Iovance Biotherapeutics
2500 League Island 300 Rouse
110,000 SF 136,000 SF
CENTERCITYPHILA.ORG Center City District & Central Philadelphia Development CorporationOffice | 17
Significant Office Leasing Transactions in Center City, 2020
MARKET WEST
TENANT BUILDING CLASS SIZE (SF) TYPE
Blank Rome One Logan Square Trophy 196,000 Renewal
Army Corps of Engineers 1650 Arch St A 101,000 Relocation
Hana Beneficial Bank Place A 50,745 New to Market
Passage Bio One Commerce Square Trophy 37,414 Relocation
Dechert 1735 Market St Trophy 34,987 Relocation
QTC Management One Penn Center at Suburban Station B 29,788 Expansion
GrubHub Three Parkway A 28,214 Blend and Extend
Evolution Gaming 1500 Spring Garden St B 24,011 New to Market
Olin Partnership One Penn Center at Suburban Station B 23,571 Relocation
FreedomPay 2401 Walnut St A 14,453 New Lease
Ricci Tyrrell Johnson & Grey 1515 Market St A 13,511 Renewal
Naulty Scaricamazza & McDevitt One Penn Center at Suburban Station B 12,000 Renewal
Bohler Engineering 1515 Market St A 11,350 New to Market
Service Employees International Union
1515 Market St A 10,429 Renewal
Local 32BJ
AJO 230 S Broad St B 10,387 Renewal
MARKET EAST
TENANT BUILDING CLASS SIZE (SF) TYPE
Mindspace The Wanamaker Building A 41,277 New to Market
Weir & Partners The Widener Building A 21,924 Renewal
Imvax The Curtis A 17,000 Relocation
City Of Philadelphia Aramark Tower A 15,231 Relocation
BDP International One Washington Square A 13,331 Renewal
Hachette Book Group Wells Fargo Building B 11,500 Relocation
Philadelphia Futures Wells Fargo Building B 11,217 New Lease
Thomas Jefferson University Aramark Tower A 10,156 New Lease
Source: JLL Research
As the challenges of 2020 recede, the Center City office district
can grow beyond a pattern of renewals and lateral moves to
become a place that attracts in-moving companies and new
firms in expansion mode.
Center City District & Central Philadelphia Development Corporation CENTERCITYPHILA.ORG18 | State of Center City
Jefferson | Karen Kirchhoff ©Thomas Jefferson University Photography Services
Health Care &
Education
In 2020, Philadelphia’s health care institutions were the epicenter In 2020, while front-line workers staffed hospitals 24-7, pro-
of the response to the COVID-19 epidemic. Jefferson Health and fessional, technical and administrative staff in hospitals and
Penn Medicine converted parking lots to walk-in and drive-in academic institutions worked remotely, like other office em-
testing sites and then deployed multiple vaccination sites across ployees. Classes shifted online and telemedicine replaced office
the city and region. Temple University converted the Liacouras visits. Closed buildings reduced demand for administrative and
Center into an overflow hospital for coronavirus cases, before support personnel. As a result, employment in health care and
transforming it into a site for vaccinations. Hospital beds and education declined in 2020. Health care and social assistance
personnel were consumed by the treatment of serious cases. employment was down by 6,000 between March and December,
with losses primarily in social assistance jobs. Educational in-
In 2019, health care and education provided 242,800 jobs
stitutions shed 9,400 jobs during this period. As students return
citywide in the public and private sectors, approximately one-
to the classroom this fall, doctors’ offices reopen and day care
third of all payroll employment in Philadelphia. In Center City,
and other social services resume, most of these jobs should be
these sectors accounted for 18% of employment with 55,000
restored. However, the broader decentralizing trends that bring
jobs. During the prior decade, private health care employment
services closer to where people live are likely to continue.
growth in Philadelphia reflected the expansion of ambulatory
care services – offices of doctors and other health care practi- Center City’s 12 institutions of higher education collectively
tioners, outpatient care centers, laboratories, and home health enrolled 30,934 undergraduate and graduate students in the
care services. From 2009 to 2019, private ambulatory care em- fall of 2019, including 16,000 at Community College of Philadel-
ployment increased 42%, while hospital employment increased phia and 8,000 at Thomas Jefferson University. The Center City
1% and nursing and residential care facilities declined 8%. campuses of Drexel University and Temple University enrolled
an additional 2,100 and 700, respectively. Including nearby
CENTERCITYPHILA.ORG Center City District & Central Philadelphia Development CorporationHealth Care & Education | 19
institutions – Temple’s main campus in North Philadelphia, and In 2020, Philadelphia’s research institutions attracted $1.1 bil-
the University of Pennsylvania, Drexel University, and the Univer- lion in National Institutes of Health funding, the fourth-highest
sity of the Sciences in University City – the total higher education total among major U.S. cities. Combined research spending at
enrollment in or near Center City exceeded 110,000 in 2019. Drexel, Temple, Jefferson, and Penn totaled $2 billion in 2018. In
2020, the University of Pennsylvania, in partnership with Chil-
While the pandemic forced many institutions to transition to
dren’s Hospital of Philadelphia and The Wistar Institute, began
virtual learning, colleges and universities located in or near
research on the health impacts of COVID-19 on children.
Center City estimate that 80% of students who previously lived in
Philadelphia, on campus or off, returned to the city in fall 2020. These academic, research and medical institutions have helped
Temple University reported more than 12,000 students living on Philadelphia emerge as a national center for life sciences, fos-
and around campus in the 2020-2021 academic year, with 1,000 tering new startups and attracting new businesses. While most
residing in ZIP codes of 19123 and 19130. The presence of growth is concentrated in University City, several older buildings
students helped sustain both the apartment market and down- in Center City that can support heavy floor loads and have good
town retail, making up 13% of the adult population in Greater ventilation are attracting lab space. Venture capital has played a
Center City. large part in the explosive growth of these small labs. According
to Bridge Bank, in 2010 there were 113 deals in Philadelphia.
Graduates of these institutions form a critical mass of well-
That number surged to 260 in 2019 and reached a high of 221
educated workers, creating a powerful lure for Philadelphia’s
in 2020, despite the pandemic. Health care and education have
growth industries. Health sciences are the major for 28% of
therefore remained not only a mainstay of today’s economy, they
local college graduates; science, technology engineering and
are laying the groundwork for Philadelphia’s next economy.
math (STEM) accounts for another 20%; business degrees are
earned by 19%. A growing number of college graduates have
been staying in Philadelphia, contributing to the 44% increase
since 2000 in Greater Center City of residents in the 20-34 age
group. They now number more than 70,000.
National Institutes of Health Funding, 2020
Boston $2.26B
New York $2.19B
Seattle $1.55B
Philadelphia $1.16B
Los Angeles $1.16B
Baltimore $1.12B
Chicago $972M
Durham $925M
La Jolla $895M
San Francisco $836M
Houston $731M
Pittsburgh $675M
Source: U.S. Department of Health and Human Services, National Institutes of Health
Center City District & Central Philadelphia Development Corporation CENTERCITYPHILA.ORG20 | State of Center City
Private Employment in Education and Health Care, Philadelphia City and Pennsylvania Suburbs,
2009-2019
PHILADELPHIA SURROUNDING COUNTIES (PA)
2009 2019 % CHANGE 2009 2019 % CHANGE
Educational service, health care
191,325 227,005 19% 201,017 247,609 23%
and social assistance
Educational services 57,477 58,359 2% 34,030 33,266 -2%
Health care and social assistance 133,848 168,646 26% 166,987 214,343 28%
Ambulatory health care services 29,869 42,342 42% 59,507 76,951 29%
Hospitals 61,295 62,059 1% 38,867 38,892 0%
Nursing and residential
19,103 17,556 -8% 45,491 49,886 10%
care facilities
Social assistance 25,821 49,391 91% 23,122 48,615 110%
ALL INDUSTRIES 518,304 595,612 15% 1,046,599 1,149,587 10%
Note: Pennsylvania suburbs include Bucks, Chester, Delaware, and Montgomery counties. Source: Bureau of Labor Statistics, Quarterly Census of Employment and Wages
In the last 20 years, there has been a significant increase in
the number of adults with college degrees and a dramatic
decline of those without a high school diploma.
Educational Attainment of Philadelphia Residents, Age 25 and Older
Less than High School High School Some College Bachelor’s Degree or More
2019
15.3% 32.6% 22.4% 29.7%
2010
20.6% 35.6% 21.5% 22.2%
2000
28.8% 33.3% 20.0% 17.9%
Source: U.S. Census Bureau, 2000 and 2010 decennial census,
and American Community Survey 2019 five-year estimate
CENTERCITYPHILA.ORG Center City District & Central Philadelphia Development CorporationTemple University,
Health Care & Education | 21
Main Campus
34,551
Community College
of Philadelphia
15,996
BROAD ST
VINE ST
Drexel University,
Moore College CC Campus
of Art & Design 2,103
Pennsylvania Academy
408 of the Fine Arts
273
Temple University,
MARKET ST CC Campus City Hall
Hussian College
778 128
Drexel
University
JNA Institute of
15,812 Culinary Arts Thomas Jefferson
University of 29 University
Pennsylvania 8,026
26,675 Curtis Institute
of Music
Academy of 173
Vocal Arts University of
24 the Arts
University of PINE ST
Peirce 1,861
the Sciences College
2,285 1,178
Higher Education Enrollment, Fall 2019 110,300 students
enrolled in higher education
institutions in and around Center City
Sources: Temple University Fact Book; Drexel University Factbook, 2018-2019;
< 500 501–2,000 2,001–10,000 > 10,000 National Center for Education Statistics.
Degrees Conferred by Type, 2019
Health Fields 28.3%
STEM 20.2%
TASKER ST
Business 18.7% Nearly half of recent college
Liberal Arts 14.7%
graduates have degrees in
31,261 Visual and
Performing Arts
Education
6.5%
4.9%
health, science, technology,
Graduates
Legal Professions engineering and math.
and Studies 3.0%
Other 3.7%
Source: U.S. Department of Education, National Center for
Education Statistics, Intergrated Postsecondary Education Data System
Center City District & Central Philadelphia Development Corporation CENTERCITYPHILA.ORG22 | State of Center City
Research Expenditures at Center City and Adjacent Universities
Expenditures ($ in Millions) 2014 2015 2016 2017 2018
$1,600
$1,400
$1,441.9
$1,374.3
$1,296.4
$1,200
$1,000
$800
$864.1
$828.4
$600
$268.4
$276.0
$246.4
$227.5
$224.1
$400
$155.9
$148.6
$142.6
$138.6
$122.4
$128.0
$127.9
$118.4
$119.6
$131.2
$200
$0
Drexel University Temple University Thomas Jefferson University University of Pennsylvania
Source: National Science Foundation, National Center for Science & Engineering Statistics, Higher Education R&D Survey
New Patent Applications Startups
2015 2016 2017 2018 2015 2016 2017 2018
250 20
18
18
197
16
200
175
15
171
13
145
150
132
120
10
92
100
7
75
6
6
68
64
5
5
53
53
5
51
4
4
4
50
38
36
3
3
28
24
1 1
132
175
0 * * * 0 * * * *
Drexel Temple Thomas Jefferson University of Children's Hospital Drexel Temple Thomas Jefferson University of Children's Hospital
University University University Pennsylvania of Philadelphia University University University Pennsylvania of Philadelphia
Source: Association of Technology Managers, Licensing Activity Survey 2018 Source: Association of Technology Managers, Licensing Activity Survey 2018
CENTERCITYPHILA.ORG Center City District & Central Philadelphia Development Corporation| 23
Chapter Name
Kimpton Hotel Monaco Philadelphia | J. Fusco for VISIT PHILADELPHIA®
Conventions,
Tourism & Hotels
No sector in Philadelphia was challenged more profoundly by 2019, could rebound slowly by the second half of 2021 with new
the pandemic than tourism and conventions. The sudden loss safety protocols in place. Conventions may also include hybrid
of visitors rippled through the local economy, eliminating jobs models with reduced in-person attendance and increased
in hotels, restaurants, and cultural organizations, depressing virtual programming.
airline travel, tax revenues and vitality on Center City sidewalks.
During the last three decades, Center City emerged as a highly
Hotel occupancy dropped from 76.3% in 2019 to 14.8% in the
competitive convention and tourist destination, due to major
second quarter before inching up slowly in the fourth quarter of
investments in the Pennsylvania Convention Center, new visitor
2020 to 22.5%. The pandemic resulted in the loss of 600 sched-
destinations around Independence National Historical Park, and
uled group events, a 78% decline in international travel and
new hotels, restaurants and cultural institutions throughout the
an estimated loss of $3.2 billion in spending, according to the
downtown. Promoted by sustained marketing and sales efforts,
Philadelphia Convention and Visitors Bureau.
the city experienced steady growth in convention, group, busi-
Recovery will be gradual. As vaccination rates increase, leisure ness and leisure travel. This produced significant job growth,
travel should return first as consumers choose shorter trips to with accommodation and food services adding 17,850 private
nearby destinations. In 2019, leisure travel accounted for 33% of sector jobs citywide from 2002 to 2019. The COVID-19 pandemic
room demand. Philadelphia’s location on the dense Northeast temporarily erased these gains, with a loss of 23,400 jobs
Corridor, well served by highways and trains, provides a distinct from March to September 2020, a 40% decline. As restrictions
advantage. Business travel, which accounted for 31% of room relax on business activity, as travelers gain confidence and as
demand in 2019, will mirror the process of business openings vaccinations increase and cases decline, employment will
throughout 2021 and 2022. Conventions, trade shows and steadily rebound.
group travel, which accounted for 32% of room demand in
Center City District & Central Philadelphia Development Corporation CENTERCITYPHILA.ORG24 | State of Center City
Prior to the pandemic, the Pennsylvania Convention Center The average daily room rate (ADR) for Center City decreased
hosted 17 conventions and events in early 2020, with 1.2 mil- from a high of $202 in 2019, to $156 in 2020, comparable to
lion attendees. It then took on new civic purposes, serving as a rates during the Great Recession in 2008-2009. Rates are fore-
vote counting center in the general election of 2020 and a mass cast to gradually increase over the next three years, as demand
vaccination site in 2021. increases. Total hotel revenue decreased from a modern-day
high of $707 million in 2019 to $176.9 million in 2020.
To position the center for the return of conventions and other
events, the Pennsylvania Convention Center Authority made new Nonetheless, betting on a strong recovery for Center City’s leisure
investments to enhance health safety, including upgraded air sector, the Canopy by Hilton and the Hyatt Centric opened in
handling units, and received the Global Biorisk Advisory Coun- 2020, increasing downtown room inventory to over 13,000.
cil's (GBAC) Star accreditation on outbreak prevention, response
Forecasts for Center City anticipate a slow recovery in 2021
and recovery. There are currently 18 major conventions still
as the vaccine becomes more widely available, with increasing
on the books for 2021, although plans are subject to change,
demand in the third and fourth quarters. It is estimated that
given the uncertainty of health guidelines for large events. The
ADR and occupancy rates may not return to 2019 levels until
Philadelphia Convention and Visitors Bureau (PHLCVB), which is
at least 2023.
prepared to start booking new events, conservatively estimates
that total attendance for 2021 will be 100,000, less than one-
tenth of 2019 levels. To promote leisure travel, which accounted
for 464,000 room nights in 2020, Visit Philadelphia’s marketing
Average
$250
Daily Room Rate for Center City Hotels
campaign, #ourturntotourist, is focused on those within easy
driving distance.
$202
In 2020, counting about 75 days of normal business before the $200
pandemic, the yearlong occupancy rates averaged 30.9% with $173
1.1 million occupied hotel room nights. Many Center City hotels
decided by the end of March 2020 to temporarily suspend oper-
ations, including The Loews Hotel Philadelphia, the Downtown $150
$156
Marriott and the Warwick Rittenhouse Square, while others
were repurposed by the City as quarantine sites for the home-
less, including the Holiday Inn Express at Sansom and Juniper
$100
streets and the Fairfield Inn. With temporary hotel closures, 2008 2009 2010 2011 2012 2013 2014 2015 2016 2017 2018 2019 2020
room inventory dropped to 10,016.
Source: Philadelphia Convention & Visitors Bureau
Occupied Center City Hotel Rooms by Purpose of Trip, 2008-2020
Group and
Room Nights Individual Leisure Commercial* Convention Airline Government
4,000,000
62,000
3,500,000
3,000,000 69,212 1,117,000
, ,
97,207
2,500,000
926,476
2,000,000
987,894
689,002
1,500,000
68,600
409,800
696,940
1,000,000 189,900
704,880
464,000 409,800
500,000
677,215 464,000
0
2008 2009 2010 2011 2012 2013 2014 2015 2016 2017 2018 2019 2020
*Beginning in 2018, the commercial category includes government. Source: STR Inc. and TravelClick, provided by Philadelphia Convention & Visitors Bureau
CENTERCITYPHILA.ORG Center City District & Central Philadelphia Development CorporationConventions, Tourism & Hotels | 25
In 2020, 366,300 international visitors came to the Philadelphia Older hotels are responding with rebranding and renovations.
region, generating an economic impact of $253.3 million. Visi- The Sheraton Philadelphia Downtown underwent a $30 million
tors from Canada and Mexico accounted for 68% of international upgrade to its 760 rooms and fitness center. The Philadelphia
travelers. Due to pandemic-related travel restrictions, Phila- Marriott Downtown began extensive renovations including
delphia International Airport handled fewer than 11.9 million technology upgrades to public workstations and WiFi access
passengers in 2020, a 64% decrease from the 2019 all-time points, renovations to the hotel entrance and all 1,408 guest
annual record of 33 million passengers. January and February rooms, and a new grab-and-go market in the lobby.
2020 had year-over-year increases in travelers, 2.5% and 4.45%
respectively. PHL was temporarily stripped of its “funneling
Historic Attraction Attendance, 2019–2020
airport” status, resulting in nearly six months where it was
unable to receive travelers from countries including the top two
2019 2020
feeder markets, the U.K. and China. International travel suffered
Independence National Historical Park (all attractions)*
an almost 83% drop and domestic travel fell by 61% from 2019.
4.6M
During this time PHL increased its airmail capacity, transporting
907K
upwards of 53,268 tons of mail in 2020, an almost 87% increase Independence Visitor Center
from 2019. 2.5M
360K
Eight hotel projects under construction or proposed in Center
Liberty Bell Center
City will expand downtown supply to more than 14,000 rooms by 2.0M
the end of 2021. Those currently in the pipeline with an antici- 291K
pated completion date of 2021 include the Element by Westin, Independence Hall
W Hotel, MainStay Suites/Ascend Hotel Collection and Comfort 561K
Inn Arch Street. Collectively, they will add 1,093 rooms. In the 69K
National Constitution Center
planning phases are 1101 Walnut Street, a short term apartment
260K
concept operated by San Francisco-based Sonder, AC Hotel by
80K
Marriott, 2300 Market Street and Blue Ivy Hotel. These will join Betsy Ross House
the recently opened Canopy by Hilton Philadelphia Center City 196K
and Hyatt Centric Philadelphia. 22K
Christ Church and Burial Ground *Note: Figures for Independence National Historical Park
are estimates of the number of unique visitors and do not
126K represent the sum of all visits to individual attractions.
Source: Individual organizations
Availability & Occupancy of Center City Hotel Rooms, 2008-2020
Hotel Rooms Occupancy
14,000 85%
70.8%
13,000 73%
12,000 61%
11,000 49%
30.9%
10,000 37%
9,000 10,045 10,262 10,580 10,586 10,813 11,199 11,210 11,119 11,139 11,675 12,283 12,767 10,016
25%
2008 2009 2010 2011 2012 2013 2014 2015 2016 2017 2018 2019 2020
Room Supply Occupancy Rate Source: STR Inc., provided by Philadelphia Convention & Visitors Bureau
Center City District & Central Philadelphia Development Corporation CENTERCITYPHILA.ORGYou can also read