2022-2026 State Health Improvement Plan
  Priority Health Issues Data Overview
←
→
Page content transcription
If your browser does not render page correctly, please read the page content below

2022-2026 State Health Improvement Plan Priority Health Issues Data Overview

TABLE OF CONTENTS
   2022-2026 State Health Improvement Plan
     Priority Health Issues Data Overview
Alzheimer’s Disease and Related Dementias         1

Mental Wellbeing and Substance Abuse Prevention   3

Chronic Diseases and Conditions                   12

Transmissible and Emerging Diseases               15

Injury, Safety and Violence                       19

Maternal and Child Health                         24

Social and Economic Conditions Impacting Health   28
Alzheimer’s Disease and Related Dementias

Overview
Alzheimer’s disease is the most common cause of dementia in older adults. It is an irreversible, progressive
brain disorder that destroys memory and thinking skills and, eventually, the ability to carry out the simplest
tasks. While dementia is more common as people grow older, it is not a normal part of aging.1

Florida Compared to the United States
More than 6 million Americans are living with Alzheimer’s. The cost of caring for those with Alzheimer’s and
other dementias is estimated to total $355 billion in 2021 and projected to increase to more than $1.1 trillion
by mid-century. Florida has the second highest prevalence of Alzheimer’s disease in the U.S.

Alzheimer’s Disease in Florida

State Trends
In 2020, there were approximately 580,000 people ages 65 years and older with Alzheimer’s in Florida. By
2025, it is estimated this number will increase by 24.1 percent to 720,000.2 African Americans are two times
more likely and Hispanics are 1.5 times more likely to get Alzheimer’s disease than their White counterparts.
However, there is less access to diagnosis and support services for culturally diverse communities, who are
disproportionately affected by Alzheimer’s disease and related dementias.1
           Exhibit 1: Deaths from Alzheimer's Disease, Age-adjusted Rate Per 100,000 Population, 2019

Source: Florida Department of Health, Bureau of Vital Statistics

1 Alzheimer's Disease and Related Dementias. (October 26, 2020). Centers for Disease Control and Prevention. Retrieved October 5, 2021 from
https://www.cdc.gov/aging/aginginfo/alzheimers.htm#AlzheimersDisease?
2
  2021 Alzheimer’s Disease Facts and Figures. Alzheimer’s Association. Retrieved October 5, 2021 from
https://www.alz.org/media/Documents/alzheimers-facts-and-figures.pdf
                                                                                                                                              1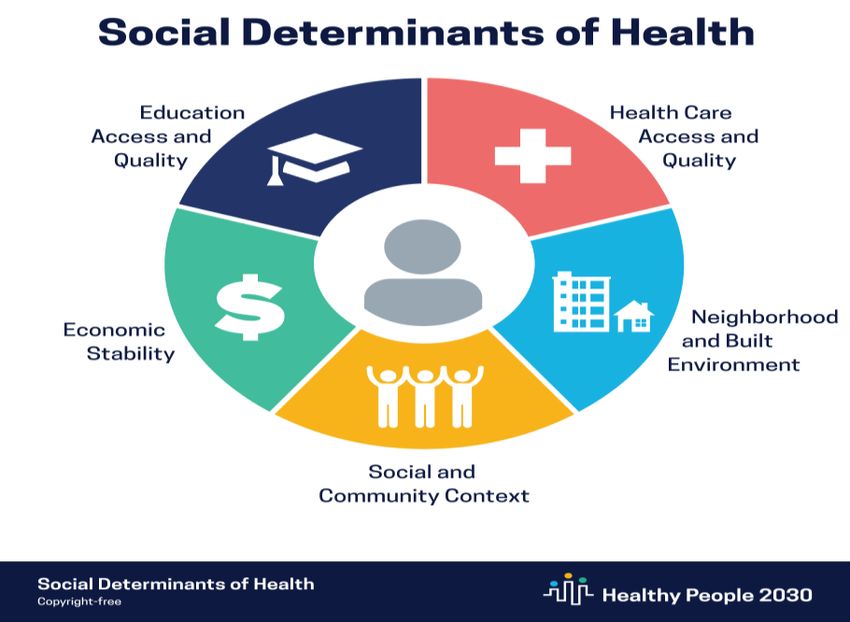
Alzheimer’s Disease and Related Dementias

In 2019, Alzheimer’s disease was ranked as the sixth leading cause of death in Florida and the U.S. From 2011
to 2020, the probable Alzheimer’s disease cases in Florida among adults ages 65 years and older decreased;
however, deaths from Alzheimer’s disease have increased 145 percent within that same time period.

Dementia caregivers today are providing 20 percent more care than in 2009. There were approximately
527,000 caregivers providing 685 million hours of unpaid care in Florida in 2020. The total value of the care
given was well over $10.6 billion. Providing that level of care to a person with dementia can make a substantial
impact on the health and well-being of the caregiver. In 2020, 47.8 percent of caregivers were battling some
type of chronic health condition while 16.3 percent were battling depression.3

               Exhibit 2: Probable Alzheimer’s Cases, Percent of Population Ages 65 and Older, 2020

Source: Florida Department of Health, FLHealthCHARTS.com
                                                                                 Exhibit 3: Aggregated Costs of Care for Americans
In 2020, caregivers of people with Alzheimer’s Disease and                                 Ages 65 and Older with ADRD
related dementias (ADRD) provided an estimated 15.3
billion hours of unpaid care, a contribution to the nation
valued at $244 billion.3

Total payments in 2020 for all individuals with dementia
are estimated at $355 billion (not including unpaid
caregiving). Medicare and Medicaid are estimated to cover
$240 billion or 68 percent of the total health care and long-
term care payments for people with ADRD. Out-of-pocket
spending is estimated to be $76 billion3 (Exhibit 3).
                                                                                 Source: Alzheimer’s Disease 2021 Facts and Figures

32021 Alzheimer’s Disease Facts and Figures. Alzheimer’s Association. Retrieved October 5, 2021 from
https://www.alz.org/media/Documents/alzheimers-facts-and-figures.pdf
                                                                                                                                      2
Mental Wellbeing and Substance Abuse
                                      Prevention

Overview
Mental wellbeing is important for anyone at any age or state of life. It is encompassed within behavioral
health which includes the emotions and behaviors that affect a person’s overall well-being.1 Behavioral health         0F

encompasses both mental illness and substance misuse or use disorders in a population. Mental illnesses are
conditions (e.g., depression or anxiety) that affect a person’s thinking, feeling, mood or behavior. Individuals
who misuse substances such as prescription medications, illicit drugs and alcohol are at a greater risk of heart
attack, stroke, overdose and early death. Mental illness and substance misuse/use disorders often occur
together. 2 A healthy mental state is essential to overall positive health and well-being.
            1F

In 2019, it is estimated that 51.5 million adults aged 18 years or over were diagnosed with a mental illness
disorder in the U.S.1
Adolescent and Young Adult Mental Health Issues
Adolescence is the phase of life between childhood and adulthood from ages 10 to 19 years. It is a unique
state of human development and an important time for laying the foundations of good health. Adolescents
experience rapid physical, cognitive and psychosocial growth. This affects how they feel, think, make decisions
and interact with the world around them.

Adolescent years should be a time of growth, health and thriving. This is best achieved by decreasing risk
factors such as substance abuse, unhealthy relationships and poor nutrition, as well as by increasing protective
factors such as health education, positive peer relationships and access to quality health care. During this
phase, adolescents establish patterns of behavior that can protect their health and the health of others
around them or put their health at risk now and in the future. 3 The public health approach to adolescent
                                                                                2F

development includes acknowledging the intersection between different risk behaviors and utilizing a holistic
approach to address healthy decision making.

According to the 2019 Youth Risk Behavior Survey, nearly 15 percent of Florida high school youth reported
being bullied on school property as compared to 19.5 percent of high school youth nationwide (Exhibit 1).

1 Behavioral Health. (November 17, 2020). Centers for Medicare and Medicaid Services. Retrieved October 5, 2021 from Behavioral Health | CMS
2 Behavioral Health - Annual. (n.d.) America's Health Rankings United Health Foundation. Retrieved October 5, 2021 from Explore Behavioral Health
- Annual in Florida | 2020 Annual Report | AHR (americashealthrankings.org)
3 World Health Organization (WHO). (2021, October 6). Adolescent Health. Retrieved from Work Health Organization: https://www.who.int/health-

topics/adolescent-health#tab=tab_1

                                                                                                                                               3
Mental Wellbeing and Substance Abuse
                                                   Prevention

            Exhibit 1: Percentage of High School Students Who Were Bullied on School Property, 2019
                                 25

                                 20

                                 15
                    Percentage

                                 10

                                  5

                                  0
                                                Florida                               U.S.
Source: Youth Risk Behavior Survey, Center for Disease Control and Prevention, 2019

Incidents of bullying can lead to high-risk behaviors such as substance use and abuse. In the 2019 Youth Risk
Behavior Survey, 26 percent of Florida high school students reported current use of alcohol as compared to 29
percent of high school students nationwide (Exhibit 2).

                  Exhibit 2: Percentage of High School Students Who Currently Drank Alcohol, 2019
                 (at least one drink of alcohol, on at least 1 day during the 30 days before the survey)
                                 35

                                 30

                                 25
                 Percentage

                                 20

                                 15

                                 10

                                 5

                                 0
                                               Florida                                U.S.

Source: Youth Risk Behavior Survey, Center for Disease Control and Prevention, 2019

                                                                                                            4
Mental Wellbeing and Substance Abuse
                                               Prevention

As a trend, the percentage of alcohol use among Florida high school students has dropped from 42 in 2004 to
19.9 in 2020 and from 20.3 to 8.2 in middle school students. 4                3F

Youth prevention remains critical to combating tobacco use because nearly 9 out of 10 smokers start by age
18 years. In 2020, 14.5 percent of Florida youth ages 11-17 years reported current electronic vapor product
use, which is nearly a 13 percent decrease from 2019 (Exhibit 3). Evidence suggests that teens who use e-
cigarettes may be at greater risk of starting to smoke regular cigarettes. 5                 4F

    Exhibit 3: Percentage of Current Electronic Vapor Product Use for Youth Ages 11-17, Florida, 2014 - 2020

                          30

                          25

                          20
    Percentage

                          15

                          10

                              5

                              0
                                    2014       2015             2016               2017           2018            2019            2020
                 Ever tried         12.3        26.2            24.5               22.3           26.3            27.9             26.4
                 Currently use      7.2         10.9            11.6               9.8            15.7            16.6             14.5

Source: Florida Youth Tobacco Survey

The percentage of youth ages 11-17 years who are current users of electronic vapor products ranges from 6.1
in Gadsden County to a high of 33.7 in Franklin County (Exhibit 4).

4 Florida Department of Children and Families. (2021, October 6). 2020 Florida Youth Substance Abuse Survey. Retrieved from MyFlFamilies.com:
https://www.myflfamilies.com/service-programs/samh/prevention/fysas/2020/
5 Centers for Disease Control and Prevention. (2021, October 6). Preventing Adverse Childhood Experiences. Retrieved from Violence Prevention:

https://www.cdc.gov/violenceprevention/aces/fastfact.html

                                                                                                                                                 5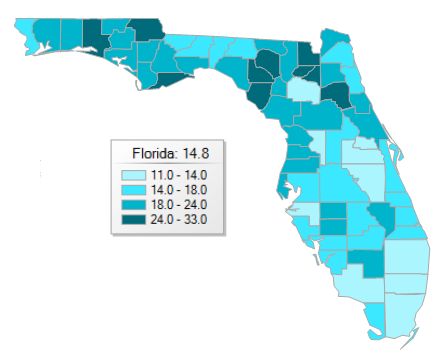
Mental Wellbeing and Substance Abuse
                                      Prevention

    Exhibit 4: Percentage of Youth Ages 11-17 Who Are Current Users of Electronic Vapor Products, Florida,
                                                   2020

Source: Florida Youth Tobacco Survey

Risk behaviors can co-occur with risk factors such as mental illness, feelings of depression, anxiety and suicidal
thoughts. According to the 2019 Youth Risk Behavior Survey, 33.7 percent of Florida high school students
reported feeling sad or hopeless within the last 30 days compared to 36.7 percent of high school students
nationwide.

Suicide is the second leading cause of death for adolescents and young adults ages 15 to 24 years in the U.S.
According to data collected by the Centers for Disease Control and Prevention (CDC), one in five teenagers in
the U.S. has seriously considered suicide annually. In 2019, there were 26 suicide deaths in Florida among
youth ages 10 to 14 years (2.2 per 100,000 population) and 102 among youth ages 15 to 19 years (8.5 per
100,000 population). 6    5F

Addressing these risks in adolescence requires the use of frameworks that connect environmental history with
current context and future planning. Adverse Childhood Experiences (ACEs) and Positive Youth Development
are two approaches that can support adolescent health.

6Florida Department of Health. (2021, October 6). Retrieved from FLHealthCHARTS.com: Death Data Viewer - Florida Health CHARTS - Florida
Department of Health (flhealthcharts.com)
                                                                                                                                           6
Mental Wellbeing and Substance Abuse
Prevention
Exhibit 5: The Pair of ACEs Tree
Source: Ellis, W., Dietz, W. (2017) A New Framework for Addressing Adverse Childhood and Community Experiences: Building Community
Resilience (BCR) Model. Academic Pediatrics. 17 (2017) pp. S86-S93. DOI information: 10.1016/j.acap.2016.12.011
ACEs are potentially traumatic events that occur in childhood (ages 0-17) and can include aspects of the child’s
environment that can undermine their sense of safety, stability and bonding, such as growing up in a
household with substance use problems, mental health problems or instability due to parental separation or
household members being in jail or prison. 7 ACEs can have a tremendous impact on future violence,
6F
victimization and perpetration, as well as lifelong health and opportunity. ACEs are linked to chronic health
problems, mental illness and substance use problems in adulthood. They can impact education, job
opportunities and earning potential. However, ACEs and their associated harms are preventable.3 Working to
prevent ACEs while understanding their impact on behavior is one way to improve adolescent health
outcomes.
Positive Youth Development (PYD) is an intentional, prosocial approach that engages youth within their
communities, schools, organizations, peer groups and families in a manner that is productive and constructive;
recognizes, utilizes and enhances young people’s strengths; and promotes positive outcomes for young people
by providing opportunities, fostering positive relationships and furnishing the support needed to build on their
leadership strengths. PYD offers a framework to move youth from risk behaviors to healthy behaviors by
focusing on their strengths and future goals.
7Centers for Disease Control and Prevention. (2021, October 6). Preventing Adverse Childhood Experiences. Retrieved from Violence Prevention:
https://www.cdc.gov/violenceprevention/aces/fastfact.html
7Mental Wellbeing and Substance Abuse
Prevention
Mental Health Issues
As shown in Exhibit 6, in 2019 the percentage of adults in Florida who reported their mental health was not
good on 14 or more of the past 30 days was 13.8. This is the same as the U.S. percentage in 2019.
Exhibit 6: Frequent Mental Distress (Percentage of Adults who Reported their Mental Health was
Not Good 14 or More Days in the Past 30 Days), Florida, United States
16
14
12
10
Percentage
8
6
4
2
0
2013 2014 2015 2016 2017 2018 2019
Florida 12.7 12.3 13.0 11.4 12.5 12.8 13.8
United States 11.3 11.0 11.2 11.7 12.0 12.4 13.8
Source: CDC Behavioral Risk Factor Surveillance System
Among Florida counties (Exhibit 7), the county with the lowest percentage of adults who reported poor mental
health on 14 or more of the past 30 days was Collier County at 7.1. Washington County had the highest
percentage at 18.4.
Exhibit 7: Adults Who Had Poor Mental Health on 14 or More of the Past 30 Days, Florida, 2019
Source: Florida Behavioral Risk Factor Surveillance System
8Mental Wellbeing and Substance Abuse
Prevention
Tobacco Use
In 2019, the percentage of adults who are current smokers was 14.8 in Florida and non-Hispanic Whites have
the highest percentage of adult current smokers (Exhibit 8).
Exhibit 8: Adults Who are Current Smokers, Percentage by Race and Ethnicity, Florida, 2012-2019
25
20
15
Percentage
10
5
0
2012 2013 2014 2015 2016 2017 2018 2019
Overall 17.7 16.8 17.6 15.8 15.5 16.1 14.5 14.8
Non-Hispanic White 19.6 18.6 18.9 17.4 17.8 17.7 15.9 16.4
Non-Hispanic Black 15.6 14.4 15.4 14 12.4 14.6 11.5 12.4
Hispanic 13.3 13.9 15.3 13 11.7 13.2 12.6 12.6
Source: Florida Behavioral Risk Factor Surveillance System
The percentage of adults who are current smokers ranges from 11 in Palm Beach County to a high of 32.4 in
Union County (Exhibit 9).
Exhibit 9: Percentage of Adults Who Are Current Smokers, Florida, 2019
Source: Florida Behavioral Risk Factor Surveillance System
9Mental Wellbeing and Substance Abuse
Prevention
Alcohol Abuse
In 2019, the median percentage of adults, among all states and the District of Columbia (DC), who were binge
drinkers was 16.8 percent compared to 15.8 percent for Florida. The median percentage of adults, among all
states and the DC, who were heavy drinkers was 6.5 percent compared to Florida at 7.6 percent. 8 7F
In Florida in 2019, the percentage of adults who engaged in heavy or binge drinking was 18 percent. Non-
Hispanic Whites had the highest percentage of heavy or binge drinking among adults in Florida in 2019 (Exhibit
10).
Exhibit 10: Adults Who Engage in Heavy or Binge Drinking,
Percentage by Race and Ethnicity, Florida, 2013-2019
25
20
Percentage
15
10
5
0
2013 2014 2015 2016 2017 2018 2019
Overall 17.6 17.0 17.4 17.5 17.1 18.2 18.0
Non-Hispanic White 17.6 19.0 18.7 19.6 18.6 20.0 19.8
Non-Hispanic Black 14.0 10.1 13.5 12.3 11.9 12.8 14.3
Hispanic 19.6 16.4 16.3 16.1 18.1 17.7 17.1
Source: Florida Behavioral Risk Factor Surveillance System
Among Florida counties (Exhibit 11), the percentage of adults who engaged in heavy or binge drinking in 2019
ranged from 10.6 in Gadsden County to 26.4 in Monroe County.
8BRFSS Prevalence & Trends Data. Centers for Disease Control and Prevention. Retrieved October 8, 2021 from CDC BRFSS Prevalence & Trends
Data: Heavy Drinking
10Mental Wellbeing and Substance Abuse
Prevention
Exhibit 11: Percentage of Adults who Engage in Heavy or Binge Drinking, Florida, 2019
Source: Florida Behavioral Risk Factor Surveillance System
Substance Use Disorder (including Opioid Use)
In the U.S., the age-adjusted death rate of drug overdoses rose from 20.7 per 100,000 in 2018 to 21.6 per
100,000 in 2019. 9 From 2015 to 2019, Florida drug overdose deaths have increased from 16.6 per 100,000
8F
population to 27.1 per 100,000 population (Exhibit 12) and opioids are a large contributor. Non-Hispanic
Whites are experiencing higher rates of opioid and drug overdose deaths than Hispanic and non-Hispanic
Black populations.
Exhibit 12: Opioid and Drug Overdose, Age-Adjusted Death Rate per 100,000 Population, Florida, 2015-2019
30
Rate per 100,00 Population
20
10
0
2015 2016 2017 2018 2019
Opioid Overdose 13.1 20.3 21.9 18.7 21.4
Drug Overdose 16.6 25.0 27.2 24.5 27.1
Source: Florida Department of Law Enforcement
9Drug Overdose Deaths in the United States, 1999-2019. Centers for Disease Control and Prevention. Retrieved October 8, 2021 from
https://www.cdc.gov/nchs/products/databriefs/db394.htm.
11Chronic Diseases and Conditions
Overview
Chronic diseases are defined broadly as conditions that last one year or more and require ongoing medical
attention or limit activities of daily living or both.1
Chronic diseases such as heart disease, stroke, cancer and diabetes are the leading causes of death
and disability in the U.S. They are also leading drivers of the nation’s $3.8 trillion in annual health care costs.
Treating people with chronic diseases accounts for 86 cents of every dollar spent on health care. 1
Six in ten U.S. adults have a chronic disease and four in ten U.S. adults have two or more. Many chronic
diseases are caused by modifiable behaviors including lack of physical activity, poor nutrition, and tobacco and
alcohol use.1
The top three leading causes of death in Florida in 2019 were all chronic diseases: heart disease, cancer and
stroke (Exhibit 1). They affect people of all ages, races, socioeconomic statuses and ethnicities. Additionally,
the percentage of children with chronic health conditions has risen dramatically.
Exhibit 1: Percent of Deaths Due to Top 7 Causes of Death and All Other Causes, Florida, 2019
Heart Disease (47,044)
23%
Cancer (45,562)
30%
Stroke (13,868)
Unintentional Injury (13,213)
Chronic Lower Respiratory Disease
(12,005)
3% Diabetes (6,158)
3% 22% Alzheimer's Disease (6,531)
6% All Other Causes (62,594)
6% 7%
Source: Florida Department of Health, Florida Bureau of Vital Statistics, 2019
1About Chronic Diseases. (April 28, 2021). Centers for Disease Control and Prevention. Retrieved October 5, 2021 from
https://www.cdc.gov/chronicdisease/about/index.htm
12Chronic Diseases and Conditions
Heart Disease
Coronary heart disease is the most common type of heart disease, killing 360,900 people in the U.S. in 2019.2
Coronary heart disease can result in pain, disability, lower quality of life and premature death. Hospitalization
due to coronary heart disease leads to lost productivity and high medical costs. In 2019, the age-adjusted
hospitalization rate from coronary heart disease in Florida was 274.1 per 100,000. Among Florida counties in
2019, the age-hospitalization rates ranged from 91.25 per 100,000 population in Holmes County to 682.17 per
100,000 population in Okeechobee County (Exhibit 2).
Exhibit 2: Age-adjusted Hospitalizations from Coronary Heart Disease,
Rate per 100,000 Population, 2019
Source: Florida Agency for Health Care Administration (AHCA)
Cancer
Each year in the U.S, more than 1.6 million people are diagnosed with cancer, and nearly 600,000 die from it,
making it the second leading cause of death3 In 2018, the age-adjusted rate of new cases in Florida (cancer
incidence) was 454.3 per 100,000 population. From 2010 to 2018, non-Hispanics had a higher cancer incidence
rate per 100,000 population compared to Hispanics. Whites also consistently had higher rates of cancer than
Blacks from 2010 through 2018.
2 Heart Disease Facts. (September 27, 2021). Centers for Disease Control and Prevention. Retrieved October 8, 2021 from Heart Disease Facts |
cdc.gov
3 Cancer. (December 16, 2020). Centers for Disease Control and Prevention. Retrieved October 8, 2021 from Cancer | CDC
13Chronic Diseases and Conditions
Exhibit 3: Cancer Incidence, Age-Adjusted Rate per 100,000 Population, Florida, 2010-2018
600
Rate per 100,000 Population
500
400
300
200
100
0
2010 2011 2012 2013 2014 2015 2016 2017 2018
Overall 426.0 433.1 426.2 427.2 427.2 420.3 436.6 441.9 454.3
White 429.1 441.1 431.1 430.6 425.5 422.3 432.8 439.2 452.7
Black 412.5 437.0 410.6 406.1 398.5 395.4 403.2 391.3 396.4
Non-Hispanic 448.6 457.9 448.5 447.7 447.9 444.3 462.1 469.7 484.1
Hispanic 318.1 349.8 329.9 336.6 318.8 316.2 328.8 327.1 337.3
Source: Florida Cancer Data System
Stroke
In 2019, stroke was the 5th leading cause of death in the U.S. and was the 3rd in Florida. Stroke can cause
lasting brain damage or long-term disability prior to death. Choosing a healthy diet, maintaining a healthy
weight and being physical active are ways to prevent stroke and hospitalization due to stroke.4 In Florida, the
age-adjusted rate of hospitalizations due to stroke in 2019 was 236.9 per 100,000. As seen in Exhibit 4, the
rate of hospitalizations due to stroke for Blacks has been more than 1.7 times that of Whites.
Exhibit 4: Hospitalizations from Stroke, Age-Adjusted Rate per 100,000 Population, Florida, 2010-2019
450
Rate per 100,000 Population
400
350
300
250
200
150
100
50
0
2010 2011 2012 2013 2014 2015 2016 2017 2018 2019
Overall 267.7 268.4 266.6 256.0 250.8 244.0 228.8 231.6 231.2 236.9
White 235.1 234.6 230.8 219.3 220.7 214.3 199.9 200.6 198.5 201.4
Black 408.2 422.8 409.1 401.9 386.7 377.8 359.5 372.0 369.4 389.9
Non-Hispanic 249.4 264.0 300.6 265.0 247.6 247.0 259.9 275.7 313.3 279.0
Hispanic 220.2 236.3 234.5 236.4 213.2 210.2 190.1 185.3 185.9 188.2
Source: Florida Agency for Health Care Administration (AHCA)
4Preventing Stroke: Healthy Living. (August 2, 2021). Centers for Disease Control and Prevention. Retrieved October 8, 2021 from Preventing
Stroke: Healthy Living Habits | cdc.gov
14Transmissible and Emerging Diseases
Overview
Communicable diseases are also known as infectious diseases or transmissible diseases. Infectious diseases are
illnesses caused by germs or microorganisms such as bacteria, viruses and fungi that enter the body, multiply
and can cause an infection and disease. Some infectious diseases are contagious or what is termed
communicable, meaning transmitted directly from one person to another either by touch or through the
exchange of bodily fluids. Other infectious diseases can be transmitted through air, water, food, soil or even
spread by vectors like biting insects or animals.
HIV and AIDS: Nationally, there are approximately 1.2 million people in the U.S. with HIV1 and 117,477 with HIV
in Florida.2 Additionally, it is estimated 13 percent of persons in the U.S. are living with HIV that is currently
undiagnosed. From 2010 to 2019, Florida’s HIV and AIDS diagnoses decreased; however, non-Hispanic Blacks
continue to be disproportionately impacted. In 2019, non-Hispanic Blacks had an HIV diagnosis rate of 53.2 per
100,000 compared to 29.2 for Hispanics and 9.6 for non-Hispanic Whites (Exhibit 1), and a rate of 27.9 per
100,000 compared to 8.4 and 3.9 respectively for those diagnosed with AIDS. Across the U.S. the highest rates
of new HIV diagnoses come from the south. The rate in Florida was 23.7 per 100,000 population compared to a
national rate of 13.2 per 100,000 population.3
Exhibit 1: HIV Diagnoses, Rate Per 100,000 Population, Florida, 2010–2019
90
80
Rate per 100,000 Population
70
60
50
40
30
20
10
0
2010 2011 2012 2013 2014 2015 2016 2017 2018 2019
Overall 25 24.6 23.4 22.5 23.3 23.6 23.7 23.1 22.6 21.4
Non-Hispanic White 10.9 11.7 11.2 10.1 10.7 10.2 10 10.3 10.2 9.6
Non-Hispanic Black 81.4 76.1 71.5 66.1 65.3 64.7 64.5 62.3 57.8 52.9
Hispanic 25.3 24.8 24 25.6 27.8 30.1 30.9 28.9 29.5 28.9
Source: Florida Department of Health, Bureau of Communicable Diseases
1HIV Fast Facts. Retrieved October 7, 2021 from HIV Statistics | hiv.gov
2 HIV Data Center. Florida Department of Health. Retrieved October 7, 2021 from HIV Data Center | Florida Department of Health (flhealth.gov)
3 Diagnoses of HIV Infection, CDC 2019. Retrieved October 7, 2021 from CDC HIV Surveillance | Diagnoses of HIV Infection
15Transmissible and Emerging Diseases
Sexually Transmitted Diseases/Infections
Chlamydia: Between 2015 and 2019, the average chlamydia case rate per 100,000 was approximately 489 for
Florida and approximately 517 for the U.S. From 2010 to 2019, Florida’s chlamydia rate increased with non-
Hispanic Blacks bearing the greatest burden and the highest rates of chlamydia diagnoses.
Gonorrhea: In 2019, a total of 616,392 cases of gonorrhea were reported to the CDC, making it the second most
common notifiable condition in the U.S. for that year. Non-Hispanic Blacks have the highest rate of gonorrhea
in Florida.
Syphilis: From 2010 to 2019, the rate of early syphilis in Florida increased from 13.2 to 34.8 per 100,000. Non-
Hispanic Blacks have the highest rate of early syphilis and approximately 60 percent to 70 percent of early
syphilis cases are reported in men who have sex with men.
Immunizations
Children under 5 are especially susceptible to disease because their immune systems have not built up the
necessary defenses to fight infection. From 2010 to 2019, the percentage of two-year-old children who were
fully immunized fluctuated. The percentages ranged from 81.1 in 2010 to 83.5 in 2019 with the highest
percentage of 86.7 occurring in 2013.
Pertussis: The highest incidence rate of pertussis is in infants less than 1 year old. Infants less than 2 months old
are unable to be vaccinated, signifying the importance of vaccination in pregnant women and family members.
Nationally, 18,617 pertussis cases were reported to the CDC. From 2010 to 2019, Florida’s pertussis rate peaked
in 2013 at 3.8, then declined in 2015 to 1.7 and has shown little to no fluctuation since then (Exhibit 2). Cases
reported between 2010-2019 were mainly White (79%), followed by Black (11%) and unknown (10%).
Exhibit 2: Pertussis, Rate per 100,000 Population, Florida, 2010-2019
4
Rate per 100,000 Population
3
2
1
0
2010 2011 2012 2013 2014 2015 2016 2017 2018 2019
Overall 1.7 1.6 3.0 3.8 3.7 1.7 1.7 1.7 1.6 1.8
Source: Florida Department of Health, Merlin
16Transmissible and Emerging Diseases
Emerging Infectious Diseases
Hepatitis: From 2010 to 2019, Florida’s rate of hepatitis A cases increased, with a spike occurring in 2019. In
2019, Florida’s hepatitis A rate was 15.9 per 100,000 (Exhibit 3). From 2010 to 2019, the acute hepatitis B rate
also increased. The rate of acute hepatitis B in Florida is more than three times the national rate (3.6 vs 1.0 per
100,000 population).4 Non-Hispanic Whites had the highest rate of acute hepatitis B infection. From 2010 to
2019, the viral hepatitis age-adjusted death rate decreased, and non-Hispanic Whites had the highest viral
hepatitis age-adjusted death rate. As treatment for hepatitis C has become more widely available, annual deaths
in Florida decreased by 19 percent from 2015 to 2019.
Exhibit 3: Hepatitis A Cases, Rate per 100,000 Population, Florida, 2010-2019
Source: Florida Department of Health, Bureau of Communicable Diseases
Tuberculosis: Tuberculosis (TB) is caused by a bacterium called Mycobacterium tuberculosis. After decades of
decline in TB morbidity, Florida experienced an unprecedented single year decrease of 26 percent in the number
of TB cases reported in 2020, reporting both a historically low case count and case rate. From 2010 to 2020, the
trend in tuberculosis (TB) rates has decreased from 4.4 to 1.9 (Exhibit 4) and for the second consecutive year,
Florida’s TB case rate was lower than the national case rate (1.9 versus 2.2 per 100,00 population).5
4 Viral Hepatitis Surveillance. CDC. Retrieved October 7, 2021 from Viral Hepatitis Surveillance Hepatitis B | CDC.gov
5 TB Data and Statistics. CDC 2019. Retrieved October 7, 2021 from TB Statistics | CDC.gov
17Transmissible and Emerging Diseases
Exhibit 4: Tuberculosis, Rate per 100,000 Population, Florida, 2010-2020
Source: Florida Department of Health, Bureau of Communicable Diseases
18Injury, Safety and Violence
Overview
Injury is defined as physical harm or damage to someone’s body. Whether intentional or unintentional,
injuries can be predicted and prevented. Unintentional injuries include those that result from motor vehicle
collisions (including those that involve pedestrians and bicyclists), drownings, falls, firearms and recreational
and sports-related activities. Intentional injuries result from interpersonal or self-inflicted violence, and
include homicides, assaults, suicide and suicide attempts, adverse childhood experiences (including child
sexual abuse and neglect), intimate partner violence, elder abuse and sexual assault.1
Unintentional Injury: Nationally in 2019, 173,040 persons died from unintentional injuries.2 In 2018 and 2019,
unintentional injury was the 3rd leading cause of death in the U.S. and the 4th leading cause of death in Florida.
Drug poisoning is the leading mechanism of unintentional injury death, followed by falls and motor vehicle
traffic crashes.
Exhibit 1: Unintentional Injury Deaths, Age-Adjusted Death Rate Per 100,000 Population, 2019
Source: Florida Department of Health, Bureau of Vital Statistics
1 Injury Prevention. (March 11, 2021). Florida Department of Health. Retrieved October 5, 2021 from Injury Prevention | Florida Department of
Health (floridahealth.gov)
2 Accidents or Unintentional Injuries. (April 9, 2021). Centers for Disease Control and Prevention. Retrieved October 5, 2021 from FastStats -
Accidents or Unintentional Injuries (cdc.gov)
19Injury, Safety and Violence
Motor Vehicle Crashes: In 2019, the motor vehicle crash age-adjusted death rate for Florida (14.7 per 100,000
population) was 28 percent higher compared to the U.S. (11.5 per 100,000 population). From 2010 to 2019,
the age-adjusted motor vehicle death rate increased in Florida (Exhibit 2).3
Exhibit 2: Motor Vehicle Crash Age-Adjusted Death Rate per 100,000 Population, Florida, 2010-2019
20.0
Rate per 100,000
15.0
Population
10.0
5.0
0.0
2010 2011 2012 2013 2014 2015 2016 2017 2018 2019
Overall 12.5 12.4 12.0 12.0 12.3 14.3 15.4 14.8 14.7 14.7
White 13.0 12.9 12.4 12.5 12.7 14.4 15.8 15.1 14.5 15.1
Black 12.3 12.5 11.8 11.5 11.6 15.0 15.5 15.1 16.7 15.3
Hispanic 11.0 10.6 9.7 10.1 10.7 12.9 13.4 13.0 12.0 12.8
Non-Hispanic 12.8 12.9 12.6 12.6 12.7 14.5 15.8 15.3 15.6 15.2
Source: Florida Department of Health, Florida Bureau of Vital Statistics, 2019
Suicide: In 2019, 12 million American adults seriously thought about suicide, 3.5 million planned a suicide
attempt, and 1.4 million attempted suicide. Suicide rates increased 33 percent between 1999 and 2019, with a
small decline in 2019. Suicide is the 10th leading cause of death in the U.S. Suicide was the 8th leading cause of
death in Florida in 2019, with an age-adjusted rate of 14.5 per 100,000 population. Non-Hispanic Whites have
the highest age-adjusted rate of suicide (20.2 per 100,000) and non-Hispanic Blacks have the lowest (5.9 per
100,000). In 2019, the U.S. age-adjusted death rate from suicide was 13.9 per 100,000.
Exhibit 3: Suicide, Age-Adjusted Death Rate per 100,000 Population, Florida, 2010-2019
25
Rate per 100,000
20
Population
15
10
5
0
2010 2011 2012 2013 2014 2015 2016 2017 2018 2019
Overall 13.5 13.5 14.1 13.8 13.8 14.4 14.1 14.1 15.3 14.5
Non-Hispanic White 18.6 18.3 18.9 18.8 18.7 20.1 19.4 19.6 21.3 20.2
Non-Hispanic Black 4 4.7 5.6 4.9 4.6 4.7 5.1 5.1 5.7 5.9
Hispanic 6.8 7.4 7.4 6.9 7.9 8.1 7.3 7.3 8.8 7.7
Source: Florida Department of Health, Florida Bureau of Vital Statistics, 2019
3
Injury Prevention. (March 11, 2021). Florida Department of Health. Retrieved October 5, 2021 from Injury Prevention | Florida Department of
Health (floridahealth.gov)
20Injury, Safety and Violence
Exhibit 4: Suicide Deaths, Age-Adjusted Death Rate per 100,000 Population, Florida, 2019
Source: Florida Department of Health, Bureau of Vital Statistics
Sudden Unexpected Infant Death: When an infant under the age of one year dies suddenly and unexpectedly,
it is called Sudden Unexpected Infant Death (SUID). Some of these deaths may be caused by suffocation,
asphyxia, infection, metabolic diseases, heart problems, injuries (accidental or non-accidental) or other
reasons. In some cases, the death is considered to be from an undetermined cause such as sudden infant
death syndrome (SIDS). Each year in the U.S., more than 4,500 infants die suddenly of no immediately obvious
cause. In 2019, the SUID rate nationally and in Florida was 0.9 deaths per 1,000 live births.
21Injury, Safety and Violence
Exhibit 5: Deaths from Sudden Infant Death Syndrome, Rate per 1,000 Live Births, Florida, 2010-2019
0.7
0.6
Rate per 1,000 Live Births
0.5
0.4
0.3
0.2
0.1
0.0
2010 2011 2012 2013 2014 2015 2016 2017 2018 2019
Overall 0.3 0.2 0.3 0.2 0.3 0.3 0.3 0.3 0.3 0.3
Non-Hispanic White 0.3 0.2 0.2 0.2 0.2 0.2 0.2 0.2 0.2 0.2
Non-Hispanic Black 0.5 0.4 0.5 0.5 0.5 0.4 0.5 0.5 0.6 0.5
Hispanic 0.2 0.1 0.1 0.1 0.1 0.1 0.2 0.2 0.2 0.1
Source: Florida Department of Health, Florida Bureau of Vital Statistics, 2019
Violent Crimes: From 2010 to 2019, the rates of violent crime and domestic violence offenses decreased;
however, forcible sex offenses increased while murder remained relatively stable. In the U.S., individuals ages
12 years and older who were of Other race, people with an annual household income less than $25,000 and
individuals ages 12-24 years had the highest rates of being a victim of a violent crime (excluding homicide). In
Florida, 81,092 violent crimes were reported in 2019.4
Exhibit 6: Violent Crimes, Rate per 100,000 Population, Florida, 2019
Source: Florida Department of Law Enforcement
4 Florida Department of Law Enforcement. Retrieved October 5, 2021 from CJAB Home (state.fl.us)
22Injury, Safety and Violence
Human Trafficking: Human trafficking involves the use of force, fraud or coercion to obtain some type of labor
or commercial sex act. Every year, millions of men, women, and children are trafficked worldwide. Nationally,
there were 11,500 cases of human trafficking reported to the National Human Trafficking Hotline. In Florida,
there were 896 cases reported in 2019 and the number of human trafficking cases increased more than 16
percent from 2018 to 2019 (Exhibit 7).5 Based on the number of cases reported from the National Human
Trafficking hotline data, Florida ranked 3rd after California and Texas in 2019.
Exhibit 7: Total National Human Trafficking Hotline Cases, Florida, 2018-2019
1000
800
600
Count
400
200
0
2018 2019
Total 767 896
Source: National Human Trafficking Hotline, 2019
Adverse Childhood Experiences (ACEs): ACEs include experiencing abuse and/or neglect (emotional
abuse/neglect, physical abuse/neglect, sexual abuse) or household challenges (intimate partner violence,
substance abuse in the household, mental illness in the household, parental separation or divorce,
incarcerated household member) in the first 18 years of life. In 2019, one out of five Florida adults (20.1%) had
four or more adverse childhood experiences.6
Exhibit 8: Adults Who Experienced 4 or More Adverse Childhood Experiences,
Percentage by Race and Ethnicity, Florida, 2019
25
20
Percentage
15
10
5
0
Overall Non-Hispanic White Non-Hispanic Black Hispanic
Overall 20.1 20.5 20.9 18.5
Source: Florida Behavioral Risk Factor Surveillance System (BRFSS) Adverse Childhood Experiences (ACE) Report.
5National Human Trafficking Hotline Webpage. Retrieved October 5, 2021 from Florida | National Human Trafficking Hotline
6Florida Behavioral Risk Factor Surveillance System (BRFSS) Adverse Childhood Experiences (ACE) Report. Retrieved October 5, 2021 from
Behavioral Risk Factor Surveillance System (BRFSS) | Florida Department of Health (floridahealth.gov)
23Maternal and Child Health
Overview
The health and well-being of women and children is essential to creating a healthier world. Despite great
progress, there are still too many mothers and children dying—mostly from preventable causes. Every day,
approximately 800 women die from avertible causes related to pregnancy and childbirth.1
Maternal Morbidity and Mortality
Maternal mortality is defined as the death of a woman while pregnant or within 42 days of termination of
pregnancy, irrespective of the duration and site of the pregnancy, from any cause related to or aggravated by
the pregnancy or its management but not from accidental or incidental causes. Nationally, the maternal death
rate in 2019 was 20.1 per 100,000 live births.2 In 2019, there were 63 maternal deaths in Florida (28.6 per
100,000 live births). From 2010 to 2019, the overall rate of maternal deaths increased in Florida. Non-Hispanic
Blacks have consistently had the highest rate of maternal deaths (Exhibit 1).
Exhibit 1: Maternal Deaths, Rate per 100,000 Live Births by Race and Ethnicity, Florida, 2010-2019
60
Rate per 100,000 Live Births
50
40
30
20
10
0
2010 2011 2012 2013 2014 2015 2016 2017 2018 2019
Overall 20.5 22.0 20.2 29.7 21.4 21.4 16.9 16.5 18.1 28.6
Non-Hispanic White 15.7 16.8 19 21.8 18.3 25 18.4 14.9 16.2 31.9
Non-Hispanic Black 39.6 52.5 41.9 42.1 44 29.3 23 31.1 25.6 43.2
Hispanic 11.7 6.8 5.2 33.9 9.7 7.8 9.2 10.5 16.6 13.3
Source: Florida Department of Health, Florida Bureau of Vital Statistics, 2019
1 Maternal and Child Health. (March 5, 2014). Centers for Disease Control and Prevention. Retrieved October 5, 2021 from CDC Global Health -
Maternal and Child Health
2 Maternal Mortality Rates in the United States, 2019. (March 23, 2021). Centers for Disease Control and Prevention. Retrieved October 5, 2021
from https://www.cdc.gov/nchs/data/hestat/maternal-mortality-2021/maternal-mortality-2021.htm
24Maternal and Child Health
Congenital Syphilis
From 2015-2019, the national congenital syphilis rate increased 291 percent to 48.5 cases per 100,000 live
births in 2019.4 From 2010 to 2019, Florida’s congenital syphilis rate also increased from 11.6 to 65.9 per
100,000 (Exhibit 2). Non-Hispanic Blacks have the highest rate of congenital syphilis.
Exhibit 2: Congenital Syphilis Cases, Rate per 100,000 Population by Race and Ethnicity,
Florida, 2010-2019
160
Rate per 100,000 Resident Births
140
120
100
80
60
40
20
0
2010 2011 2012 2013 2014 2015 2016 2017 2018 2019
Overall 11.6 15.4 18.2 16.1 21.7 17.7 26.9 43.5 48.9 65.9
Non-Hispanic White 6.2 2.1 5.2 6.2 6.1 8.0 10.2 17.9 16.1 37.2
Non-Hispanic Black 24.7 51.9 60.0 37.5 66.3 45.5 82.5 114.9 126.8 140.9
Hispanic 8.3 8.5 5.2 15.1 8.0 9.3 12.2 28.3 33.1 41.1
Source: Florida Department of Health, Bureau of Vital Statistics
Infant Mortality
Infant mortality is defined as the death of a live-born baby during the first year of life. The rate is the number
of infant deaths per 1,000 live births. In 2019, the infant death rate was 5.6 per 1,000 live births in the U.S. and
6.0 per 1,000 live births in Florida. Though there was a decrease in the infant death rate from 2010 to 2019,
non-Hispanic Blacks continued to have the highest rate of infant deaths (Exhibit 3).
Exhibit 3: Infant Deaths, Rate per 1,000 Live Births by Race and Ethnicity, Florida, 2010-2019
12
Rate per 1,000 Live
9
Births
6
3
0
2010 2011 2012 2013 2014 2015 2016 2017 2018 2019
Overall 6.5 6.4 6 6.1 6 6.2 6.1 6.1 6 6
Non-Hispanic White 4.9 4.5 4.4 4.9 4.1 4.2 4 4.1 4.1 4.3
Non-Hispanic Black 11.5 11.6 10.3 10.3 10.6 10.6 10.9 10.1 10.7 10.2
Hispanic 5.1 5.2 5.1 4.4 4.9 4.8 5.4 5.2 5.2 4.9
Source: Florida Department of Health, Florida Bureau of Vital Statistics, 2019
25Maternal and Child Health
The infant mortality rate varied by county (Exhibit 4). In 2019, the county with the highest rate was Union
County, with an infant mortality rate of 19.6 per 1,000 live births. Five counties (Dixie, Gulf, Hamilton,
Jefferson and Lafayette) tied for the lowest infant mortality rate in 2019 with zero infant deaths and a rate of
zero per 1,000 live births.
Exhibit 4: Infant Mortality, Rate Per 1,000 Live Births, Florida, 2019
Source: Florida Department of Health, Florida Bureau of Vital Statistics, 2019
26Maternal and Child Health
Inter-Pregnancy Intervals: Short inter-pregnancy intervals are associated with adverse birth outcomes, such as
preterm births. Women who have an inter-pregnancy interval of less than 18 months are more likely to have
premature babies with low birth weight. From 2010 to 2019, the percentage of births with inter-pregnancy
interval less than 18 months in Florida decreased slightly, from 36.9 to 34.9. Non-Hispanic Whites have the
highest rate of births with inter-pregnancy interval less than 18 months, at 38.3 percent (Exhibit 5).
Exhibit 5: Births with Inter-pregnancy Interval Less than 18
Months, Percentage by Race and Ethnicity, Florida, 2010 - 2019
50
40
Percentage
30
20
10
0
2010 2011 2012 2013 2014 2015 2016 2017 2018 2019
Overall 36.9 35.7 35.3 34.3 34.6 34.3 34.8 34.8 34.5 34.9
Non-Hispanic White 39.9 38.7 38.4 37.6 37.8 38.1 38.2 38.6 38.1 38.3
Non-Hispanic Black 38.7 37.1 36.4 35.0 35.2 34.5 35.0 34.7 34.2 36.2
Hispanic 31.1 30.6 30.2 28.8 29.0 28.6 30.0 29.9 29.9 29.5
Source: Florida Department of Health, Bureau of Vital Statistics
27Social and Economic Conditions Impacting Health
Overview
Social and Economic Conditions Impacting Health (social determinants of health) are the conditions in the
environments where people are born, live, learn, work, play, worship and age that affect a wide range of
health, functioning and quality-of-life outcomes and risks.1
Social determinants of health have a major impact on people’s health, well-being and quality of life. Examples
include:
• Safe housing, transportation and neighborhoods
• Racism, discrimination and violence
• Education, job opportunities and income
• Access to nutritious foods and physical activity opportunities
• Air and water quality
• Language and literacy skills
Healthy People 2030 groups the social determinants of health into five (5) domains:
Economic stability is the connection between the financial resources people have – income, cost of living and
socioeconomic status – and their health. Key issues within economic stability include poverty, employment,
food security and housing stability.
1 Social Determinants of Health. Healthy People 2030. Retrieved October 5, 2021 from https://health.gov/healthypeople/objectives-and-
data/social-determinants-health
28Social and Economic Conditions Impacting Health
From 2010 to 2019, the trend in households receiving cash public assistance or Supplemental Nutrition
Assistance increased. In 2019, the percentage of households receiving cash public assistance or food stamps
was 12.4 in the U.S. and 14.1 in Florida (Exhibit 1).
Exhibit 1: Percentage of Households Receiving Cash Public Assistance or Supplemental Nutrition Assistance,
2019
15
Percentage
10
5
0
Florida U.S.
Source: U.S. Bureau of the Census, American Community Survey 5-Year Estimates, Table B19058.
The Federal Poverty Level (FPL) is a measure of income issued every year by the Department of Health and
Human Services and is used to determine eligibility for certain programs and benefits, including savings on
Marketplace health insurance, and Medicaid and CHIP coverage.2 From 2010 to 2019, the trend in families and
individuals below the FPL in Florida remained relatively stable. In 2019, approximately 1 in 10 families in
Florida (10 percent) and 14 percent of individuals were below the FPL. From 2010 to 2019, the median
household income in Florida increased 16.8 percent from $47,661 in 2010 to $55,660 in 2019. Blacks had the
highest percentage of individuals and families below the FPL and the lowest median household income. In
2019, the U.S. median household income (in 2019 inflation-adjusted dollars) was $62,843 with 9.5 percent of
U.S. families and 13.4 percent of individuals below poverty level (Exhibit 2).
Exhibit 2: Percentage of Families and Individuals Below Federal Poverty Level (FPL), 2019
15
Percentage
10
5
0
Families Below FPL Individuals Below FPL
Florida U.S.
Source U.S. Bureau of the Census, American Community Survey 5-Year Estimates, Tables S1901, S1702 and S1701.
2Federal Poverty Level. U.S. Centers for Medicare & Medicaid Services. Retrieved October 5, 2021 from
https://www.healthcare.gov/glossary/federal-poverty-level-fpl/
29Social and Economic Conditions Impacting Health
Education access and quality looks at the connection between education, health and well-being. Key issues
within education include graduating from high school, enrollment in higher education, educational attainment
in general, language and literacy and early childhood education and development.3
In 2019, the U.S. percentage of individuals 25 years and older with no high school diploma was 12 compared
to Florida at 11.8. In Florida, Hispanics had the highest percentage of individuals 25 years and older with no
high school diploma (20.6 percent) (Exhibit 3). The high school graduation rate in Florida has increased 20.8
percent, from 74.5 percent in 2011-12 to 90 percent in 2019-20. In 2019, the high school graduation rate in
Florida was 91.7 percent among White students and 86.6 percent among Black students. This gap has
decreased over time.
Exhibit 3: Individuals 25 Years and Over with No High School Diploma,
Percentage by Race and Ethnicity, Florida, 2010-2019
30
Percentage
20
10
0
2010 2011 2012 2013 2014 2015 2016 2017 2018 2019
Overall 14.7 14.5 14.2 13.9 13.5 13.1 12.8 12.4 12.0 11.8
White 12.8 12.6 12.4 12.2 11.9 11.5 11.3 11.0 10.6 10.4
Black 22.5 21.9 21.4 20.7 20.0 19.3 18.8 18.0 17.5 16.8
Hispanic 26.1 25.8 25.2 24.6 23.8 23.0 22.4 21.6 20.9 20.6
Non-Hispanic 9.7 9.4 9.1 8.9 8.6 8.2 8.0 7.6 7.3 7.1
Source: U.S. Census Bureau, American Community Survey, Table C15002A, C15002B, C15002C, C15002D, C15002E, C15002F, C15002G, C15002H,
and C15002I
Health care access and quality pertains to how people’s access to and understanding of health services
impacts their health and are critical components of clinical care. Access to health care, access to primary care,
health insurance coverage and health literacy are key issues included in this domain. Adults who are able to
easily access affordable and quality health care can better prevent diseases and manage existing conditions,
which can lead to a better quality of life. Increasing access to affordable care is an important public health
goal.4
As seen in Exhibit 4, from 2013 to 2019 the percentage of adults with any type of health care insurance
increased slightly. Non-Hispanic Whites have the highest percentage of adults with any type of health care
insurance, while Hispanics have the lowest percentage.
3 Social Determinants of Health. Healthy People 2030. Retrieved October 5, 2021 from https://health.gov/healthypeople/objectives-and-
data/social-determinants-health
4 Access to Care - Annual. (n.d.) America's Health Rankings United Health Foundation. Retrieved October 5, 2021 from Explore Access to Care -
Annual in Florida | 2020 Annual Report | AHR (americashealthrankings.org)
30Social and Economic Conditions Impacting Health
Exhibit 4: Adults with Any Type of Health Care Insurance Coverage,
Percentage by Race and Ethnicity, Florida, 2013-2019
100
80
Percentage
60
40
20
0
2013 2014 2015 2016 2017 2018 2019
Overall 77.1 82.4 83.6 83.7 84.0 84.2 84.2
Non-Hispanic White 85.5 87.4 89.4 89.5 88.4 88.7 88.6
Non-Hispanic Black 69.2 79.0 76.1 81.0 80.2 83.6 81.4
Hispanic 64.0 71.3 74.1 71.1 75.9 74.7 76.1
Source: Florida Behavioral Risk Factor Surveillance System
The percentage of adults with health insurance varied by county (Exhibit 5) in 2019. The county with the
lowest percentage of health insurance coverage was DeSoto County with 68.6 percent of the adult population
reporting that they had any type of health insurance coverage. Sumter County had the highest percentage
with 90.5 percent of adults having health insurance coverage.
Exhibit 5: Percent of Adults with Any Type of Health Care Insurance, Florida, 2019
Source: Florida Behavioral Risk Factor Surveillance System
31Social and Economic Conditions Impacting Health
Oral health is a key to overall health. Research has shown poor health is linked to diabetes, heart and lung
disease, stroke and conditions of pregnant women, including the delivery of pre-term and low birth weight
infants and other illnesses. In 2020, the U.S. median percentage of adults who visited a dentist or dental clinic
in the past year was 66.7 percent compared to 61.2 percent in Florida.
Exhibit 6: Adults Who Visited a Dentist or a Dental Clinic in the Past Year,
Percentage by Race and Ethnicity, Florida, 2014-2020
80
60
Percentage
40
20
0
2014 2016 2018 2020
Overall 61.9 63.0 65.7 61.2
Non-Hispanic White 65.7 65.9 67.9 63.7
Non-Hispanic Black 56.0 57.5 61.4 59.9
Hispanic 55.8 58.7 63.1 56.9
Sources: Florida Behavioral Risk Factor Surveillance System (2014-2018); CDC Behavioral Risk Factor Surveillance System (2020)
Neighborhood and the built environment assesses where a person lives – housing, neighborhood and
environment – and its impact on their health and well-being. Quality of housing, access to transportation,
availability of healthy foods, air and water quality and neighborhood crime and violence are all issues within
this social determinant.5
Social and community context is the connection between characteristics of the context within which people
live, work and play and their health and wellbeing. Topics such as cohesion within the community, civic
participation, discrimination, conditions in the workplace and incarceration are key issues within this social
determinant.
Emergency preparedness and response centers on community and individual disaster resilience. Resilience is
the capacity of individuals, communities, businesses, institutions and governments to adapt to changing
conditions and to prepare for, withstand and rapidly recover from disruptions to everyday life, such as hazard
events. This determinant explores how individual and community vulnerability is connected to social,
economic and other factors, and the requirements of government to address the gaps in service delivery
before, during and immediately after a disaster.
5Social Determinants of Health. Healthy People 2030. Retrieved October 5, 2021 from https://health.gov/healthypeople/objectives-and-
data/social-determinants-health
32You can also read