HIGHLIGHTS Coronavirus Disease 2019 (COVID-19) Situation Report - WHO | World Health ...
←
→
Page content transcription
If your browser does not render page correctly, please read the page content below
Coronavirus Disease 2019 (COVID-19)                                                             World Health
                                                                                                Organization
Situation Report - 64
                                                                                                Indonesia

21 July 2021

          HIGHLIGHTS

     •     As of 21 July, the Government of Indonesia reported
           2 983 830 (33 772 new) confirmed cases of COVID-19,
           77 583 (1 383 new) deaths and 2 356 553 recovered cases
           from 510 districts across all 34 provinces. 1

     •     During the week of 12 to 18 July, 32 out of 34 provinces
           reported an increase in the number of cases while 17 of them
           experienced a worrying increase of 50% or more; 21
           provinces (8 new provinces added since the previous week)
           have now reported the Delta variant; and the test positivity
           proportion is over 20% in 33 out of 34 provinces despite their
           efforts in improving the testing rates. Indonesia is currently
           facing a very high transmission level, and it is indicative of the
           utmost importance of implementing stringent public health and
           social measures (PHSM), especially movement restrictions,
           throughout the country.

     Fig. 1. Geographic distribution of cumulative number of confirmed COVID-19 cases in Indonesia across
     the provinces reported from 15 to 21 July 2021. Source of data
     Disclaimer: The number of cases reported daily is not equivalent to the number of persons who contracted
     COVID-19 on that day; reporting of laboratory-confirmed results may take up to one week from the time of testing.

     1
         https://covid19.go.id/peta-sebaran-covid19
                                                                                                            1
     WHO Indonesia Situation Report - 64
     who.int/indonesia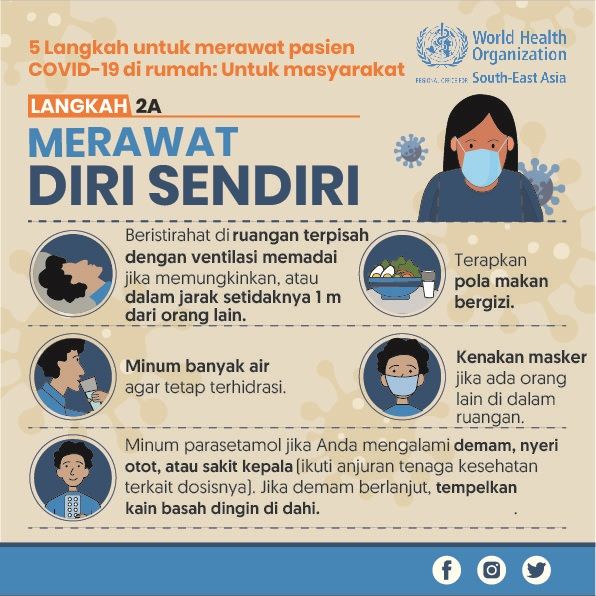
GENERAL UPDATES

    •   On 19 July, the Government of Indonesia reported 1338 new COVID-19 deaths
        nationwide; a record high since the beginning of the pandemic in the country. The
        National COVID-19 Task Force informed on the same day that the highest daily
        count of deaths was reported in East Java (359), followed by Central Java (278)
        and DKI Jakarta (250). 2

    •   The Head of the Federation of Indonesian Labour Unions (Federasi Serikat Buruh
        Persatuan Indonesia (FSBPI)) reported on 19 July that thousands of day workers
        in textile, garment, shoe and leather industries across Indonesia have contracted
        COVID-19 within a span of two weeks. This alarming number was mainly due to
        workers reporting to work even when they developed mild symptoms. Their main
        concern was the loss of daily wage as a result of self-isolation or quarantine.
        Urgent attention is needed to control COVID-19 transmission in these industries. 3

    •   On 18 July, the Deputy Head of the Indonesian Medical Association (Ikatan Dokter
        Indonesia (IDI)) reported that hospitals in Java and Bali continued to struggle with
        the surge of COVID-19 patients. IDI requested the government to extend the
        implementation of the emergency restrictions on public activities (Pemberlakuan
        Pembatasan Kegiatan Masyarakat (PPKM) Darurat) to curb the transmission and
        reduce the burden to the health system. In addition, IDI highlighted that
        implementation of emergency PPKM also needs to be expanded to other provinces
        experiencing the similar upward trend of COVID-19 cases4. IDI also reported that
        a total of 114 doctors have died due to COVID-19 between 1 and 17 July. With the
        continued increase in cases, IDI noted that the Indonesian health system may soon
        collapse if stringent measures are not urgently implemented. 5

2
  https://www.cnnindonesia.com/nasional/20210719170949-20-669677/kematian-covid-19-ri-pecah-rekor-jatim-
penyumbang-terbanyak
3
  https://www.cnbcindonesia.com/news/20210719154151-4-262064/pekerja-positif-covid-gentayangan-klaster-
pabrik-meledak
4
  https://nasional.kompas.com/read/2021/07/19/14070201/masih-terjadi-overload-pasien-di-rs-idi-minta-
pemerintah-perpanjang-ppkm?page=all
5
  https://www.reuters.com/business/healthcare-pharmaceuticals/indonesia-reports-record-number-doctor-
deaths-covid-19-july-2021-07-18/
                                                                                                           2
WHO Indonesia Situation Report - 64
who.int/indonesia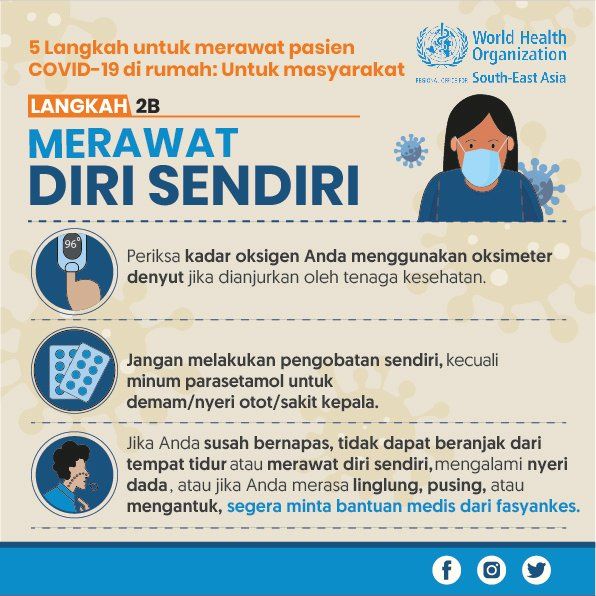
SURVEILLANCE

                  •       On 21 July, 33 772 new and 2 983 830 cumulative cases were reported nationwide
                          (Fig. 2). From 15 to 21 July, the average number of new cases per day was 44 826
                          cases. This was approximately 36% higher than the previous week (41 521 cases
                          per day).

               60000                                                                                         3500000

               50000                                                                                         3000000

                                                                                                             2500000

                                                                                                                         Cumulative number
               40000
Daily number

                                                                                                             2000000
               30000
                                                                                                             1500000
               20000
                                                                                                             1000000

               10000                                                                                         500000

                      0                                                                                      0
                            2-Mar

                            7-Apr

                            9-Nov
                              6-Jul

                           16-Sep
                             4-Oct

                            2-Apr

                           8-May
                           20-Jan

                           25-Feb

                              1-Jul
                          20-Mar

                           25-Apr
                          13-May
                          31-May

                             2-Jan

                            7-Feb
                           18-Jun

                          11-Aug
                          29-Aug

                          27-Nov
                          15-Dec
                            24-Jul

                           22-Oct

                          15-Mar

                           20-Apr

                          26-May
                           13-Jun

                            19-Jul
                 Daily number of confirmed COVID-19 cases            Cumulative number of confirmed COVID-19 cases

               Fig. 2. Daily and cumulative number of cases reported in Indonesia, as of 21 July 2021. Source of data

               Disclaimer: Since 10 February 2021, confirmed cases include those who tested positive using nucleic
               acid amplification test (NAAT) (e.g. polymerase chain reaction (PCR)) or antigen-detecting rapid
               diagnostic test (Ag-RDT). The number of cases reported daily is not equivalent to the number of persons
               who contracted COVID-19 on that day and might be influenced by the number of people tested on that
               day (see Fig. 17); reporting of laboratory-confirmed results may take up to one week from the time of
               testing. Therefore, caution must be taken in interpreting this figure and the epidemiological curve for
               further analysis, either at the national or subnational level.

                                                                                                                 3
               WHO Indonesia Situation Report - 64
               who.int/indonesia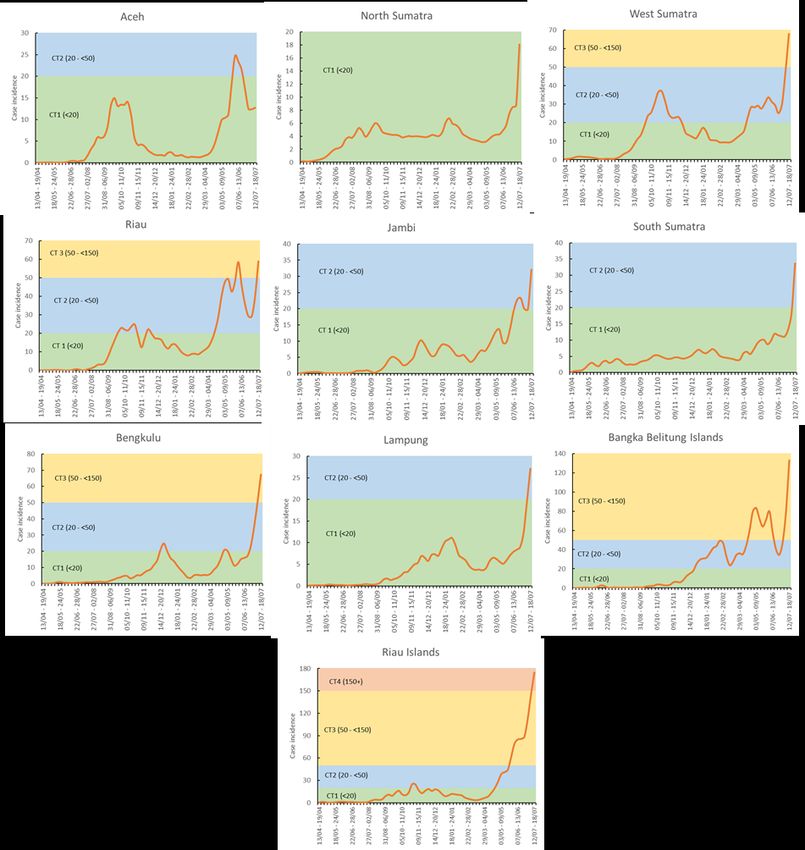
•   During the week of 12 to 18 July, 32 out of 34 provinces experienced an increase
        in the number of cases compared to the previous week, and 17 of those provinces
        experienced an increase of 50% or more. Of which, six provinces experienced an
        increase of more than 150%: Banten (540%), North Sumatra (238%), Papua
        (233%), South Kalimantan (196%), East Java (187%) and Jambi (152%) (Fig. 3).
        This suggests an urgent need for stringent public health and social measures
        (PHSM), especially movement restrictions, to be implemented throughout the
        country.

                               Banten
                       North Sumatra
                                Papua
                    South Kalimantan
                             East Java
                                Jambi
                       South Sumatra
                 West Nusa Tenggara
                            Gorontalo
                     West Kalimantan
                     Central Sulawesi
                     East Kalimantan
                       North Sulawesi
               Bangka Belitung Islands
                             Bengkulu
                                   Bali
                        West Sulawesi
                                  Riau
                        DI Yogyakarta
                          West Papua
                            West Java
                       South Sulawesi
                  Central Kalimantan
                             Lampung
                          Riau Islands
                  East Nusa Tenggara
                        West Sumatra
                  Southeast Sulawesi
                          Central Java
                        North Maluku
                    North Kalimantan
                           DKI Jakarta
                                  Aceh
                               Maluku
                                      -100%   0%     100%    200%     300%    400%    500%    600%
                                          Percentage change of weekly number of confirmed cases

Fig. 3. Percentage change of weekly number of confirmed cases by province during 12 to 18 July 2021
compared to the previous week. Source of data

Disclaimer: The number of weekly confirmed cases is calculated taking into consideration the daily
number of reported cases. It is important to conduct further investigation if there is a substantial change
in new cases, especially in provinces with a change of 50% or more. Other factors, such as testing
and contact tracing, may help elucidate the reasons behind substantial changes. Additional indicators,
including case incidence and mortality, should be considered to guide adjustment of PHSM.
                                                                                                     4
WHO Indonesia Situation Report - 64
who.int/indonesia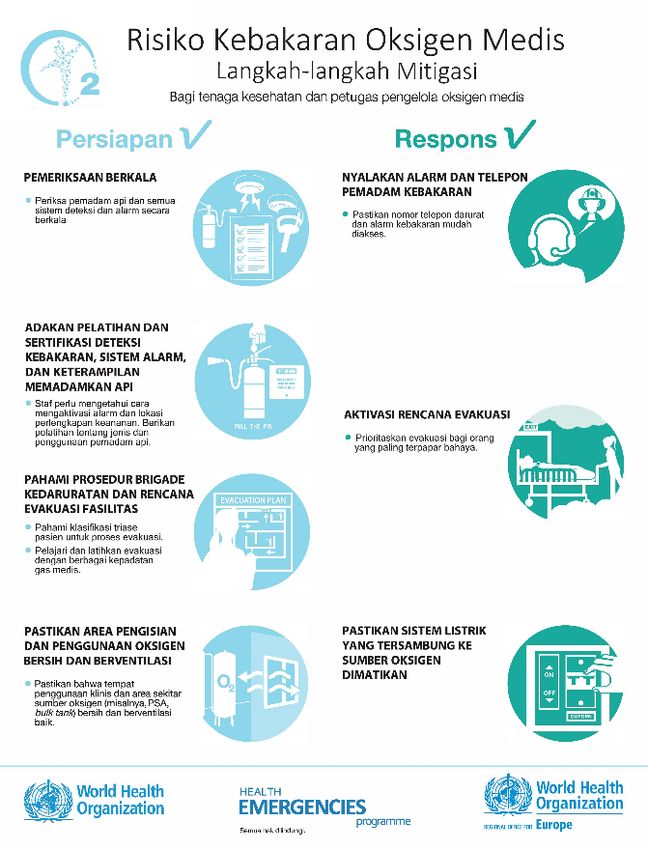
•   During the week of 12 to 18 July, the incidence 6 of COVID-19 cases in Indonesia
                              increased substantially from 67.1 per 100 000 population in the previous week to
                              95.6 per 100 000 population (Fig. 4). The incidence has been rapidly increasing in
                              the country since mid-May and is more than three-fold greater than the previously
                              recorded highest incidence in February (31.5 per 100 000 population).

                 100

                     90
                                 CT3 (50 -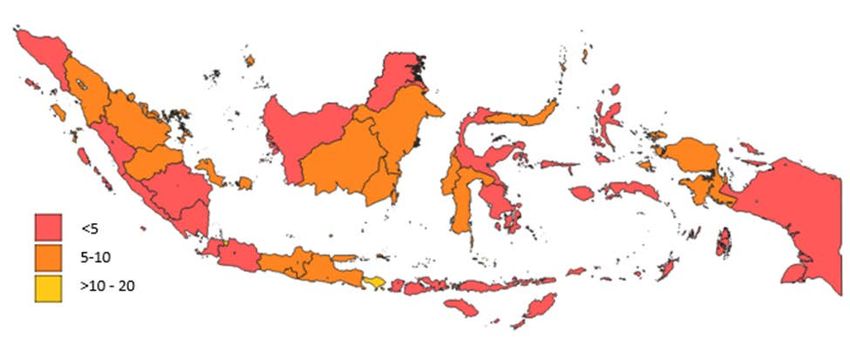
•   During the week of 12 to 18 July, six provinces, as opposed to two provinces in the
    previous week, were at the highest level of community transmission (CT4). The
    incidence of COVID-19 cases per 100 000 population was 753.9 in DKI Jakarta, 305.1
    in DI Yogyakarta, 196.8 in West Papua, 182.0 in East Kalimantan, 174.7 in Riau
    Islands and 152.9 in North Kalimantan (Fig. 5). Based on the WHO interim guidance,
    this means there is a very high risk of COVID-19 infection for the general public and
    a very high number of locally acquired, widely dispersed cases detected in the past
    14 days.

                               DKI Jakarta
                            DI Yogyakarta
                              West Papua
                         East Kalimantan
                              Riau Islands
                        North Kalimantan
                   Bangka Belitung Islands
                                West Java
                                       Bali
                            North Maluku
                                   Maluku
                                   Banten
                              Central Java
                      East Nusa Tenggara
                            West Sumatra
                                 Bengkulu
                      Central Kalimantan
                                      Riau
                                 East Java
                           North Sulawesi
                         West Kalimantan
                         Central Sulawesi
                           South Sumatra
                           South Sulawesi
                      Southeast Sulawesi
                                    Jambi
                        South Kalimantan
                                 Lampung
                                Gorontalo
                            West Sulawesi
                                    Papua
                     West Nusa Tenggara
                           North Sumatra
                                      Aceh
                                               0     100      200     300   400    500      600    700    800
                                                                    Weekly case incidence

                     CT 1 (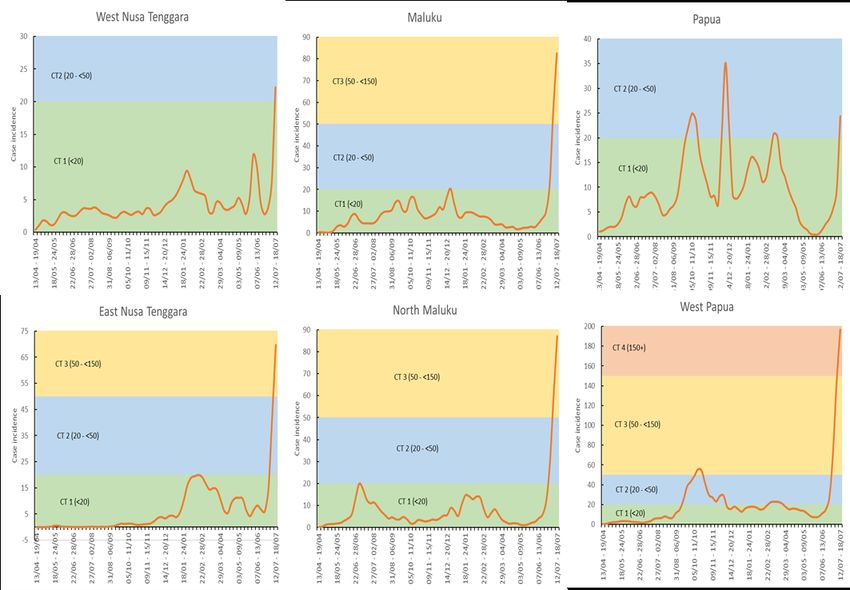
•   In Java and Bali, the weekly incidence of COVID-19 increased in all provinces during
       the week of 12 to 18 July compared to the previous week (Fig. 6). Java has been
       experiencing a steep increase in incidence rates since June. Both DKI Jakarta and
       DI Yogyakarta have been at the highest community transmission scenario (CT4)
       in the last five weeks and two weeks, respectively.

    Fig. 6. Incidence of COVID-19 per 100 000 population per week averaged over a two-week period
    in Java - Bali, from 13 April 2020 to 18 July 2021, classified by level of community transmission (CT):
    CT1: low incidence; CT2: moderate incidence; CT3: high incidence; CT4: very high incidence.
    Source of data

                                                                                                  7
WHO Indonesia Situation Report - 63
who.int/indonesia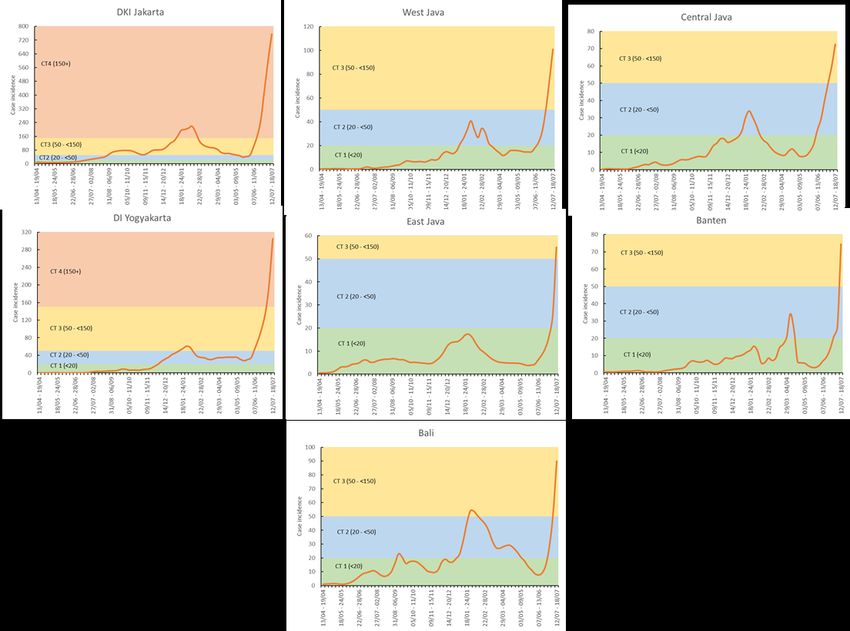
•   In Sumatra, the weekly incidence of COVID-19 increased in all provinces during the
       week of 12 to 18 July compared to the previous week. There has been an increasing
       trend in incidence since April in most provinces. Riau Islands has experienced a
       consistent and substantial increase in weekly incidence since March; reaching the
       highest transmission scenario (CT4). There has also been a recent surge in weekly
       incidence in West Sumatra, South Sumatra, Bengkulu, Lampung and Bangka
       Belitung Islands (Fig. 7).

   Fig. 7. Incidence of COVID-19 per 100 000 population per week averaged over a two-week period
   in Sumatra, from 13 April 2020 to 18 July 2021, classified by level of community transmission (CT):
   CT1: low incidence; CT2: moderate incidence; CT3: high incidence; CT4: very high incidence.
   Source of data
                                                                                               8
WHO Indonesia Situation Report - 63
who.int/indonesia
•   In Kalimantan, the weekly incidence of COVID-19 increased in all provinces during
       the week of 12 to 18 July compared to the previous week, with a rapid increase in
       cases since the end of June (Fig. 8). In particular, East Kalimantan and North
       Kalimantan experienced a substantial increase in cases and had reached the
       highest transmission scenario (CT4).

  Fig. 8. Incidence of COVID-19 per 100 000 population per week averaged over a two-week period
  in Kalimantan, from 13 April 2020 to 18 July 2021, classified by level of community transmission
  (CT): CT1: low incidence; CT2: moderate incidence; CT3: high incidence; CT4: very high incidence.
  Source of data

                                                                                            9
WHO Indonesia Situation Report - 63
who.int/indonesia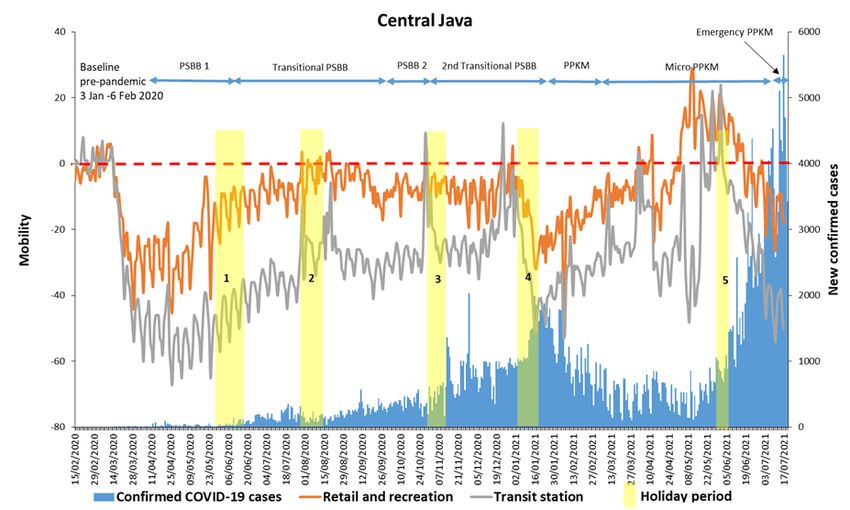
•   In Sulawesi, the weekly incidence of COVID-19 cases increased in all provinces during
    the period of 12 to 18 July, compared to the previous week. The incidence has been
    consistently increasing in all provinces since the end of May (Fig. 9).

    Fig. 9. Incidence of COVID-19 per 100 000 population per week averaged over a two-week period
    in Sulawesi, from 13 April 2020 to 18 July 2021, classified by level of community transmission (CT):
    CT1: low incidence; CT2: moderate incidence; CT3: high incidence; CT4: very high incidence.
    Source of data

                                                                                              10
WHO Indonesia Situation Report - 63
who.int/indonesia
• During the week of 12 to 18 July, the weekly incidence of COVID-19 increased
sharply in West Nusa Tenggara, East Nusa Tenggara, Maluku, North Maluku,
Papua and West Papua compared to the previous week (Fig. 10). West Papua had
reached the highest transmission scenario (CT4).
Fig. 10. Incidence of COVID-19 per 100 000 population per week averaged over a two-week period
in West Nusa Tenggara, East Nusa Tenggara, Maluku, North Maluku, Papua, and West Papua, from
13 April 2020 to 18 July 2021, classified by level of community transmission (CT): CT1: low
incidence; CT2: moderate incidence; CT3: high incidence; CT4: very high incidence. Source of data
11
WHO Indonesia Situation Report - 63
who.int/indonesia• Nationwide test positivity proportion increased sharply in December 2020; and
reached the first peak of 30.5% in mid-February 2021. It slowly declined thereafter
and remained between 9% and 20% between mid-March and end of June
(corresponding to CT3 – high incidence). Since then, however, the positivity
proportion has increased rapidly and steadily, reaching and remaining at the level
CT4 (very high incidence) to date. As of 18 July, the positivity proportion was 28.7%
(Fig. 11).
40%
35%
30% CT 4 (20%+)
Positivity proportion (%)
25%
20%
CT 3 (5% -20.0 70%
People tested/1000 population/week
18.0
60%
Positivity proportion (%)
16.0
14.0 50%
12.0 40%
10.0
8.0 30%
6.0 20%
4.0
10%
2.0
0.0 0%
1 2 3 1 2 3 1 2 3 1 2 3 1 2 3 1 2 3 1 2 3
Indonesia DKI West Central DI Yogyakarta East Banten
Jakarta Java Java Java
People tested/1000 population/week Test positivity proportion
20.0 70.0%
People tested/1000 population/week
18.0
60.0%
Positivity proportion (%)
16.0
14.0 50.0%
12.0 40.0%
10.0
8.0 30.0%
6.0 20.0%
4.0
10.0%
2.0
0.0 0.0%
1 2 3 1 2 3 1 2 3 1 2 3 1 2 3 1 2 3 1 2 3 1 2 3
Indonesia West East West Riau Central South Southeast
Sumatra Kalimantan Papua Kalimantan Sumatra Sulawesi
People tested/1000 population/week Test positivity proportion
Fig. 12. Test positivity proportion and people tested per 1000 population per week at the national
level and in select provinces.
Week 1: 28/06/21 to 04/06/21; Week 2: 05/07/21 to 11/07/21; Week 3: 12/07/21 to 18/07/21
Benchmark: one person tested per 1000 population per week
Threshold test positivity proportion:• During the week of 12 to 18 July, DI Yogyakarta had the highest weekly number
of confirmed COVID-19 deaths per 100 000 population, followed by DKI Jakarta,
East Kalimantan, Riau Islands and Central Java (Fig. 13).
DI Yogyakarta
DKI Jakarta
East Kalimantan
Riau Islands
Central Java
Bangka Belitung Islands
East Java
North Kalimantan
West Papua
West Kalimantan
West Java
Bali
North Maluku
Riau
West Sumatra
South Sumatra
Maluku
Central Sulawesi
Aceh
Bengkulu
North Sulawesi
Southeast Sulawesi
South Kalimantan
Lampung
Jambi
East Nusa Tenggara
Banten
Central Kalimantan
West Sulawesi
Gorontalo
South Sulawesi
North Sumatra
West Nusa Tenggara
Papua
0.0 1.0 2.0 3.0 4.0 5.0 6.0 7.0 8.0 9.0
Weekly number of confirmed COVID-19 deaths per 100 000 population
CT 1 (• At the national level, during the week of 12 to 18 July, the number of confirmed
COVID-19 deaths increased from 1.43 deaths per 100 000 in the previous week to
2.09 per 100 000 population 7. There was a steep increase in deaths throughout
June, which has continued into July (Fig. 14).
2.5
Deaths per 100 000 population
2.0
1.5
1.0
0.5
0.0
13/04 - 19/04
27/04 - 03/05
11/05 - 17/05
25/05 - 31/05
08/06 - 14/06
22/06 - 28/06
06/07 - 12/07
20/07 - 26/07
03/08 - 09/08
17/08 - 23/08
31/08 - 06/09
14/09 - 20/09
28/09 - 04/10
12/10 - 18/10
26/10 - 01/11
09/11 - 15/11
23/11 - 29/11
07/12 - 13/12
21/12 - 27/12
04/01 - 10/01
18/01 - 24/01
01/02 - 07/02
15/02 - 21/02
01/03 - 07/03
15/03 - 21/03
29/03 - 04/04
12/04 - 18/04
26/04 - 02/05
10/05 - 16/05
24/05 - 30/05
07/06 - 13/06
21/06 - 27/06
05/07 - 11/07
Fig. 14. Number of confirmed COVID-19 deaths per 100 000 population per week averaged over a
two-week period in Indonesia, as of 18 July 2021. Source of data
Disclaimer: Based on data availability, only confirmed COVID-19 deaths have been included. As
per WHO definition, however, death resulting from a clinically compatible illness in a probable or
confirmed COVID-19 case is a COVID-19-related death, unless there is a clear alternative cause
of death that cannot be related to COVID-19 (e.g. trauma); there should be no period of complete
recovery between the illness and death. Evaluation of the level of community transmission could
not be conducted due to data limitations.
7
Weekly mortality of COVID-19 is calculated as the number of COVID-19 deaths per 100 000 population per week
averaged over a two-week period. Source of population data
15
WHO Indonesia Situation Report - 63
who.int/indonesia• During the week of 12 to 18 July, the total number of weekly confirmed COVID-19
deaths in DKI Jakarta was 708, a slight decrease from the previous week (Fig. 15).
DKI Jakarta
800
Weekly number of confirmed COVID-19 deaths
700
600
500
400
300
200
100
0
02/03 - 08/03
16/03 - 22/03
30/03 - 05/04
13/04 - 19/04
27/04 - 03/05
11/05 - 17/05
25/05 - 31/05
08/06 - 14/06
22/06 - 28/06
06/07 - 12/07
20/07 - 26/07
03/08 - 09/08
17/08 - 23/08
31/08 - 06/09
14/09 - 20/09
28/09 - 04/10
12/10 - 18/10
26/10 - 01/11
09/11 - 15/11
23/11 - 29/11
07/12 - 13/12
21/12 - 27/12
04/01 - 10/01
18/01 - 24/01
01/02 - 07/02
15/02 - 21/02
01/03 - 07/03
15/03 - 21/03
29/03 - 04/04
12/04 - 18/04
26/04 - 02/05
10/05 - 16/05
24/05 - 30/05
07/06 - 13/06
21/06 - 27/06
05/07 - 11/07
Fig. 15. Weekly number of confirmed COVID-19 deaths in DKI Jakarta, as of 18 July 2021. Source of data
Disclaimer: The data are provisional. There may be a discrepancy in the number of deaths in confirmed
COVID-19 cases between national and provincial data sources.
CONTACT TRACING
• The Ministry of Health (MoH) has organized a virtual meeting on monitoring and
evaluation of the emergency PPKM, from 11 to 18 July 2021. The meeting was
attended by surveillance officers from provinces and districts where emergency
PPKM is implemented, according to the Instruction of the Minister of Home Affairs
Number 15 of 2021 on ‘COVID-19 Emergency PPKM in Java and Bali’. The
meeting concluded that testing rates in all provinces and districts implementing
emergency PPKM had reached the government’s benchmark. The meeting
highlighted suboptimal monitoring of self-isolation and limited compliance to
quarantine regulations among close contacts, which may have attributed to
difficulties in containing the COVID-19 transmission. WHO continues to support
MoH through technical assistance including data visualization and analysis to
strengthen the monitoring of implementation of emergency PPKM.
16
WHO Indonesia Situation Report - 63
who.int/indonesiaHEALTH OPERATIONS
• As of 21 July, the daily number of people tested for COVID-19 was 116 232 and
the cumulative number of people tested was 16 152 354 (Fig. 16).
200000 18000000
180000 16000000
160000 14000000
Cumulative number
140000 12000000
Daily number
120000
10000000
100000
8000000
80000
60000 6000000
40000 4000000
20000 2000000
0 0
7-Mar
6-May
2-Nov
5-Jul
23-Sep
10-Feb
2-Mar
1-May
21-Jan
3-Sep
27-Mar
16-Apr
26-May
1-Jan
15-Jun
14-Aug
22-Nov
12-Dec
25-Jul
13-Oct
22-Mar
11-Apr
21-May
10-Jun
30-Jun
20-Jul
Daily number of people tested Cumulative number of people tested
Fig. 16. Daily and cumulative number of people tested for COVID-19 in Indonesia, as of
21 July 2021. Source of data
• As of 21 July, the proportion of people recovered among the total confirmed cases
was 79.0% and there were 549 694 active cases (Fig. 17). The recovery
percentage has been decreasing since the end of June.
17
WHO Indonesia Situation Report - 63
who.int/indonesia600000 100.0
90.0
500000 80.0
400000 70.0
Percentage (%)
60.0
Number
300000 50.0
40.0
200000 30.0
100000 20.0
10.0
0 0.0
1-Apr
9-May
5-Jul
19-Sep
4-Dec
8-Oct
18-Feb
9-Mar
5-May
11-Jan
30-Jan
1-Jul
20-Apr
28-May
16-Jun
12-Aug
31-Aug
15-Nov
24-Jul
23-Dec
27-Oct
28-Mar
16-Apr
24-May
12-Jun
20-Jul
Active cases Recovery percentage
Fig. 17. Number of active cases of COVID-19 and recovery percentage in Indonesia, as of
21 July 2021. Source of data
• The reported number of confirmed cases hospitalized in DKI Jakarta increased
sharply in June and the beginning of July, reaching to the highest recorded number
of hospitalizations, 30 418, on 7 July. It has since decreased slightly to 22 271
hospitalizations on 18 July. The previous high was 9888 hospitalized cases
reported on 12 February (Fig. 18).
35000
Number of confirmed COVID-19
30000
25000
cases hospitalized
20000
15000
10000
5000
0
1-Oct 1-Nov 1-Dec 1-Jan 1-Feb 1-Mar 1-Apr 1-May 1-Jun 1-Jul
Fig. 18. Number of confirmed COVID-19 cases hospitalized in DKI Jakarta from 1 September
2020 to 18 July 2021. Source of data
18
WHO Indonesia Situation Report - 63
who.int/indonesia• WHO has recently published posters for health workers and other personnel to
adhere to safety and mitigation measures in handling medical oxygen. They
include guidance on medical oxygen cylinder safety, medical gas piping systems
safety and medical oxygen fire risk mitigation measures.
Fig. 19. WHO posters on medical oxygen, July 2021.
RISK COMMUNICATION
• WHO continues to translate key courses designed for partners and frontline
responders into Indonesian, which are available on the OpenWHO platform. As of
20 July, 31 055 participants took part in eight OpenWHO courses available in
Indonesian.
19
WHO Indonesia Situation Report - 63
who.int/indonesiaTable 1. Number of participants enrolled in the OpenWHO courses that have been translated
into Indonesian, as of 20 July 2021
Number of
No. OpenWHO courses
participants enrolled
Infection Prevention and Control (IPC) for COVID-19
1. 8427
virus
2. ePROTECT Respiratory Infections 6720
3. COVID-19 vaccination training for health workers 4654
COVID-19: Operational Planning Guidelines and
4. COVID-19 Partners Platform to support country 3843
preparedness and response
Introduction to COVID-19: methods for detection,
5. 3534
prevention, response and control
WHO Clinical Care Severe Acute Respiratory
6. 1330
Infection Training
Severe Acute Respiratory Infection (SARI)
7. 1288
Treatment Facility Design
8. Long-term care facilities in the context of COVID-19 1259
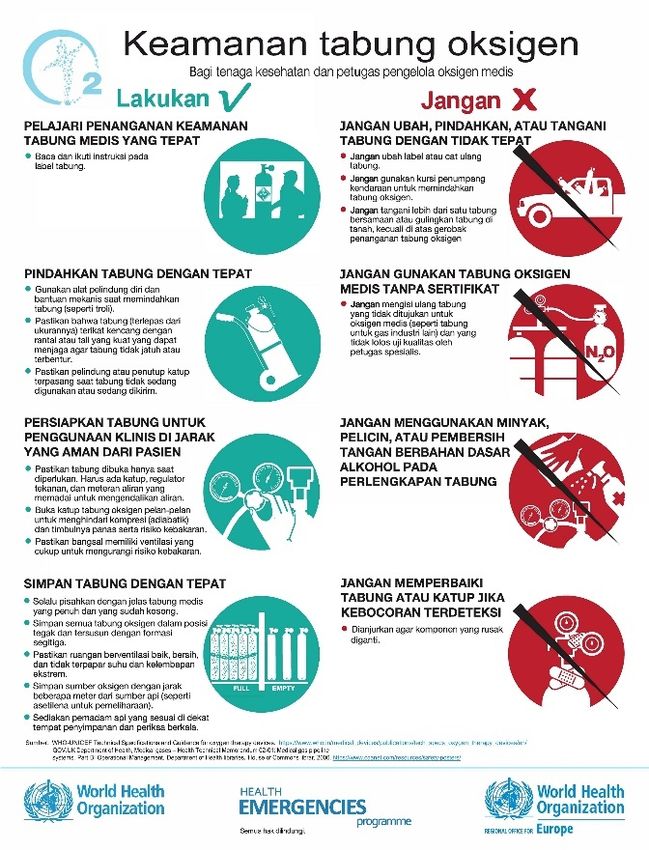
• WHO is regularly translating and sharing important health messages on its website
and social media platforms - Twitter and Instagram – and has recently published:
Infographics:
- Managing COVID-19 at home: Checking blood oxygen levels
- 5 Steps for managing patients with COVID-19 at home: Tips for health care
providers
- 5 Steps for managing patients with COVID-19 at home: for the public
20
WHO Indonesia Situation Report - 63
who.int/indonesiaFig. 20. WHO infographics on 5 Steps for managing patients with COVID-19 at home: for the public,
July 2021.
VACCINATION
• As of 19 July, 58 758 193 vaccine doses have been administered in the national
COVID-19 vaccination campaign; 42 313 731 people have received the first dose
and 16 444 462 people have received the second dose (Fig. 21).
21
WHO Indonesia Situation Report - 63
who.int/indonesia45000000
40000000
Number vaccinated
35000000
30000000
25000000
20000000
15000000
10000000
5000000
0
1/22/2021
1/29/2021
2/5/2021
2/12/2021
2/19/2021
2/26/2021
3/5/2021
3/12/2021
3/19/2021
3/26/2021
4/2/2021
4/9/2021
4/16/2021
4/23/2021
4/30/2021
5/7/2021
5/14/2021
5/21/2021
5/28/2021
6/4/2021
6/11/2021
6/18/2021
6/25/2021
7/2/2021
7/9/2021
7/16/2021
Cumulative 1st dose vaccination Cumulative 2nd dose vaccination
Fig. 21. Cumulative number of vaccine doses administered in Indonesia, from 22 January to
19 July 2021. Source of data
Disclaimer: COVID-19 vaccination started on 13 January. Published data from MoH is available
starting from 22 January.
• As of 19 July, the number of older people who have received the first dose of the
COVID-19 vaccine was 4 704 081 (21.8% of the targeted 21 553 118); only
2 965 880 (13.8% of the targeted population of older people) have received the
second dose (fully vaccinated). The number of essential public service workers
who have received the second dose of the vaccine was 9 801 630 (56.6% of the
target population of 17 327 167). Among them, 2 186 395 teachers (38.6% of the
targeted 5 659 560) have received the first dose and 1 631 045 (28.8% of targeted
population) have received the second dose. The number of people from vulnerable
and high-risk groups and those aged 18 years and older who have received the
first dose of the vaccine was 11 607 051 (8.2% of the targeted 141 211 181);
2 237 687 (1.6% of the targeted population) have received the second dose. The
number of health workers who have received the second dose of the vaccine was
1 439 234 (98% of the target population of 1 468 764) (Fig. 22).
22
WHO Indonesia Situation Report - 63
who.int/indonesiaFig. 22. Cumulative number of people who have received COVID-19 vaccine in Indonesia, as of
19 July 2021. Source of data
Disclaimer: COVID-19 vaccination started with health workers on 13 January. The second stage
of COVID-19 vaccination started on 17 February, targeting essential public service workers and
older people (above 60 years old). Published data from MoH is available starting from 22 January.
Vaccination coverage over 100% is due to differences in actual versus estimated target
population.
• As of 19 July, provinces with the highest percentage of unvaccinated (zero dose)
health workers were Papua, Maluku and Central Sulawesi (Fig. 23).
23
WHO Indonesia Situation Report - 63
who.int/indonesiaPapua
Maluku
Central Sulawesi
Gorontalo
North Maluku
Aceh
Bengkulu
West Sulawesi
North Kalimantan
Jambi
West Papua
South Sumatera
South Sulawesi
Southeast Sulawesi
North Sulawesi
East Kalimantan
South Kalimantan
Central Kalimantan
West Kalimantan
East Nusa Tenggara
West Nusa…
Bali
Banten
East Java
DI Yogyakarta
Central Java
West Java
DKI Jakarta
Riau Islands
Bangka Belitung…
Lampung
Riau
West Sumatera
North Sumatera
0% 5% 10% 15% 20% 25%
Unvaccinated
Fig. 23. Percentage of unvaccinated health workers by province in Indonesia, as of 19 July 2021.
Source of data
• As of 19 July, Bali was the province with the highest first-dose vaccination
coverage among all eligible target populations (health workers, older people,
essential public service workers, vulnerable and high-risk populations, children
aged 12-17 years and people aged 18 and above), followed by DKI Jakarta, Riau
Islands, North Sulawesi and DI Yogyakarta. As of the same day, DKI Jakarta had
the highest second-dose vaccination coverage among the same target groups,
followed by Bali, DI Yogyakarta, Riau Islands and Central Kalimantan (Fig. 24).
24
WHO Indonesia Situation Report - 63
who.int/indonesia100%
Vaccination coverage (%) 90%
80%
70%
60%
50%
40%
30%
20%
10%
0% DI Yogyakarta
East Java
Banten
Bengkulu
Lampung
Central Java
Maluku
Bali
Riau
North Sumatera
Southeast Sulawesi
DKI Jakarta
Jambi
West Java
Gorontalo
Bangka Belitung Islands
Riau Islands
East Kalimantan
South Kalimantan
Papua
Central Kalimantan
West Sulawesi
West Sumatera
North Sulawesi
East Nusa Tenggara
West Papua
West Kalimantan
South Sulawesi
North Kalimantan
South Sumatera
North Maluku
Aceh
West Nusa Tenggara
Central Sulawesi
1st dose coverage (%) 2nd dose coverage (%) Target
Fig. 24. COVID-19 vaccination coverage among all eligible target population by province in
Indonesia, as of 19 July 2021. Source of data.
Disclaimer: Vaccination coverage has been adjusted according to the updated denominator
published by the Ministry of Health. Published data from MoH includes target populations of the
third stage of national vaccination campaign, which was available starting from 13 July 2021.
• As of 19 July, the number of people who received two doses of the vaccine (fully
vaccinated) per 100 population was 6.0 nationwide; and DKI Jakarta had the
highest number of people fully vaccinated (18.3 per 100 population) amongst all
provinces, followed by Bali (17.5), Central Kalimantan (7.7), Riau Islands (7.6) and
DI Yogyakarta (7.6) (Fig. 25).
25
WHO Indonesia Situation Report - 63
who.int/indonesiaFig. 25. Number of people vaccinated with two COVID-19 vaccine doses (fully vaccinated) per
100 population by province in Indonesia, as of 19 July 2021. Source of data
• As of 19 July, DKI Jakarta had the highest first-dose vaccination coverage among
older people, followed by Bali, DI Yogyakarta and Riau Islands. As of the same
day, DKI Jakarta had the highest second-dose vaccination coverage among this
target group, followed by DI Yogyakarta, Bali and Riau Islands (Fig. 26). As of the
same day, provinces with the highest percentage of unvaccinated older people
were Aceh, West Sumatra and North Maluku (Fig. 27).
100%
90%
Vaccination coverage (%)
80%
70%
60%
50%
40%
30%
20%
10%
0%
DI Yogyakarta
East Java
Banten
Bengkulu
Lampung
Central Java
Maluku
Bali
North Sumatera
Riau
Southeast Sulawesi
DKI Jakarta
Jambi
West Java
Bangka Belitung Islands
Gorontalo
Riau Islands
East Kalimantan
South Kalimantan
Papua
Central Kalimantan
North Sulawesi
East Nusa Tenggara
West Sulawesi
West Sumatera
West Papua
West Kalimantan
North Kalimantan
South Sumatera
South Sulawesi
West Nusa Tenggara
Central Sulawesi
North Maluku
Aceh
1st dose (coverage) 2nd dose (coverage) Target (coverage)
Fig. 26. COVID-19 vaccination coverage among older people by province in Indonesia, as of
19 July 2021. Source of data
Disclaimer: Vaccination coverage for older people has been adjusted according to the published
data available starting from 13 July 2021.
26
WHO Indonesia Situation Report - 63
who.int/indonesiaAceh
West Sumatera
North Maluku
Papua
Lampung
West Papua
West Sulawesi
Southeast Sulawesi
Central Sulawesi
South Kalimantan
East Nusa Tenggara
West Kalimantan
Gorontalo
South Sulawesi
Maluku
Riau
West Nusa Tenggara
South Sumatera
Bengkulu
West Java
Banten
North Sumatera
North Kalimantan
East Java
Jambi
Bangka Belitung Islands
East Kalimantan
North Sulawesi
Central Kalimantan
Central Java
Riau Islands
DI Yogyakarta
Bali
DKI Jakarta
0% 10% 20% 30% 40% 50% 60% 70% 80% 90% 100%
Unvaccinated
Fig. 27. Percentage of unvaccinated older people (over 60 years of age) by province in Indonesia,
as of 19 July 2021. Source of data
• As of 19 July, DKI Jakarta had the highest first-dose vaccination coverage among
vulnerable and high-risk populations and the general population (above 18 years of
age), followed by Bali, Riau Islands and North Sulawesi. As of the same day, Bali
had the highest second-dose vaccination coverage among this target group,
followed by Riau Islands, Riau and DKI Jakarta (Fig. 28).
27
WHO Indonesia Situation Report - 63
who.int/indonesia100%
Vaccination coverage (%)
90%
80%
70%
60%
50%
40%
30%
20%
10%
0%
DI Yogyakarta
East Java
Banten
Bengkulu
Lampung
Maluku
Bali
Riau
Central Java
Southeast Sulawesi
North Sumatera
DKI Jakarta
West Java
Jambi
Gorontalo
Bangka Belitung Islands
Riau Islands
East Kalimantan
South Kalimantan
Papua
Central Kalimantan
West Sulawesi
West Sumatera
North Sulawesi
East Nusa Tenggara
West Papua
West Kalimantan
South Sulawesi
South Sumatera
North Kalimantan
West Nusa Tenggara
Central Sulawesi
North Maluku
Aceh
1st dose (coverage) 2nd dose (coverage) Target (coverage)
Fig. 28. COVID-19 vaccination coverage among vulnerable and high-risk populations and general
population by province in Indonesia, as of 19 July 2021. Source of data
Disclaimer: Indonesia kicked-off the third stage of the national COVID-19 vaccination campaign
targeting vulnerable and high-risk populations and general population (above 18 years of age) in
5 May 2021. Published data from MoH is available starting from 13 July 2021.
• As of 19 July, DKI Jakarta had the highest first-dose vaccination coverage among
children (aged 12 to 17 years), followed by Bali, Riau Islands and DI Yogyakarta
(Fig. 29).
100%
Vaccination coverage (%)
90%
80%
70%
60%
50%
40%
30%
20%
10%
0%
DI Yogyakarta
Banten
Bengkulu
East Java
Lampung
Central Java
Maluku
Bali
Riau
Southeast Sulawesi
North Sumatera
DKI Jakarta
Jambi
West Java
Bangka Belitung Islands
Gorontalo
Riau Islands
Papua
South Kalimantan
East Kalimantan
Central Kalimantan
North Sulawesi
West Sumatera
East Nusa Tenggara
West Sulawesi
West Papua
West Kalimantan
North Kalimantan
South Sumatera
South Sulawesi
Central Sulawesi
West Nusa Tenggara
North Maluku
Aceh
1st dose (coverage) 2nd dose (coverage) Target (coverage)
Fig. 29. COVID-19 vaccination coverage among children (aged 12 to 17 years) by province in
Indonesia, as of 19 July 2021. Source of data
Disclaimer: COVID-19 vaccination targeting children started on 1 July 2021. Published data from
MoH is available from 13 July 2021.
28
WHO Indonesia Situation Report - 63
who.int/indonesiaCONTINUITY OF ESSENTIAL HEALTH SERVICES
• WHO is supporting the government with the analysis of various essential health
services to ensure their continuity during the pandemic. Highlights of previous
National AIDS Programme (NAP) analyses can be found in WHO Situation Report
16 (pages 16-20) and Situation Report 36 (pages 17-21). Updates from the
programme are presented below:
i. WHO continues to support the NAP to ensure the continuity of essential HIV
services during the COVID-19 pandemic. Trainings on HIV and sexually transmitted
diseases (STIs) services were conducted for health workers from 1600 community
health centres (puskesmas) in 2020. One of the interesting findings was a
significant nationwide increase in HIV testing in Q1 (January-March) 2021, which
was approximately 70% higher than Q1 2020 (Fig. 30).
350000 325887 316158
290979
300000
Number Of HIV Tests
250000
200000
150000
103691
100000 88738 86391
50000
0
Jan Feb Mar
2020 2021
Fig. 30. Number of HIV test performed in Q1 (January-March) of 2021, compared to the same period
in 2020. Source: National AIDS Programme, Ministry of Health, unpublished data.
ii. The number of people living with HIV (PLHIV) who received care in January-February
2021 decreased by an average of 32% compared to the same period in 2020. A
significant decrease of 44% was observed in March 2021, compared to the same
period in 2020 (Fig. 31). These figures were consistent with the substantial decrease
in the number of facilities providing antiretroviral therapy (ART), from 8000 facilities in
2020 to 1600 facilities in 2021. The low number of PHLV receiving treatment in 2021
can also be explained by the lack of clinicians’ confidence in prescribing new ART
regimen composed of tenofovir/lamivudine/dolutegravir (TLD).
29
WHO Indonesia Situation Report - 63
who.int/indonesia6000
5000
4000
3000
Number
2000
1000
0
Jan Feb Mar
Enrolled in Care 2020 4893 5251 4896
Enrolled in Care 2021 3272 3586 2744
Number of Initiated ART 2020 3437 3562 3538
Number of Initiated ART 2021 2166 2721 2613
Fig. 31. Trend of enrolment in HIV care and initiation of antiretroviral treatment (ART) in Q1
(January-March) of 2021, compared to the same period in 2020. Source: National AIDS Programme,
Ministry of Health, unpublished data.
iii. There was a 3% decrease in the number of viral load tests performed in Q1 2021,
compared to the same period in 2020 (Fig. 32). This figure was relatively low
compared to the data reported in WHO Situation Report 36. The decrease was
mainly due to the limited availability of viral load test reagents in the country.
2700 93%
2619 92%
2600 2541 92%
2500 91%
2415
Percentage
2400 90%
Number
2300 2245 89%
2200 88% 88%
2100 87%
2000 86%
Q1 2020 Q1 2021
Tested Viral Load Viral Load Supressed % Viral Load Supressed
Fig. 32. Viral load tests and viral load suppression performed in Q1 (January-March) of 2021,
compared to the same period in 2020. Source: National AIDS Programme, Ministry of Health,
unpublished data.
30
WHO Indonesia Situation Report - 63
who.int/indonesiaiv. The number of pregnant women tested for HIV and syphilis in Q1 (January-March)
of 2021 decreased by 17% and 29%, respectively, compared to the same period in
2020 (Fig. 33). This may be explained by a decrease in the number of health facility
visits among pregnant women during the COVID-19 pandemic.
300000
250000
200000
Number of Test
150000
100000
50000
0
HIV Syphilis HIV Syphilis HIV Syphilis
Jan Feb Mar
2020 240438 73819 259851 78295 232361 71329
2021 188923 71081 213581 80105 204174 78484
Fig. 33. Number of pregnant women tested for HIV and syphilis in Q1 (January-March) of 2021,
compared to the same period in 2020. Source: National AIDS Programme, Ministry of Health,
unpublished data.
v. Similar to the HIV programme, there was a decrease in STIs case finding in Q1
2021, compared to the same period in 2020 (Fig. 34). This included a 21%
decrease in for urethral discharge diagnosis, 18% for urethritis gonorrhoea, 42%
for cervicitis and 15% for syphilis.
6000 5547
4873
5000
4139
Number of Cases
4000
3214
3000
2043 1878
2000 1616 1545
1000
0
Urethral Discharge Urethritis Gonorrhoea Servicitis Syphilis
Diagnosis
Q1 2020 Q1 2021
Fig. 34. Number of sexually transmitted diseases (STIs) cases in Q1 (January-March) of 2021,
compared to the same period in 2020. Source: National AIDS Programme, Ministry of Health,
unpublished data.
31
WHO Indonesia Situation Report - 63
who.int/indonesiaTo maintain essential HIV services during the COVID-19 pandemic and achieve the
HIV and STI national goals, WHO is supporting MoH in the following areas:
i. Guideline: As part of the HIV Self-Testing Africa (STAR) 3 Project, WHO supported
MoH to develop technical guidance on community-based surveillance (CBS). This
was done in collaboration with the Program for Appropriate Technology in Health
(PATH International) and Family Health International (FHI) 360 through the
Linkages across the Continuum of HIV Services for Key Populations Affected by
HIV Project (LINKAGES). The technical guidance includes details on target
populations, test kits, points of delivery, logistic mechanisms and recording and
reporting mechanisms (including templates).
ii. HIV partner notification: In 2020, WHO supported the NAP in disseminating the
national guidelines on partner notification (PN) and provided inputs on the
development of the guidelines for communities. PN trainings of health providers
and local communities (non-governmental organizations (NGOs)) were conducted
in 2021 which were financed by the national government budget. This year, WHO
facilitated PN trainings in North Kalimantan and East Java in collaboration with
LINKAGES and the United Nations Population Fund (UNFPA).
iii. In line with the recommendations of the Indonesia Country Review on HIV, WHO
conducted an exercise to estimate the STI burden in the country. This was
implemented in collaboration with Avenir Health (a global health organization). The
size of the STI burden was finalized in the first semester of 2021 and a draft report
has been submitted to MoH for further review and dissemination.
iv. As a follow-up to one of the recommendations from the external review conducted
in 2020, WHO supported the NAP to develop a guideline on HIV, syphilis and
Hepatitis B sentinel surveillance, in collaboration with the MoH Subdirectorate of
Family Health and Subdirectorate of Hepatitis and Gastrointestinal Tract Infection.
v. Recording and reporting: WHO continues to support the NAP monitoring team to
ensure the implementation of the national guideline on recording and reporting at
the health facility level.
32
WHO Indonesia Situation Report - 63
who.int/indonesiaPARTNER COORDINATION
• The overall funding request for WHO operations and technical assistance is
US$ 46 million (US$ 27 million for response and US$ 19 million for recovery
phase), based on estimated needs as of July 2021 (Fig. 35).
Fig. 35. WHO funding situation for COVID-19 response, July 2021.
Data presented in this situation report have been taken from publicly available data from the MoH
(https://infeksiemerging.kemkes.go.id/), COVID-19 Mitigation and National Economic Recovery
Team (KPCPEN) (http://covid19.go.id) and provincial websites. There may be differences in
national and provincial data depending on the source used. All data are provisional and subject to
change.
33
WHO Indonesia Situation Report - 63
who.int/indonesiaCOVID-19 AND MOBILITY ANALYSIS
• Mobility analysis can be used as a proxy to monitor population mobility during the
implementation of movement restriction policies during the COVID-19 pandemic.
Increased mobility may lead to increased interactions among people, which may
affect COVID-19 transmission. Mobility of populations can be measured using
several approaches 8. More information on the movement restriction policies that
have been implemented in Indonesia and an initial analysis on mobility trends in
Java and Bali is available on WHO Situation Report 63 (pages 27-31). Updates on
mobility analysis in provinces in Java and Bali, as of 17 July, are presented in
figures 36 to 42.
• During the implementation of emergency PPKM, reduced mobility was observed
in retail and recreation sectors as well as transit stations; however, this was still
higher than the level of mobility observed during the first large-scale social
restriction (Pembatasan Sosial Berskala Besar (PSBB)), especially in public
places such as shopping centres and restaurants.
8
For purposes of current analysis in Indonesia, COVID-19 Community Mobility Reports (Google) have been used.
34
WHO Indonesia Situation Report - 63
who.int/indonesiaFig. 36. Mobility analysis in DKI Jakarta, as of 17 July 2021
Holiday periods: 1. Eid al-Fitr 2020; 2. Eid al-Adha 2020; 3. Mawlid (Prophet Muhammad’s Birthday) 2020;
4. Christmas and New Year 2021; 5. Eid al-Fitr 2021.
Note: The baseline day is the median value from the 5-week period from 3 January to 6 February 2020 (prior to the
first reported cases in Indonesia). Mobility is calculated for the report date (unless there are gaps) and reported as a
positive or negative percentage change compared to the baseline day. Source of data: mobility; cases.
Disclaimer: Mobility analysis cannot demonstrate a cause and effect relationship between mobility and COVID-19
cases; interpretation should be based on the use of proxy measures for mobility to examine association with cases.
This note and disclaimer apply to Figs. 28-34.
35
WHO Indonesia Situation Report - 63
who.int/indonesiaFig. 37. Mobility analysis in West Java, as of 17 July 2021. Source of data: mobility; cases.
Fig. 38. Mobility analysis in Central Java, as of 17 July 2021. Source of data: mobility; cases.
36
WHO Indonesia Situation Report - 63
who.int/indonesiaFig. 39. Mobility analysis in DI Yogyakarta, as of 17 July 2021. Source of data: mobility; cases.
Fig. 40. Mobility analysis in East Java, as of 17 July 2021. Source of data: mobility; cases.
37
WHO Indonesia Situation Report - 63
who.int/indonesiaFig. 41. Mobility analysis in Banten, as of 17 July 2021. Source of data: mobility; cases.
Fig. 42. Mobility analysis in Bali, as of 17 July 2021. Source of data: mobility; cases.
38
WHO Indonesia Situation Report - 63
who.int/indonesiaWEEKLY RISK ASSESSMENT
Table 2. Weekly risk assessment by province in Indonesia, as of 18 July 2021.
Source of data: Cases, deaths and testing; vaccination
Note: Case incidence considers the trend of cases over the last three weeks. The change in new cases in the last
seven days is marked as light red if there is an increase of 50% compared to the previous week. The change in
new deaths is marked as light red if there is any increase in the percentage of deaths (and number of deaths ≥ 10)
compared to the previous week. The testing rate is marked as yellow if it is less than 1/1000 population. Test
positivity proportion is marked as light red if ≥ 20% and yellow if between 5% and 20%. The second dose
vaccination is marked as light red if < 5% and yellow if between 5% and 10%. Target population for vaccination
includes health workers, essential public service workers and older persons.
39
WHO Indonesia Situation Report – 64
who.int/indonesia• Urgent action is needed to address the continuing surge of cases, notably in
provinces in light red (Riau Islands, DKI Jakarta, West Java, Central Java,
DI Yogyakarta, East Java, Banten, Bali, East Kalimantan and North Maluku) and in
yellow. Bed occupancy rate has also been reported to be high in these provinces
and is considered in the risk assessment. 9,10,11,12 .
• Strict implementation of PHSM throughout the country is crucial, even as the
national vaccination coverage increases and expands to additional target groups.
PHSM works in the context of variants of concern (VOCs) as demonstrated in India
(see Situation Report 60: Lessons Learned) and other countries that are facing a
surge of cases. Considering that some VOCs have much higher transmissibility,
timely adjustments of PHSM is very important during a surge, including the use of
stringent measures (such as movement restrictions) as quickly as possible. 13
• A total of 797 cases of the Delta variant was reported in 21 out of 34 provinces in
Indonesia as of 19 July, which include eight new provinces (Papua, North
Kalimantan, Bali, East Nusa Tenggara, Lampung, Riau Islands, West Sulawesi)
compared to the previous week. The highest number of Delta variant cases was
reported in DKI Jakarta (287); followed by West Java (228) and Central Java (132).
Table 3. Number of Delta variant reported by province in Indonesia, as of 19 July 2021.
Source of data
Number of
No. Provinces
cases
1. DKI Jakarta 287
2. West Java 228
3. Central Java 132
4. DI Yogyakarta 20
5. North Sumatra 20
6. West Nusa Tenggara 16
7. East Java 14
8. East Kalimantan 13
9. South Sulawesi 11
10. Papua 10
11. North Kalimantan 8
12. South Sumatra 8
9
https://www.tribunnews.com/corona/2021/07/18/satgas-covid-19-kasus-aktif-corona-di-indonesia-melebihi-
dunia-tingkat-kesembuhan-anjlok?page=all
10
https://www.kompas.com/tren/read/2021/07/18/111000965/seberapa-parah-kondisi-covid-19-di-jakarta-rs-
diambang-kolaps-hingga-klaim?page=all
11
https://databoks.katadata.co.id/datapublish/2021/07/19/sudah-dua-kabupaten-kota-tingkat-keterisian-tempat-
tidur-rs-capai-100
12
https://jakartaglobe.id/news/indonesia-reports-highest-singleday-covid19-death-toll
13
https://www.who.int/emergencies/diseases/novel-coronavirus-2019/technical-guidance-publications
40
WHO Indonesia Situation Report – 64
who.int/indonesia13. Bali 7
14. Banten 7
15. Central Kalimantan 4
16. Bengkulu 3
17. East Nusa Tenggara 3
18. Lampung 3
19. Gorontalo 1
20. Riau Islands 1
21. West Sulawesi 1
• During the implementation of emergency PPKM, testing rates increased in some
provinces and districts; however, other provinces such as Aceh, Lampung, West
Nusa Tenggara and Southeast Sulawesi continue to experience challenges in
meeting the recommended benchmark of 1 suspected case tested per 1000
population per week. Testing services should be further strengthened across these
provinces. Early diagnosis of cases is a backbone of public health response to
COVID-19, as it enables timely isolation of cases, and tracing and quarantine of
contacts.
• Strengthening genomic surveillance and investigation of clusters are also highly
important when cases with Variants of Concern are suspected/confirmed.
• There is a need for hospitals to be equipped for the surge in cases, including
ensuring the availability of isolation rooms, oxygen supplies, medical equipment,
key therapeutics (e.g. corticosteroids, low-dose anticoagulants, antifungal
medicines, and interleukin-6 receptor blockers), personal protective equipment
(PPE), mobile field hospitals, body bags, as well as additional human resources
and capacity to convert hospital rooms to isolation or intensive care unit (ICU)
rooms. 14
• Community engagement and support (strict implementation of personal protective
measures) are essential to reducing the surge in cases, deaths and
hospitalizations. It is important to provide accurate and tailored information and
recommendations in order to counter misinformation and hoaxes.
• Vaccination needs to be expedited, especially for older populations with limited
coverage. Several provinces recorded the second-dose vaccination coverage
below 5% among older populations, including Aceh, West Sumatra, North Maluku,
Papua, West Sulawesi, Southeast Sulawesi, Gorontalo, West Papua, Lampung,
Central Sulawesi and East Nusa Tenggara. Actions to improve accessibility and
awareness on the benefits of COVID-19 vaccination for older and high-risk
14
https://www.who.int/publications/i/item/critical-preparedness-readiness-and-response-actions-for-covid-19
41
WHO Indonesia Situation Report – 64
who.int/indonesiapopulations need to be strengthened. Moreover, vaccinated people should continue
to adhere to public health and social measures.
• Health facilities should continue to adhere to key WHO recommended IPC
measures, in particular, to contact, droplet and airborne precautions, hand hygiene
practices, adequate environmental cleaning and disinfection, and ensuring
adequate ventilation in rooms.
42
WHO Indonesia Situation Report – 64
who.int/indonesiaRECENT AND UPCOMING WHO RESOURCE MATERIALS
Table 4. Title and details of recent WHO resource materials
Source : https://www.who.int
Title Details
WHO Weekly This edition includes data as of 18 July 2021. Two special focus
Epidemiological updates are provided in this edition: (i) the release of a WHO
Update on COVID-19 COVID-19 detailed surveillance data dashboard, including a
(Edition 49), downloadable database feature and (ii) detailed update on the
20 July 2021 phenotypic characteristics of SARS-CoV-2 variants of concern
(VOCs) Alpha, Beta, Gamma and Delta (including updates on
the geographic distribution of VOCs.
Episode 46 of In this episode, Dr Gojka Roglic, WHO Technical Officer for
Science in 5, WHO’s Diabetes Programme explains the risk posed by COVID-19 to
series of people living with diabetes.
conversation in
science,
16 July 2021
Clinical features and This report describes the demographics, clinical presentation,
prognostic factors of clinical outcomes and risk factors among people living with HIV
COVID-19 in people (PLHIV) who have been hospitalized for suspected or
living with HIV confirmed COVID-19.
hospitalized with
suspected or
confirmed SARS-
CoV-2 infection,
15 July 2021
WHO technical To increase oxygen scale-up activities at country level,
consultation on specifically in low- and middle-income countries (LMIC), WHO
oxygen access convened a consultation with other agencies and organization
scale-up for with proven experience implementing oxygen scale-up
COVID-19, activities. This consultation identified gaps and further actions
14 July 2021 to scale-up access to medical oxygen; facilitated the
understanding of the critical challenges of oxygen sources and
distribution systems; and highlighted the need for operational
guidance to scale-up for the COVID-19 surge (short-term) and
beyond the current emergency response (long-term).
Safe Eid al Adha This publication provides up-to-date public health advice that
practices in the can be applied across different national contexts to make
context of COVID-19, activities related to Eid al Adha safer. Key messages are
13 July 2021 proposed to both policy-makers and the general public.
43
WHO Indonesia Situation Report – 64
who.int/indonesiaA SNAPSHOT OF WHO COURSES AND INFORMATION MATERIAL
Online WHO COVID-19 courses:
• COVID-19 vaccination training for health workers
• Standard precautions: Environmental cleaning and disinfection
• Management of COVID-19 in long-term care facilities
• Operational planning guidelines and COVID-19
• Clinical management of severe acute respiratory infections
• Health and safety briefing for respiratory diseases – eProtect
WHO guidance:
• Infection prevention and control during
health care when coronavirus disease
(COVID-19) is suspected or confirmed
• COVID-19 Vaccines: safety surveillance
manual. Module on safety surveillance of
COVID-19 vaccines in pregnant and
breastfeeding women
• Diagnostics, therapeutics, vaccine
readiness, and other health products for
COVID-19
• Modelling the health impacts of
disruptions to essential health services
during COVID-19
• WHO Global Clinical Platform for the Clinical Characterization of COVID-19:
Statistical Analysis Plan
Infographics:
• COVID-19 vaccine and vaccination
• Vaccine prioritization
• Play your role
• Contact tracing: Confirmed contact & COVID-19 positive
Questions and answers:
• How to talk about vaccines
• COVID-19: Vaccines
• COVID-19: Vaccine research and development
• COVID-19: Vaccine access and allocation
Videos:
• Science in 5: Evolution of the SARS-CoV-2 virus
• Time to abide (1-10)
• COVID-19 virus variants
For more information please feel free to contact: seinocomm@who.int
WHO Indonesia Reports
44
WHO Indonesia Situation Report – 64
who.int/indonesiaYou can also read