45 Labor and Politics in the Middle East and North Africa - Pomeps

Page created by Earl Johnson
 
CONTINUE READING
45 Labor and Politics in the Middle East and North Africa - Pomeps
POMEPS
                          STUDIES

                          45

  Labor and Politics in the
Middle East and North Africa
           January 2022
45 Labor and Politics in the Middle East and North Africa - Pomeps
Contents
Introduction: Labor and Politics in the Middle East and North Africa .  .  .  .  .  .  .  .  .  .  .  .  .  .  .  .  .  .  .  .  .  .  .  .  .  .  .  .  .  . 3
Dina Bishara, Cornell University
Ian Hartshorn, University of Nevada, Reno
Marc Lynch, The George Washington University

Youth Employment Transitions in the Egyptian Market- Has anything changed?
A Study on Youth Employment Dynamics using the Egyptian Labor Market Panel
Surveys between 1998 and 2018.  .  .  .  .  .  .  .  .  .  .  .  .  .  .  .  .  .  .  .  .  .  .  .  .  .  .  .  .  .  .  .  .  .  .  .  .  .  .  .  .  .  .  .  .  .  .  .  .  .  .  .  .  .  .  .  .  .  .  .  .  .  .  . 5
Samar Abdelmageed, The British University in Egypt (BUE)

COVID-19 and Algeria’s Labor Movement .  .  .  .  .  .  .  .  .  .  .  .  .  .  .  .  .  .  .  .  .  .  .  .  .  .  .  .  .  .  .  .  .  .  .  .  .  .  .  .  .  .  .  .  .  .  .  .  .  .  .  .  . 20
Ashley Anderson, University of North Carolina, Chapel Hill

Who are unions for?
Snapshots of union-activist relations in Redeyef, Tunisia, in the late Ben Ali era .  .  .  .  .  .  .  .  .  .  .  .  .  .  .  .  .  .  .  . 26
Chantal Berman, Georgetown University

Youth and Labor Discourses in the MENA region:
A Tournament of Narratives and their Implications. .  .  .  .  .  .  .  .  .  .  .  .  .  .  .  .  .  .  .  .  .  .  .  .  .  .  .  .  .  .  .  .  .  .  .  .  .  .  .  .  .  .  .  .  . 32
Nada Berrada, Virginia Polytechnic Institute and State University

Unemployed and Unaware? Communicating Labor Policy Changes to the Saudi Workforce.  .  .  .  .  .  .  .  . 38
Ahmad Binobaid, King Saud University
Jonas Draege, Oslo New University College
Andrew Leber, Harvard University

The Case of Turkish Labor Mediation: Disenfranchising the Workers .  .  .  .  .  .  .  .  .  .  .  .  .  .  .  .  .  .  .  .  .  .  .  .  .  .  .  .  . 45
Doga Eralp, American University

The emergence of labor market outsiders among GCC citizens .  .  .  .  .  .  .  .  .  .  .  .  .  .  .  .  .  .  .  .  .  .  .  .  .  .  .  .  .  .  .  .  .  .  . 50
Steffen Hertog, London School of Economics

The Landscape of Labor Protest in Jordan: Between State Repression and Popular Solidarity. .  .  .  .  .  .  .  . 57
Matthew Lacouture, University of Chicago

Do Higher Education Scholarships Enhance Social Mobility?
A Case from Egypt on Scholars Transition to Decent Work. .  .  .  .  .  .  .  .  .  .  .  .  .  .  .  .  .  .  .  .  .  .  .  .  .  .  .  .  .  .  .  .  .  .  .  .  .  . 63
Amal Mowafy, USAID Scholars Activity, The American University of Cairo (AUC) and
AbdelRahman Nagy, Sawiris Foundation for Social Development

The Many Leverages of Tunisian Labor.  .  .  .  .  .  .  .  .  .  .  .  .  .  .  .  .  .  .  .  .  .  .  .  .  .  .  .  .  .  .  .  .  .  .  .  .  .  .  .  .  .  .  .  .  .  .  .  .  .  .  .  .  .  .  .  . 69
Ahmad Al-Sholi, Stony Brook University

To regulate or not to regulate? Jordan’s approach to digital ride-hailing platform Careem.  .  .  .  .  .  .  .  .  .  .  . 76
Tina Zintl, German Development Institute (DIE)
45 Labor and Politics in the Middle East and North Africa - Pomeps
The Project on Middle East Political Science
The Project on Middle East Political Science (POMEPS) is a collaborative network that aims to increase the impact of political scientists
specializing in the study of the Middle East in the public sphere and in the academic community. POMEPS, directed by Marc Lynch, is
based at the Institute for Middle East Studies at the George Washington University and is supported by Carnegie Corporation of New
York and the Henry Luce Foundation. For more information, see http://www.pomeps.org.

                                                                   2
45 Labor and Politics in the Middle East and North Africa - Pomeps
Introduction

Introduction:
Labor and Politics in the Middle East and North Africa
Dina Bishara, Cornell University
Ian Hartshorn, University of Nevada, Reno
Marc Lynch, The George Washington University

Economic grievances were at the heart of the Arab                   developed organizational independence and others did not
uprisings which erupted a decade ago. In many countries,            is a core research question in MENA, and more broadly.
such as Egypt and Tunisia, organized labor actions as
well as localized workplace mobilization had been rising            Al-Sholi, in this collection, traces the strength of the
for years before 2011. Rising inequality, inflation, poor           UGTT to a series of compromises and concessions made
working conditions, and shortages of quality jobs fueled            over decades. A regime near-crisis in the early 1970s led
frustration with regimes which seemed uninterested in               to the UGTT embracing elite cleavages and a system of
responding effectively.                                             export-led growth. The strategy has served the union well
                                                                    and may shed light on its decision-making in the Saied era.
The centrality of those grievances and the workers                  Berman tells a related story of the evolution of the UGTT,
articulating them has led to a growing research community           shifting the focus from the political skirmishes at the
focused on organized labor in the Middle East and North             center of the regime to the peripheral areas of phosphate
Africa. In April 2021, Dina Bishara and Ian Hartshorn               production along the Algerian border. Berman’s analysis
convened a virtual workshop through Cornell University’s            highlights the complex relationship between unions and
School of Industrial and Labor Relations bringing together          labor market outsiders, especially the unemployed.
a wide range of scholars writing in the area. POMEPS then
invited those participants, as well as others who had not           Even outside of traditional union structures, labor can face
presented papers, to participate in a follow-on workshop            challenges with state relations. Eralp highlights the struggle
to continue the discussion. The papers in this collection           of workers seeking redress in the Turkish labor mediation
are one of the fruits of this increasingly robust scholarly         system and the ways Turkish Labor Mediation Law erodes
network.                                                            workers’ rights. Zintl also addresses issues of another
                                                                    arm of state control-regulation—exploring how Jordan
Several key themes run through the papers.                          addresses the gig economy.

Institutional variation in organized labor:                         Shifting labor market segmentation:

One of the key issues raised by the papers in this collection       A second set of issues highlighted by the papers is the
is the origins and the implications of national variation in        emergence of forms of labor market segmentation which
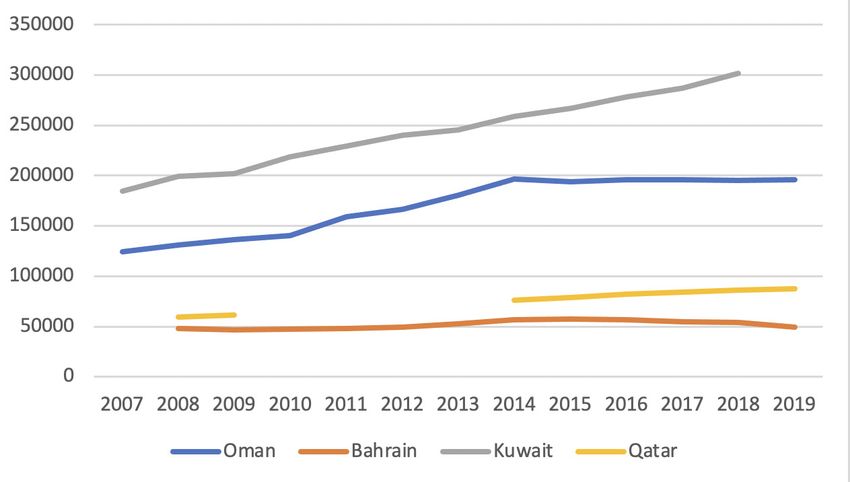
the systems for the representation of labor. Many MENA              have generated new winners and losers. In the Gulf, Hertog
countries have adopted some form of corporatism, with               points out how the collapse of public sector hiring has led
formal or informal institutional ties between the political         to a new class of citizen labor market outsiders, unable to
regime and the organizations representing workers. Such             compete with cheap non-citizen labor but also unable to
corporatist systems are double edged: while official unions         secure government jobs.
may be able to bargain with the government on behalf of
workers, they are also expected to police their membership          Binobaid, Draege, and Leber analyze how much the Saudi
and prevent more radical demands. Why some unions                   state has struggled to even reach its own unemployed

                                                                3
citizens through a national survey revealing low utilization       to building structures representative of their needs, to
and awareness of unemployment insurance programs.                  managing the relationship to other social movements.
Zintl’s analysis highlights how the regulation of the              These essays shed light on some of the most salient
gig economy in Jordan has deepened labor market                    dynamics of the present moment and point to future
segmentation and created a class of “privileged outsiders.”        research avenues. These include greater attention to
                                                                   the effects of labor market segmentation and the political
Even as workers are displaced from existing labor                  implications of critical divisions between labor market
markets, new entrants have a challenge establishing                insiders and outsiders. As al-Sholi and Berman highlight,
a foothold. Abdelmageed shows that the young face                  further research is needed to unpack the relationship
persistent problems in the workforce, exacerbated by               between unions and labor market outsiders, as well as the
the economic uncertainty following the 2011 uprising,              role that unions play in the face of increasing economic
and disproportionately impacting women and college                 liberalization.
graduates. Berrada looks at Morocco and explores how
the discourse of ‘waithood’ and the individualizing                Rising informality and the rise of the gig economy on
expectations of neoliberalism help to elide structural             employment conditions has implications for the level and
and systemic weaknesses in the market. Mowafy and                  efficacy of trade union representation. Youth face daunting
Nagy underscore the effects of economic inequality on              structural barriers to meaningful formal labor market
opportunities for decent work, noting the need for greater         participation across much of the region which have proven
investment and attention to distribution of need-based             resistant to reforms. The contributions (especially Berrada,
scholarships that can mitigate those inequalities.                 Mowafy and Nagy, and Abdelmageed) raise important
                                                                   questions about the relationship between socioeconomic
Workers in, with, and against other movements:                     status and education on the one hand, and the likelihood
                                                                   of transitioning into or out of the labor force on the other
The world of work is far from the only movement shaping            hand.
the lives of residents of the Middle East and North
Africa. Collaboration and confrontation between labor              Other contributions to the collection invite further
organizations and those representing other interests have          research on the determinants of labor activism and
been a hallmark of contentious politics not only since the         the various modalities that it might take, especially in
2011 uprisings, but throughout much of the last 40 years.          repressive political environments. As Lacouture shows,
Several of the contributions to this collection highlight          public sector workers may be particularly well positioned
how workers interact with other movements. Anderson                to engage in effective mobilization. Anderson argues that
explores the relationship of independent unionists and             crises can induce innovation in mobilization strategies
pro-democracy activists in Algeria’s hirak movement, and           even under politically constrained situations. Post-2011
the unique responses they have made to the challenges              experiments with independent trade unions have, in other
of the Covid-19 pandemic. Lacouture addresses those                contexts, been reversed by resurgent autocratic regimes.
workers excluded from formal structures such as teachers
in Jordan, and how they may form ‘communities of fate’             The contributions to this collection offer rich food for
with others on the margins of state-labor relations.               thought about the shifting research questions and political
                                                                   vistas of labor across the Middle East and North Africa.
Conclusion                                                         These essays, and those by other participants in the
                                                                   workshop which are not included in this collection, show
Workers face daunting challenges in the Middle East and            the promise of a rich and vibrant interdisciplinary research
North Africa; from entering and exiting the workforce,             community.

                                                               4
Labor and Politics in MENA

Youth Employment Transitions in the Egyptian Market-
Has anything changed?
A Study on Youth Employment Dynamics using the Egyptian Labor Market Panel
Surveys between 1998 and 2018

Samar Abdelmageed, The British University in Egypt (BUE)

Egypt is a young society with more than 20 million                any. The paper attempts to answer three main research
people within the age group (18-29) years, representing           questions: what are the patterns of youth transitions
about 21% of the total population according to Egypt’s            among the employment, unemployment, and inactivity
Central Agency for Public Mobilization and Statistics             statuses? What are the characteristics that affect the
(CAPMAS) latest released statistics. Despite the increasing       probability of falling into a specific status? And how do
levels of educational attainment among the youth and              transitions from one status to another differ between
the progressively narrowing gaps between genders in               the youth (18-34) years and individuals in the prime-age
education, young Egyptian university graduates suffer             category, identified similar to Flek and Mysíková (2016)
from high unemployment rates, especially females. As of           as those who are between 35 and 54 years of age? The
2020, the unemployment rate for Egyptian youth between            data used in my analysis comes from four rounds of
15 to 24 years of age was 30% unemployment, with 25%              Egypt Labor Market Panel Survey (ELMPS) conducted
among males and 42% among females (Danish Trade                   in 1998, 2006, 2012, and 2018. The survey offers detailed
Development Unit, 2020).                                          information on the development of the Egyptian labor
                                                                  market during this twenty-year period and is considered
This problem of youth unemployment goes hand in hand              to be a rich source of data on a variety of topics related
with other deficiencies embedded within the Egyptian              to the Egyptian labor market and the socioeconomic
labor market including the modest rates of job creation,          characteristics of the sampled individuals. Additionally,
stagnating productivity levels, increasing informalities,         these waves enable the research to analyze the dynamics
and low labor wages. A comparison of the youth and adult          and transitions among the employment, unemployment,
or prime-age employment patterns usefully differentiates          or inactivity statuses over an adequate period of time. To
between the problems exclusive to each age group and              examine dynamics, the methodology of analysis depends
those which are inherent in the Egyptian economy and              on building a series of multinomial logistic models to
labor market. This classification would help design               analyze the characteristics, including age, that affect the
effective targeting policies. Furthermore, it is important        probability of transitioning between different working
to study the dynamics of employment and unemployment              statuses (employment, unemployment and inactivity), for
during crises, such as the Arab Spring and the revolutions        each two consecutive rounds of ELMPS.
witnessed by Egypt starting from 2011, to investigate
their impacts compared to periods before and after                One key finding which emerges from the analysis is
the emergence of these crises and distinguish between             that age was not found to be related to moving from
problems and issues that are temporary and those which            unemployment to employment in the Egyptian labor
are inherited in labor markets.                                   market. All cohorts had difficulty transiting from
                                                                  unemployment to employment, especially in the recent
Therefore, the main aim of this paper is to analyze youth         years that followed the eruption of the Arab Spring
employment and unemployment patterns in the Egyptian              in Egypt in 2011. The analysis also revealed a steady
labor market over the years to detect any changes over            movement of females out of the labor force and the
time and analyze the causes behind these changes, if              tendency of workers with higher educational levels to

                                                              5
step out of the job market compared to workers with                 Tunisia to study the dynamic movements of youth into
no educational background. These results indicated the              and out of employment in these countries. The paper
problems of mismatch between job supply and demand;                 highlighted some of the chronic issues that face the
the insufficient formal job creation in the Egyptian labor          youth in their pursuit for work, including their common
market; and the educational system’s inability to improve           behavior of seeking a formal job at first, then resorting
employability among its graduates. Moreover, young                  to informal employment when their efforts fail, if they
workers with better educational outcomes who also belong            are desperate to work, or giving up their place in the job
to families with higher educational backgrounds have                market and turning to inactivity, if they and their families
bigger chances of leaving the labor force, which reflects the       can afford that, which is the usual case for young women
association between education and wealth that still persists        in MENA.
in Egypt.
                                                                    Young Egyptian workers who enter the labor market for
Literature Review                                                   the first time tend to face very long unemployment (two
                                                                    years or more); therefore, this insertion dilemma is one of
In general, youth face more struggles in labor markets              the main contributors to the problem of unemployment in
compared to more experienced workers, especially when               Egypt. This conclusion was also reiterated in Assaad and
they first enter the market searching for jobs. The reasons         Krafft (2021) and AlAzzawi and Hlasny (2020), which used
behind these struggles vary by economy but may widely               data from the different ELMPS rounds in their analyses
include mismatches between job supply and demand,                   and emphasized the high unemployment probability of
and the insufficient formal job creation in the private             young Egyptian university graduates, who mainly wait
sector and the associated queuing for formal public jobs            for formal employment, and the difficult job mobility for
especially in the developing countries (Flek and Mysíková           those who take over informal jobs. Other studies also
2016, Nilsson 2019). Moreover, young workers usually                highlighted the slow transition from school to work which
suffer from higher turnover compared to their prime-                prevails among young Egyptian workers (Angel-Urdinola
aged counterparts; however, on the other hand, the                  and Semlali 2010, Assaad 2007), and their increasing
employability of older workers decreases over time since            vulnerable employment as a result of the insufficient
younger job seekers may accept jobs with worse-off job              formal job generation in the Egyptian economy (Gadallah
conditions such as low wages and work instability (Flek             2011, Assaad et al 2016). Therefore, it is important to track
and Mysíková 2016).                                                 the unemployment/employment dynamics among young
                                                                    Egyptians and examine any relevant changes over time.
Studies on employment dynamics in the Middle East                   It would also be interesting to compare these dynamics
and North Africa (MENA) region are generally scant                  among youth to older workers to disentangle the dynamics
due to the lack of comprehensive longitudinal data that             related to Egyptian young workers from those of older and
detect transitions into and out of employment and the               perhaps more experienced workers who might have better
related socio-economic characteristics of the working-              opportunities in the labor market.
age populations over time in the region’s labor markets.
However, the recent availability of a group of panel                Data and Methods
labor market surveys that have been conducted by the
Economic Research Forum (ERF) in few MENA countries                 This paper aims to detect unemployment/employment
over time offered an opportunity for a number of papers             transitions in the Egyptian labor market over time
to study the dynamics of employment focusing on youth               especially among young workers. Data used in analysis
in MENA. Assaad and Krafft (2016) employed the data of              mainly come from the ELMPS rounds of 1998, 2006,
the labor market panel surveys conducted in 1998, 2006              2012 and 2018. This survey is a longitudinal study of
and 2012 for Egypt; in 2010 for Jordan; and in 2014 in              the Egyptian labor market that provide rich datasets of

                                                                6
Labor and Politics in MENA

the socio-economic characteristics of its representative          in the survival analysis and examining factors that affect
samples of respondents, which have been used                      unemployment exit mainly come from ELMPS 2018, which
extensively in the literature and can be employed by              is the only survey that includes a right-censoring variable
this paper to track the transitions and dynamics of               to identify unemployment vs. exit from unemployment as
employment/unemployment over time. In each round                  well as the unemployment duration estimated based on the
of ELMPS, a refresher sample of between 2,000 to 3,000            employment history for those who have worked before and
households are surveyed to ensure the representative              are new and currently unemployed, in addition to those who
of the samples throughout the years. The final sample             have never worked even if not currently unemployed. For a
of ELMPS 2018 included 61,231 individuals coming                  full specification of the model, see the Appendix.
from 15,746 households representing people who
live in different parts of Egypt coming from various              Main Findings
backgrounds and characteristics (Krafft, Asaad and
Rahman 2018). The presence of such longitudinal data              Figure 1 shows that, according to the data of different
offers an opportunity to analyze employment dynamics              ELMPS rounds over time, youth unemployment rates
and compare these dynamics during crises, if existed              are stable and constantly higher than those of prime-age
(Kelly et al 2014).                                               workers. However, total unemployment rates increased by
                                                                  11.24% between ELMPS 1998 and ELMPS 2018 and prime-
To examine employment transitions, the paper starts               age workers witnessed an increase in their unemployment
with a descriptive analysis of the dynamics among young           rates from 1.64% in ELMPS 1998 to 4.49% in ELMPS 2018.
workers compared to prime-aged workers over time. Youth           This may refer to problems of lay-offs faced by prime-age
are defined as those belonging to the (18-34) years of age        workers after the eruption of the Arab Spring in Egypt in
category, while prime-aged individuals in the prime-age           2011. The descriptive analysis of the evolution of current
category are identified similar to Flek and Mysíková (2016)       unemployment durations between ELMPS 1998 and 2018
as those who are between 35 and 54 years of age. These            presented in Table 1, highlights their constant increase
two groups are chosen to compare young labor market               over the years for all age groups, especially in 2012 and
entrants to those who are more experienced, including mid         2018, implying that it is getting more and more difficult to
and senior level workers.                                         obtain a new job for someone who loses his/her job. It is
                                                                  also worth mentioning that the unemployment duration
The paper follows its descriptive analysis with a series of       for the prime-aged has substantially increased above that
multinomial logistic regression models to study factors           of young workers in ELMPS 2018.
that affect the transition from unemployment to other
statuses including employment and inactivity (out of labor
force) between each two consecutive ELMPS rounds.

Similar to Assaad and Krafft (2016), the study will depend
on broad unemployment, which does not require the active
search for work but the availability and readiness to work,
also using the market definition that excludes subsistence
workers. Furthermore, the independent variables selected
for analysis, which are commonly used in the literature to
analyze the dynamics of unemployment, include age, gender,        Figure 1. Unemployment rates, total, youth (18-34 years)
education, area of residence (urban/rural) and the father’s       and prime-aged (35-54 years), ELMPS 1998-2018
level of education (Cincǎ and Matei, 2018; Assaad and
Krafft, 2016, 2021; AlAzzawi and Hlasny, 2020). Data used         Source: based on ELMPS 1998, 2006, 2012 and 2018

                                                              7
Table 1. Current unemployment durations (in months) by ELMPS round (1998-2018), total, youth (18-34 years) and prime-
aged (35-54 years) *

(months)
                               Mean       Std dev.   Min      Max
 ELMPS 1998

 Total                         31.67      31.39      1.00     132.00

 Youth (18-34 years)           33.74      31.50      1.00     132.00

 Prime-aged (35-54 years)      27.85      35.73      1.00     132.00

 ELMPS 2006

 Total                         36.91      31.66      2.23     132.00

 Youth (18-34 years)           37.84      31.69      2.23     132.00

 Prime-aged (35-54 years)      38.65      34.97      2.69     120.00

 ELMPS 2012

 Total                         57.03      48.44      3.00     188.00

 Youth (18-34 years)           57.98      47.82      3.00     188.00

 Prime-aged (35-54 years)      52.04      55.47      3.00     178.00

 ELMPS 2018

 Total                         68.00      68.88      1.00     258.00

 Youth (18-34 years)           62.44      58.08      1.00     242.00

 Prime-aged (35-54 years)      88.74      92.09      1.00     258.00

*Excluding observations that are below the 5th or above the 95th percentiles of the unemployment durations

Source: based on ELMPS 1998, 2006, 2012 and 2018

Examining movements between the different working statuses (employed, unemployed and out of labor force) show the
decreasing transitioning from unemployment to employment among the youth over time, especially between 2012 and 2018
compared to the period between 2006 and 2012 [Figure 2]. Transitions from unemployment to inactivity prevails among
young females [Figure 3]. Figures 4 and 5 show the reduction in the percentages of prime-aged workers who transform
from unemployment to employment between 2006 and 2012 and between 2012 and 2018 compared to 1998 and 2006;
additionally, unemployed females in this age category are finding it more difficult over time to transition from unemployment
to employment. Furthermore, the percentage of females who move from unemployment to out of labor force is higher among
prime-aged workers compared to the young women.

                                                              8
89.5             49.3      42.7                                  8

                                                                                                                                                                      0 2

                                                                                                                                                                                                                                         0 2
                                                                                                                                                                                             emp_98       unemp_98      OLF_98                                em
                                                                                                                                                                                                       Labor and Politics in MENA
                                                                                                                                                                                                     emp_06             unemp_06
                                                                                                                                                                                                     OLF_06

                                         98&06-youth(18-34)
                                        98&06-youth  (18-34)                                                06&12-youth(18-34)
                                                                                                           06&12-youth  (18-34)                                                                 12&18-youth (18-34)
                                       7.2
                                      7.2                                                              13.1
                                                                                                      13.1                                                                                     9.4

                                                                                                                                                                        40 60 80 100
     0 20 40 60 80 100

                                                                            0 20 40 60 80 100
             60 80 100

                                                                                    60 80 100
                                       3.2
                                      3.2                                                                                                                                                      4.9
                                                     37.1
                                                    37.1                                               3.8
                                                                                                      3.8             33.8
                                                                 48.3
                                                                48.3                                                 33.8                                                                                      43.5

                                                                                                                                                                         percent
           percent

                                                                                  percent
          percent

                                                                                 percent
                                                     13.6
                                                    13.6                                                              17.4
                                                                                                                     17.4           56.9
                                                                                                                                   56.9                                                          98&06-youth      62.2
                                                                                                                                                                                                             (18-34)
                                                                 9.0
                                                                9.0                                                                                                                                     19.9
                                                                                                                                    11.1
                                                                                                                                   11.1                                                                                  10.2

                                                                                                                                                                     20100

                                                                                                                                                                                                                                         0 20 40 60 80 100
     0 20 40

                                                                            0 20 40
                                                                                                                                                                                              33.0
                                       89.5          49.3        42.7                                  83.1           48.8           32.1                                                     85.7             36.7      27.6

                                                                                                                                                        0 20 40 600 80
                                      89.5          49.3        42.7                                  83.1           48.8           32.1

                                                                                                                                                             percent

                                                                                                                                                                                                                                              percent
                                                                                                                                                                                               9.8
                                                                                                                                                                                             emp_12       unemp_12        72.8
                                                                                                                                                                                                                        OLF_12
                                      emp_98
                                     emp_98        unemp_98
                                                  unemp_98      OLF_98
                                                               OLF_98                                 emp_06
                                                                                                     emp_06         unemp_06
                                                                                                                   unemp_06         OLF_06
                                                                                                                                   OLF_06
                                                                                                                                                                                                               64.6
                                               emp_06
                                              emp_06            unemp_06
                                                               unemp_06                                       emp_12
                                                                                                             emp_12                 unemp_12
                                                                                                                                   unemp_12                                                          emp_18    17.2     unemp_18
                                                                                                                                                                                                                           7.7
                                               OLF_06
                                              OLF_06                                                          OLF_12
                                                                                                             OLF_12                                                                           57.1 OLF_18      18.3        19.5
                                                                                                                                                                                             emp_98       unemp_98       OLF_98
         Figure 2. Transitions between
                      12&18-youth
                     12&18-youth       different working statuses (employment (emp.), unemployment (unemp.) and
                                    (18-34)
                                   (18-34)                                                                      out of labor force
                                                                                                             emp_06            unemp_06
         (OLF)) for9.4                                                                                       OLF_06
                    each two consecutive ELMPS rounds, youth (18-34 years) Source: based on ELMPS 1998, 2006, 2012 and 2018
                    9.4
              20 40 60 80 100
                     60 80 100

                                        4.9
                                       4.9
                                                     43.5
                                                    43.5
                  percent
         60 80 100percent

                                                                 62.2
                                                                62.2
                                        98&06-youth
                                                19.9 (18-34)
                                         98&06-youth
                                               19.9    (18-34)                                              06&12-youth
                                                                                                             06&12-youth(18-34)
                                                                                                                          (18-34)                                                                12&18-youth (18-34)
                                                                 10.2
            0 20 40

                                                                10.2
                                                                                        60 80 100

                                                                                                                                                                    10040 60 80 100
            0 100

                                                                               0 20 40 60 80 100
                                      33.0
                                       85.7
                                        33.0
                                      85.7           36.7
                                                    36.7         27.6
                                                                27.6                                                                                                                          39.9
0 20 40 60 80

                                                                                                       54.2
                                                                                                         54.2
      percent

                                                                                     percent

                                                                                                                                                                       percent
                                      9.8
     percent

                                                                                    percent

                                        9.8
                                      emp_12
                                     emp_12        unemp_12
                                                  unemp_12      OLF_12
                                                               OLF_12
                                                                72.8
                                                                  72.8                                                                                                                         6.2
                                                                                                                        57.1
                                                                                                                          57.1                                                                         62.6
                                               emp_1864.6
                                              emp_18   64.6     unemp_18
                                                               unemp_18
                                                                                                       4.8
                                                                                                         4.8                          74.8
                                                                                                                                        74.8                                                 98&06-prime aged (35-54)
                                                                                                                                                                                                                 77.2
0 20 40

                                                                               0 20 40

                                                     17.2        7.7                                                    22.4
                                                                                                                          22.4
                                               OLF_18 17.2         7.7                                                                11.1
                                                                                                                                        11.1                                               7.0                 24.7        10.5

                                                                                                                                                                                                                                       0 20 40 60 80 100
                                              OLF_18                                                                                                                                   0.8 53.9

                                                                                                                                                     0 20 40 60 080 20
                                     57.1
                                       57.1         18.3
                                                      18.3      19.5
                                                                  19.5                                 41.0
                                                                                                         41.0           20.5
                                                                                                                          20.5        14.2
                                                                                                                                        14.2                                                                   12.6        12.3                              0.8
                                                                                                                                                                                                               43.4

                                                                                                                                                          percent

                                                                                                                                                                                                                                            percent
                                    emp_98
                                      emp_98      unemp_98
                                                    unemp_98   OLF_98
                                                                OLF_98                                emp_06
                                                                                                        emp_06      unemp_06
                                                                                                                      unemp_06       OLF_06
                                                                                                                                      OLF_06                                                 emp_12       unemp_12       OLF_12
                                                                                                                                                                                                               4.3        81.5
                                          emp_06
                                            emp_06             unemp_06
                                                                 unemp_06                                     emp_12
                                                                                                                emp_12               unemp_12
                                                                                                                                       unemp_12                                                       emp_18             unemp_18
                                          OLF_06
                                            OLF_06                                                            OLF_12
                                                                                                                OLF_12                                                                                OLF_18              0.1
                                                                                                                                                                                              92.2             52.3       18.4
                                                                                                                                                                                             emp_98       unemp_98       OLF_98
         Figure 3. Transitions
                    12&18-youthbetween different working statuses (employment (emp.), unemployment (unemp.) and out of labor force
                      12&18-youth(18-34)
                                    (18-34)                                                                 emp_06             unemp_06
         (OLF)) for each two consecutive ELMPS rounds, female youth (18-34 years) Source: based on ELMPS 1998,   2006, 2012 and 2018
                      60 80 100

                                                                                                            OLF_06
               10040 60 80 100

                                     39.9
                                       39.9
                   percent
                  percent

                                      6.2
                                        6.2
                                               62.6
                                     98&06-prime
                                      98&06-prime aged
                                                    aged(35-54)
                                                 62.6    (35-54)
                                                          77.2
                                                            77.2                                       06&12-prime
                                                                                                        06&12-primeaged
                                                                                                                    aged(35-54)
                                                                                                                         (35-54)                                                             12&18-prime aged (35-54)
               10040

                                       7.0
                                        7.0         24.7
                                                      24.7      10.5
                                                                  10.5                                     12.1
                                                                                                            12.1                                                                              8.6
                                                                                        60 80 100
                                                                                0 20 40 60 80 100

                                                                                                                                                                    40 60 80 100
                                  0.8
                                   0.853.9
            80 20
0 20 40 60 080 20

                                        53.9        12.6
                                                      12.6      12.3
                                                                  12.3                              0.8
                                                                                                     0.8                                                                               2.9
                                                    43.4
                                                     43.4
        60 0

                                                                                                                                                                                                                          84.7
     percent
     percent

                                                                                     percent
                                                                                     percent

                                                                                                                                                                    percent

                                    emp_12
                                      emp_12      unemp_12
                                                    unemp_12   OLF_12
                                                                OLF_12                                                                                                                                         47.5
                                                        4.3
                                                         4.3    81.5
                                                                 81.5                                                   60.1
                                                                                                                         60.1                                                                98&06-prime13.9
                                                                                                                                                                                                         aged (35-54)                                          0
                                          emp_18
                                            emp_18             unemp_18
                                                                 unemp_18                                               12.1
                                                                                                                         12.1          88.4
                                                                                                                                        88.4
0 20 40

                                                                                0 20 40

                                                                                                                                                  0 20 40 600 8020100

                                                                                                                                                                                                                                    0 20 40 60 80 100
                                          OLF_18                0.1
                                                                  0.1                                                                                                                      19.6
                                      92.2
                                       92.2
                                            OLF_18
                                                     52.3
                                                      52.3      18.4
                                                                 18.4                                  87.1
                                                                                                        87.1             27.9 1.2
                                                                                                                        27.9   1.2 10.5                                                0.3 88.5                38.6   3.1 82.9
                                                                                                                                    10.5                                                                                   12.2
                                                                                                                                                                                                              71.0
                                                                                                                                                       percent

                                                                                                                                                                                                                                         percent
                                     emp_98
                                      emp_98       unemp_98
                                                    unemp_98   OLF_98
                                                                OLF_98                                emp_06
                                                                                                       emp_06          unemp_06
                                                                                                                        unemp_06      OLF_06
                                                                                                                                       OLF_06                                                emp_12       unemp_12       OLF_12
                                          emp_06
                                           emp_06              unemp_06
                                                                unemp_06                                       emp_12
                                                                                                                emp_12                unemp_12
                                                                                                                                       unemp_12                                                   emp_18 3.7             unemp_18
                                                                                                                                                                                                                         0.1
                                          OLF_06
                                           OLF_06                                                              OLF_12
                                                                                                                OLF_12                                                                       80.1 OLF_1825.3             17.0
                                                                                                                                                                                         emp_98          unemp_98       OLF_98                                 e
         Figure 4. Transitions between different working statuses (employment (emp.), unemployment (unemp.) emp_06
                                                                                                            and out of labor force
                                                                                                                              unemp_06
                 12&18-prime
                   12&18-primeagedaged(35-54)
                                       (35-54)
         (OLF)) for each two consecutive ELMPS rounds, prime-aged (35-54 years) Source: based on ELMPS 1998,    2006, 2012 and 2018
                                                                                                            OLF_06
                                       8.6
                                        8.6
                     60 80 100
 0 20 40 60 80 100 60 80 100

                             2.9
                              2.9
                                                                84.7
                                                                 84.7
                  percent
                  percent

                                                     47.5
                                                      47.5
                                     98&06-prime
                                      98&06-primeaged
                                               13.9aged(35-54)
                                                13.9     (35-54)                                      06&12-prime
                                                                                                       06&12-primeaged
                                                                                                                   aged(35-54)
                                                                                                                         (35-54)                                                             12&18-prime aged (35-54)
                 40
                 40
              20100

                                                                                       60 80 100
                                                                               0 20 40 60 80 100

                                                                                                                                                  0 20 40 60 80 100

                                  19.6
                                   19.6                                                                33.3
                                                                                                        33.3                                                                                 29.8
                             0.3
                               0.388.5               38.6 3.1
                                                           3.182.9
                                                               82.9
              20

                                   88.5             38.6
         600 80

                                                    71.0
                                                     71.0     12.2
                                                               12.2                                                     81.6
                                                                                                                         81.6         89.8
                                                                                                                                       89.8                                                   2.0
      percent
      percent

                                                                                    percent
                                                                                    percent

                                                                                                       0.1
                                                                                                         0.1
                                                                                                                                                       percent
           0

                                     emp_12
                                      emp_12       unemp_12
                                                    unemp_12   OLF_12
                                                                OLF_12                                                                                                                                        71.1        85.6
 0 20 40

                                                                               0 20 40

                                            emp_183.7
                                           emp_18   3.7        unemp_18
                                                                unemp_18
                                                                0.1
                                                                  0.1                                                                                                                                         18.3       3.1
                                      80.1
                                       80.1OLF_18
                                            OLF_1825.3
                                                   25.3         17.0
                                                                 17.0                                  66.6    3.514.9
                                                                                                        66.6 3.5   14.9 1.2
                                                                                                                          1.2
                                                                                                                              9.0
                                                                                                                                9.0                                                          68.2             10.6       11.3
                                     emp_98
                                      emp_98      unemp_98
                                                    unemp_98   OLF_98
                                                                OLF_98                                emp_06
                                                                                                       emp_06       unemp_06
                                                                                                                      unemp_06       OLF_06
                                                                                                                                      OLF_06                                             emp_12          unemp_12       OLF_12
                                          emp_06
                                           emp_06              unemp_06
                                                                 unemp_06                                     emp_12
                                                                                                               emp_12                unemp_12
                                                                                                                                       unemp_12                                                      emp_18             unemp_18
                                          OLF_06
                                           OLF_06                                                             OLF_12
                                                                                                               OLF_12                                                                                OLF_18

         Figure 5.12&18-prime
                   Transitions
                   12&18-prime between
                                aged   different
                                        (35-54) working statuses (employment (emp.), unemployment (unemp.) and out of labor force (OLF))
                                  aged(35-54)
         for each two consecutive ELMPS rounds, female prime-aged (35-54 years) Source: based on ELMPS 1998, 2006, 2012 and 2018
         60 80 100
 0 20 40 60 80 100

                                      29.8
                                       29.8
                                      2.0
                                        2.0
      percent
      percent

                                                    71.1
                                                     71.1       85.6
                                                                 85.6
 0 20 40

                                                     18.3
                                                      18.3      3.1
                                                                  3.1
                                      68.2
                                       68.2          10.6
                                                      10.6
                                                                                                                    9
                                                                11.3
                                                                 11.3
                                     emp_12
                                      emp_12      unemp_12
                                                    unemp_12   OLF_12
                                                                OLF_12
                                          emp_18
                                           emp_18              unemp_18
                                                                 unemp_18
Exploring the vulnerability of jobs obtained by those who transitioned from unemployment to employment       between
                                                                                                        98&06-total
  each two consecutive ELMPS rounds, in terms of informality identified by the lack of a working contract, highlights the
  dominance of informal jobs among both young and prime-aged workers over time [Figures 6, 7 and 8]. The percentage of
  unemployed prime-aged workers who obtain informal jobs between ELMPS 1998 and          2006 and
                                                                                       unemp-emp 33.9
                                                                                                   between66.1
                                                                                                            ELMPS 2006                                               unemp-emp       3
  and 2012 is higher than that of young workers. This implies the spread of informality among workers in the Egyptian labor
  market. Moreover, unemployed prime-aged workers, who could be the main breadwinners in their households, might
  not afford to wait until obtaining a formal job compared to young workers who can depend on0 their20families
                                                                                                          40    60
                                                                                                               for
                                                                                                            percent
                                                                                                                       80   100
                                                                                                                    financial                                                    0

  support.                                                                                                 Yes            No

                           98&06-total
                            98&06-total                                98&06-youth(18-34)
                                                                        98&06-youth(18-34)                                    98&06-prime aged (35-54)

    unemp-emp33.9
  unemp-emp   33.9          66.1
                             66.1                        unemp-emp36.2
                                                       unemp-emp   36.2        63.8
                                                                                63.8                       unemp-emp       25.2        74.8

                                                                                                                                       06&12-total
              0 0   2020    4040 6060     8080 100
                                                 100             0 0   2020    4040 6060     8080 100
                                                                                                    100                   0       20     40     60   80        100
                              percent
                                percent                                          percent
                                                                                   percent                                                 percent
                            Yes
                              Yes            NoNo                              Yes
                                                                                 Yes            NoNo      unemp-emp 45.9                      54.1                   unemp-emp   5
                                                                                                                                          Yes             No

             98&06-prime
              98&06-prime
  Figure 6. Transitions    aged
                        from aged (35-54)
                                    (35-54) to employment (unemp-emp) between ELMPS 1998 and 2006 and the formality
                              unemployment
                                                                                                  0   20    40    60    80   100                                                 0
  of obtained jobs (existence of a working contract), total, youth (18-29 years) and prime-aged (35-54 years) Source:
                                                                                                              percent based on
  ELMPS 1998, 2006, 2012 and 2018                                                                           Yes            No
    unemp-emp25.2
  unemp-emp   25.2     74.8
                        74.8

                         06&12-total
                       06&12-total                                       06&12-youth(18-34)
                                                                       06&12-youth(18-34)                                 06&12-prime aged (35-54)
              0 0   2020    4040 6060     8080 100
                                                 100
                              percent
                                percent

   unemp-emp
unemp-emp    45.9
          45.9                Yes54.1
                             54.1
                            Yes              NoNo         unemp-emp
                                                       unemp-emp    51.4
                                                                 51.4                 48.6
                                                                                   48.6                   unemp-emp       12.4         87.6

                                                                                                                                       12&18-total
          0    0 20 20 40 40 60 60 80 80 100100                 0   0 20 20 40 40 60 60 80 80 100100                  0          20     40     60    80    100
                            percent
                         percent                                                 percent
                                                                              percent                                                     percent

                           YesYes           No No                             YesYes            No No unemp-emp           33.6          66.4
                                                                                                                                         Yes              No         unemp-emp       3

              06&12-prime
  Figure 7.06&12-prime
            Transitions      aged
                           aged
                         from       (35-54) to employment (unemp-emp) between ELMPS 2006 and 2012 and the formality
                                 (35-54)
                              unemployment                                                        0   20    40    60    80   100                                                 0
                                                                                                              percent based on
  of obtained jobs (existence of a working contract), total, youth (18-29 years) and prime-aged (35-54 years) Source:
                                                                                                            Yes            No
  ELMPS    1998,
             12.42006,
          12.4
   unemp-emp
unemp-emp
                        2012 and 2018
                      87.6
                   87.6

                      12&18-total
                        12&18-total                                    12&18-youth(18-34)
                                                                         12&18-youth(18-34)                               12&18-prime aged (35-54)
          0    0 20 20 40 40 60 60 80 80 100100
                            percent
                         percent
unemp-emp  33.6
   unemp-emp 33.6      66.4
                          66.4
                        YesYes              No No      unemp-emp  34.3
                                                          unemp-emp 34.3      65.7
                                                                                65.7                      unemp-emp   38.3               61.7

         0 0 20 20 40 40 60 60 80 80 100100                     0 0 20 20 40 40 60 60 80 80 100100                    0          20     40     60    80    100
                     percent
                        percent                                             percent
                                                                               percent                                                    percent
                           YesYes           No No                              YesYes           No No                                    Yes              No

           12&18-prime
              12&18-prime  aged
                              aged(35-54)
                                    (35-54)
   Figure 8. Transitions from unemployment to employment (unemp-emp) between ELMPS 2012 and 2018 and the formality
   of obtained jobs (existence of a working contract), total, youth (18-29 years) and prime-aged (35-54 years) Source: based on
   ELMPS38.3
unemp-emp
   unemp-emp1998,     61.7
              38.32006,   61.7 and 2018
                         2012
                                                                              10

         0 0 20 20 40 40 60 60 80 80 100100
                     percent
Labor and Politics in MENA

To inspect factors that may affect the transition from unemployment, in particular, to other working statuses, the study
employs a series of multinomial regression models whose aim is to predict the probabilities of leaving unemployment
based on a group of independent variables that include gender, age, area of residence, educational attainment and father’s
level of education. Tables 1, 2 and 3 in the appendix present the results of these models for the transitions between each
two consecutive ELMPS rounds. The analysis highlights the significant continuous impact of gender over the years on
the probability of exiting unemployment with lower odds ratios of transitioning to employment and higher odds ratios of
moving out of the labor force compared to males. Results of the models also show the effect of higher educational levels
which are associated with higher probabilities of transiting from unemployment to out of the labor force compared to
illiterates. Additionally, age does not seem to have a significant impact on leaving unemployment.

The next step in analysis is to investigate unemployment durations and examine the hazards of exiting unemployment
focusing on young workers and using the data of ELMPS 2018. This ELMPS round allows for estimating unemployment
durations using retrospective employment history data for those who have worked before and are new and currently
unemployed, in addition to those who have never worked even if not currently unemployed. Graphs of the Kaplan-
Meier survival function show the higher probabilities of spending longer durations of unemployment among young
females compared to male workers who exit unemployment faster, and the tendency of higher educational levels to exit
unemployment to other working statuses compared to workers with no educational degree [Figure 9].

                                                      Total
                                                                               1.00

                                                                                                                                      1.00
                     1.00

                                                                               0.75

                                                                                                                                      0.75
                     0.75

                                                                               0.50

                                                                                                                                      0.50
                     0.50

                                                                               0.25

                                                                                                                                      0.25
                     0.25

                                                                               0.00

                                                                                                                                      0.00

                                                                                                     0    100    200      300   400          0   100    200      300   400
                     0.00

                                                                                                             analysis time                          analysis time
                                         0    100    200      300   400                                      Male                                  Urban
                                                                                                                           Female                                  Rural
                                                 analysis time
          0.00 0.25 0.50 0.75 1.00

                                                                          0.00 0.25 0.50 0.75 1.00

                                     0       100    200      300    400                              0    100    200      300   400
                                                analysis time                                                analysis time

                                             No_educ.     Intermed.                                   No_educ.      Intermed.
                                             Univ.+                                                      Univ.+

Figure 9. The Kaplan-Meier Survival Function (proportion remaining unemployed), youth (18-34 years), total and by gender,
area, educational level, and father’s education, ELMPS 2018

                                                                                                                  11
In addition, fitting a Cox proportional hazards model by using the data of workers from all age groups shows that young
compared to prime-aged workers; females compared to males; and workers with no educational degree relative to those
who hold one, all tend to spend longer times in unemployment [Table 4 in the Appendix]. Figure 10 shows the Kaplan-
Meier Survival estimates by age group based on the results of the Cox proportional hazards model and refers to the higher
survival rates in the state of unemployment among young compared to prime-aged workers.

                                          Kaplan-Meier survival estimates
                1.00
                0.75
                0.50
                0.25
                0.00

                       0                           200                           400                            600
                                                             analysis time

                                               Prime-aged(35-54)                 Youth(18-34)
                                               Otherwise

Figure 10. The Kaplan-Meier Survival estimates by age group based on the results of the Cox proportional hazards model for
predicting the probability of exiting unemployment, ELMPS 2018

Since the survival analysis of unemployment here examines discrete time units, the Cox proportional hazards model might
not be very appropriate to analyze the unemployment dynamics. Therefore, the study fits a complementary log-log model to
examine factors that affect the probability of separation from first unemployment (exit to employment or out of labor force)
among young workers. The model is first estimated using Gamma frailty [Table 5 in the Appendix], which accounts for
individual heterogeneity, if existing in the data; however, results of the test of rho = 0 indicates that frailty is not significant.

Table 6 in the Appendix shows that, for young workers, spending more time in unemployment is associated with higher
probability of remaining unemployed. Females have higher probabilities of remaining unemployed compared to males.
In addition, young workers with intermediate or above levels of education experience higher probabilities of remaining
unemployed compared to having no education. Furthermore, young workers whose fathers are university graduates have
higher probabilities of remaining unemployed compared to young workers whose fathers are illiterates. The margins plots
associated with the model are also displayed in Figure 11.

                                                                 12
Labor and Politics in MENA

                                           Predictive Margins of sex with 95% CIs                                                                                        Predictive Margins of urban/rural with 95% CIs
                    .011

                                                                                                                                  .0075 .008 .0085 .009 .0095 .01
                                                                                                                 Pr(Unemployed)
          Pr(Unemployed)
                    .01
                    .009
                    .008
                    .007

                              Male                                                                  Female                                                          Urban                                                                   Rural
                                                                    Sex                                                                                                                              Urban/Rural

                           Predictive Margins of educational attainment with 95% CIs                                              Predictive Margins of father's level of education with 95% CIs
                     .02

                                                                                                                                  .02
          Pr(Unemployed)

                                                                                                                     Pr(Unemployed)
                     .015

                                                                                                                                  .015
                     .01

                                                                                                                                  .01
                     .005

                                                                                                                                  .005
                     0

                                                                                                                                  0

                             Illiterate            Below Intermediate    Above Intermediate         Post-Grad.                                                      Illiterate            Below Intermediate    Above Intermediate         Post-Grad.
                                          Reads & Writes         Intermediate            University                                                                              Reads & Writes         Intermediate            University
                                                                                                                                                                                          Father's Level of education
                                                      Educational Attainment

Figure 11. The margins plots of the categorical independent variables included in the complementary log-log model for
predicting the probability of exiting unemployment among young workers, ELMPS 2018

Conclusion

The main aim of this paper was to analyze the employment dynamics among young workers in Egypt and compare these
dynamics to workers of older age groups. Data used in analysis came from the different ELMPS rounds carried out in the
years of 1998, 2006, 2012 and 2018. Results highlighted the difficulty of transiting from unemployment to employment
among all age cohorts especially in the recent years that followed the eruption of the Arab Spring in Egypt in 2011. Age is
also not related to moving from unemployment to employment in the Egyptian labor market and older workers are not
offered better jobs compared to the young ones. This was shown through the high incidence of informality among prime-
age workers who lost their jobs during one ELMPS round and went back to employment in the next round. While some
young workers do not easily accept employment in the informal sector as they can resort to their families for financial
support, prime-age workers, who could be the main breadwinners in their households, might not afford to wait until
obtaining a formal job.

Results also revealed some chronic issues inherent in the Egyptian labor market over time, including the steady movement
of females out of the labor force and the tendency of workers with higher educational levels to step out of the job market
compared to workers with no educational background. The analysis highlighted the continuously significant impact

                                                                                                             13
of gender over the years on the probability of exiting            Assaad, Ragui, Rana Hendy, Moundir Lassassi, and
unemployment with lower odds ratios of transitoning to            Shaimaa Yassin. “Explaining the MENA Paradox: Rising
employment and higher odds ratios of moving out of the            Educational Attainment, Yet Stagnant Female Labor Force
labor force for female workers compared to males. Higher          Participation.” Demogr Res. 43 (2020): 817–50. https://doi.
educational levels were also found to be associated with          org/10.4054/demres.2020.43.28.
higher probabilities of transiting from unemployment to
out of the labor force. In addition, young workers with           Assaad, Ragui, and Caroline Krafft. “Excluded Generation:
intermediate or above levels of education experience              The Growing Challenges of Labor Market Insertion for
higher probabilities of remaining unemployed compared             Egyptian Youth.” Journal of Youth Studies 24, no. 2 (2021):
to those with no education. Furthermore, young workers            186–212. https://doi.org/10.1080/13676261.2020.1714565.
whose fathers are university graduates have higher
probabilities of remaining unemployed compared to young           ———. “Labor Market Dynamics and Youth
workers whose fathers did not receive any education.              Unemployment in the Middle East and North Africa:
These results emphasize the problems of mismatch                  Evidence from Egypt, Jordan and Tunisia.” Working Paper
between job supply and demand; the insufficient formal            993. Giza, Egypt, 2016.
job creation in the Egyptian labor market; and the lack of
competency suffered by the educational system to improve          Ciucǎ, Vasilica, and Monica Matei. “Survival Analysis
the employability among its graduates. Moreover, young            for the Unemployment Duration.” Proceedings of the
workers with better educational outcomes who also belong          5th WSEAS International Conference on Economy and
to families with higher educational backgrounds can afford        Management Transformation I (2010): 354–59.
staying unemployed or leaving the labor force, which
reflects the strong link between education and wealth that        Cox, D. R. “Regression Models and Life-Tables.” Journal of
still persists in Egypt.                                          the Royal Statistical Society. Series B (Methodological) 34,
                                                                  no. 2 (1972): 187–220.

                                                                  Danish Trade Union Development Agency. “Egypt
References                                                        Labour Market Profile 2020/2021,” 2020. https://www.
                                                                  ulandssekretariatet.dk/wp-content/uploads/2020/09/LMP-
AlAzzawi, Shireen, and Vladimir Hlasny. “Vulnerable               Egypt-2020-final1.pdf.
Employment of Egyptian, Jordanian, and Tunisian Youth:
Trends and Determinants.” Helsinki, Finland, 2020.                Economic Research Forum, and Central Agency For
                                                                  Public Mobilization & Statistics (CAPMAS). “Egypt Labor
Angel-Urdinola, Diego, and Amina Semlali. “Labor                  Market Panel Survey, ELMPS (2012),” 2013. http://www.
Markets and School-to-Work Transition in Egypt:                   erfdataportal.com/index.php/catalog.
Diagnostics, Constraints, and Policy Framework.”
Economic Policy, 2010. http://mpra.ub.uni-muenchen.               ———. “Egypt Labor Market Panel Survey, ELMPS (2018),”
de/27674/.                                                        2019.

Assaad, Ragui. “Unemployment and Youth Insertion in               Flek, Vladislav, and Martina Mysíková. “Youth Transitions
the Labor Market in Egypt,” 2007. https://doi.org/10.5743/        and Labour Market Flows- Who Moves & How?” STYLE
cairo/9789774161544.003.0005.                                     Working Papers, WP5.2. CROME. Brighton, 2016. http://
                                                                  www.style-research.eu/publications.

                                                             14
Labor and Politics in MENA

Gadallah, May. “Factors of Career Mobility in Egypt by            ———. “Labor Market Panel Surveys (LMPS).” Egypt:
Gender.” Cairo, Egypt, 2011.                                      Economic Research Forum (ERF), 2016. http://erf.org.eg/
                                                                  data-portal/.
Hosmer, David W, and Stanley Lemeshow. Applied Logistic
Regression. Second Edi. John Wiley & Sons, Inc., 2000.            Stock, James H., and Mark W. Watson. Introduction to
                                                                  Econometrics. Boston: Pearson Addison Wesley, 2003.
Jenkins, Stephen P. Discrete Time Proportional Hazards
Regression. Edited by H. Joseph Newton, Francis X.                Williams, Richard. “Multinomial Logit Models - Overview,”
Diebold, Joanne M. Garrett, Marcello Pagano, James L.             2019. https://www3.nd.edu/~rwilliam/.
Powell, and J. Patrick Royston. Stata Technical Bulletin,
1997.                                                             Appendix

———. “Estimation of Discrete Time (Grouped Duration               Multinomial logistic regression is an extension of the
Data) Proportional Hazards Models: Pgmhaz,” 2004.                 logistic regression. In general, the multiple logistic
                                                                  regression model analyzes binary dependent variables. It
———. “Survival Analysis with Stata,” 2008. http://www.            uses a vector of p independent variables X'=(x1,x2,…,xp)
iser.essex.ac.uk/survival-analysis.                               to predict the probability of the binary dependent
                                                                  variableassuming the value of one. Therefore, the multiple
Kelly, Elish, Seamus McGuinness, Philip J. O’Connell,             logistic model can be written as:
David Haugh, and Alberto González Pandiella.
“Transitions in and out of Unemployment among Young
People in the Irish Recession.” Comparative Economic
Studies 56, no. 4 (2014): 616–34. https://doi.org/10.1057/        where g(X)=β­+β1x1+…+βp xp. The model can also be
ces.2014.23.                                                      represented in terms of a log odds ratio as follows:

Krafft, Caroline, Ragui Assaad, and Khandker W. Rahman.
“Introducing the Egypt Labor Market Panel Survey 2018.”
ERF Working Paper Series. Giza, Egypt, 2019. https://erf.         The main goal is to estimate the coefficients of the model,
org.eg/publications/introducing-the-egypt-labor-market-           which include β0, the constant term, as well as β1,β2,…,βp,
panel-survey-2018/.                                               which measure the impact of each independent variable
                                                                  on the dependent dummy (Hosmer and Lemeshow 2000;
Menard, Scott. Applied Logistic Regression Analysis (Vol.         Menard 2002; Stock and Watson 2003).
106). Sage, 2002.
                                                                  The multinomial regression model estimates the
Nilsson, Björn. “The School-to-Work Transition in                 probabilities for unordered categorical variables. This
Developing Countries.” Journal of Development Studies 55,         model calculates the probability that the dependent
no. 5 (2019): 745–64. https://doi.org/10.1080/00220388.20         variable belongs to a certain group or category given the
18.1475649.                                                       vector of predictor variables as follows:

OAMDI. “Labor Market Panel Surveys (LMPS).” Egypt:
Economic Research Forum (ERF), 2013. http://www.erf.
org.eg/cms.php?id=erfdataportal.                                  where gi(X)=βi0+βi1x1+…+βipxp assuming that the first
                                                                  reference category takes the code of zero. The probability that

                                                             15
the dependent variable belongs to the reference group is:              Table 1. Results of the multinomial logistic regression model
                                                                       for predicting the probability of exiting unemployment
                                                                       between ELMPS 1998 and 2006

The log odds ratio for belonging to category m compared                                          unemp98_emp06          unemp98_OLF06
                                                                        VARIABLES                relative risk ratios   relative risk ratios
to the reference or base category is:
                                                                        Sex: ref. Male
                                                                        Female                        0.134***               12.69***
                                                                                                      (0.0377)               (5.017)
                                                                        Age_group_06: ref. youth(18-34)
Therefore, the study employs the multinomial logistic                   prime-age(35-54)                1.622                  1.002
regression to analyze the determinants of transitioning                                                (0.582)                (0.352)
from unemployment to other statuses for each sub-panel                  Urban/Rural: ref. Urban
of ELMPS where a sub-panel include each two consecutive                 Rural                           1.325                  1.356
                                                                                                       (0.408)                (0.412)
ELMPS rounds from 1998 until 2018.
                                                                        Educational Attainment: ref. Illiterate
                                                                        Reads & Writes                464,382                685,126
Moreover, the paper analyzes unemployment durations                                                 (5.653e+08)            (8.341e+08)
using survival analysis. Survival analysis aims to estimate a           Less than                     415,731                870,581
hazard rate function is defined as follows:                             Intermediate                (2.786e+08)            (5.833e+08)
                                                                        Intermediate                  0.127**                0.123**
                                                                                                      (0.133)                (0.131)
                                                                        Above Intermediate             0.119*                 0.119*
                                                                                                       (0.135)                (0.136)
where λit is the hazard rate function for observation i and             University                     0.116*               0.0500***
failure time t and λ0 is the baseline hazard function; X refers                                        (0.128)              (0.0570)
to the vector of explanatory variables used in the model and            Post-Graduate                1.390e+06                 0.220
                                                                                                    (3.886e+09)               (683.9)
β is the vector of parameters to be estimated (Jenkins 1997,
                                                                        Father’s Level of education: ref. Illiterate
2004; Cox 1972). In this regard, the paper uses the term
                                                                        Reads & Writes                  1.324                2.049**
hazard rate to define the probability of exiting unemployment,                                         (0.497)               (0.745)
whereas survival here refers to remaining unemployed. The               Less than                       1.472                  1.034
paper fits a proportional hazard model, which is one of the             Intermediate                   (0.573)                (0.404)
most common survival analysis techniques used to examine                Intermediate                   0.942                  0.799
unemployment durations in the literature (Nilsson 2019).                                               (0.411)                (0.351)
                                                                        Above Intermediate              1.831                  3.385
                                                                                                       (1.603)                (2.795)
Finally, the paper examines factors that affect the
                                                                        University                      2.994                  2.610
probability of separation from unemployment (exit to                                                   (2.237)                (1.917)
employment or out of labor force) using a complementary                 Constant                      40.33***                 1.941
log-log model for binary dependent variables assuming the                                             (42.82)                 (2.164)
following functional form:                                              Observations                    684                    684
                                                                       Standard errors in parentheses
                                                                       *** p
Labor and Politics in MENA

Table 2. Results of the multinomial logistic regression model                Table 3. Results of the multinomial logistic regression model
for predicting the probability of exiting unemployment                       for predicting the probability of exiting unemployment
between ELMPS 2006 and 2012                                                  between ELMPS 2012 and 2018

                          unemp06_emp12          unemp06_OLF12                                         unemp12_emp18          unemp12_OLF18
 VARIABLES                relative risk ratios   relative risk ratios         VARIABLES                relative risk ratios   relative risk ratios
 Sex: ref. Male                                                               Sex: ref. Male
 Female                   0.0823***              21.57***                     Female                   0.0701***              4.897***
                          (0.0208)               (10.36)                                               (0.0165)               (1.403)
 Age_group_12: ref. youth(18-34)                                              Age_group_18: ref. youth(18-34)
 prime-age(35-54)         1.040                  1.546                        prime-age(35-54)         1.227                  0.864
                          (0.323)                (0.430)                                               (0.271)                (0.158)
 Urban/Rural: ref. Urban                                                      Urban/Rural: ref. Urban
 Rural                    1.506*                 0.936                        Rural                    0.917                  0.834
                          (0.369)                (0.214)                                               (0.193)                (0.148)
 Educational Attainment: ref. Illiterate                                      Educational Attainment: ref. Illiterate
 Reads & Writes           0.173                  0.113                        Reads & Writes           1.240                  1.082
                          (0.235)                (0.215)                                               (1.571)                (1.318)
 Less than                2.140                  1.523                        Less than                0.302                  0.368
 Intermediate             (3.145)                (2.460)                      Intermediate             (0.234)                (0.273)
 Intermediate             0.447                  0.119*                       Intermediate             0.345                  0.206**
                          (0.480)                (0.144)                                               (0.230)                (0.130)
 Above Intermediate       0.692                  0.0941*                      Above Intermediate       0.364                  0.178**
                          (0.796)                (0.120)                                               (0.277)                (0.125)
 University               1.259                  0.0634**                     University               0.492                  0.109***
                          (1.386)                (0.0785)                                              (0.340)                (0.0713)
 Post-Graduate            0.226                  0                            Post-Graduate            0.927                  0.0190***
                          (0.398)                (3.77e-07)                                            (0.968)                (0.0252)
 Father’s Level of education: ref. Illiterate                                 Father’s Level of education: ref. Illiterate
 Reads & Writes           0.823                  0.590*                       Reads & Writes           1.207                  1.202
                          (0.271)                (0.178)                                               (0.393)                (0.317)
 Less than                0.942                  0.702                        Less than                0.951                  0.882
 Intermediate             (0.314)                (0.226)                      Intermediate             (0.294)                (0.228)
 Intermediate             0.700                  0.689                        Intermediate             1.034                  0.755
                          (0.250)                (0.230)                                               (0.314)                (0.192)
 Above Intermediate       5.374                  1.303                        Above Intermediate       1.324                  1.089
                          (5.946)                (1.501)                                               (0.959)                (0.668)
 University               0.482*                 0.714                        University               0.669                  1.112
                          (0.211)                (0.312)                                               (0.282)                (0.412)
 Post-Graduate            69,049                 15.15                        Post-Graduate            0.214                  2.00e-06
                          (5.820e+07)            (15,276)                                              (0.272)                (0.00213)
 Constant                 14.87**                1.628                        Constant                 19.55***               4.281**
                          (15.73)                (1.928)                                               (13.38)                (2.843)
 Observations             876                    876                          Observations             1,118                  1,118

Standard errors in parentheses, *** p
Table 4. Results of the Cox proportional hazards model for              Table 5. Results of the complementary log-log model for
predicting the probability of exiting first unemployment,               predicting the probability of exiting first unemployment
ELMPS 2018                                                              among young workers with Gamma frailty, ELMPS 2018

                         (1)                    (2)                                               (1)                   (2)
                         analysis time          analysis time                                     Exiting               Exiting
                         when record ends       when record ends                                  unemployment          unemployment
 VARIABLES               Model coefficients     hazard ratios            VARIABLES                Model Coefficients    Odds Ratios
 Age_group: ref. prime-aged(35-54)                                       Log (time)               0.250***              1.284***
 youth(18-34)            -0.170***              0.844***                                          (0.0309)              (0.0398)
                         (0.0487)               (0.0411)                 Sex: ref. Male
 otherwise               0.165**                1.179**                  Female                   0.229***              1.257***
                         (0.0752)               (0.0886)                                          (0.0685)              (0.0860)
 Sex: ref. Male                                                          Urban/Rural: ref. Urban
 Female                  -1.341***              0.262***                 Rural                    0.0935                1.098
                         (0.0500)               (0.0131)                                          (0.0634)              (0.0696)
 Urban/Rural: ref. Urban                                                 Educational Attainment: ref. Illiterate
 Rural                   0.0432                 1.044                    Reads & Writes           -0.0316               0.969
                         (0.0458)               (0.0478)                                          (0.296)               (0.286)
 Educational Attainment: ref. Illiterate                                 Less than                0.252                 1.287
                                                                         Intermediate
 Reads & Writes          0.276                  1.318
                                                                                                  (0.216)               (0.278)
                         (0.201)                (0.265)
                                                                         Intermediate             0.595***              1.814***
 Less than               0.613***               1.847***
 Intermediate                                                                                     (0.185)               (0.335)
                         (0.167)                (0.308)                  Above Intermediate       0.485**               1.624**
 Intermediate            0.882***               2.416***                                          (0.236)               (0.383)
                         (0.156)                (0.376)                  University               0.913***              2.493***
 Above Intermediate      1.092***               2.981***                                          (0.192)               (0.480)
                         (0.179)                (0.534)                  Post-Graduate            1.079***              2.942***
 University              1.280***               3.595***                                          (0.288)               (0.847)
                         (0.160)                (0.575)                  Father’s Level of education: ref. Illiterate
 Post-Graduate           1.601***               4.960***                 Reads & Writes           -0.0311               0.969
                         (0.231)                (1.146)                                           (0.103)               (0.0996)
 Father’s Level of education: ref. Illiterate                            Less than                0.168*                1.183*
                                                                         Intermediate             (0.0968)              (0.115)
 Reads & Writes          0.0289                 1.029
                         (0.0646)               (0.0664)                 Intermediate             0.436***              1.547***
                                                                                                  (0.0831)              (0.129)
 Less than               0.102                  1.108
 Intermediate            (0.0661)               (0.0732)                 Above Intermediate       0.0358                1.036
 Intermediate            -0.0554                0.946                                             (0.205)               (0.212)
                         (0.0720)               (0.0681)                 University               0.351***              1.421***
 Above Intermediate      0.0939                 1.098                                             (0.116)               (0.164)
                         (0.140)                (0.154)                  Post-Graduate            0.382                 1.466
 University              0.0484                 1.050                                             (0.384)               (0.563)
                         (0.0894)               (0.0938)                 Constant                 -6.633***             0.00132***
 Post-Graduate           -1.254*                0.285*                                            (0.234)               (0.000308)
                         (0.710)                (0.203)                  Observations             125,404               125,404
 Observations            3,546                  3,546                    Number of groups         2,100                 2,100
Standard errors in parentheses, *** p
Labor and Politics in MENA

Table 6. Results of the complementary log-log model for
predicting the probability of exiting first unemployment
among young workers, ELMPS 2018

                        (1)                     (2)
 VARIABLES              Exiting                 Exiting
                        unemployment            unemployment
                        Model Coefficients      Odds Ratios
 Log (time)             0.250***                1.284***
                        (0.0389)                (0.0500)
 Sex: ref. Male
 Female                 0.229***                1.257***
                        (0.0677)                (0.0851)
 Urban/Rural: ref. Urban
 Rural                  0.0935                  1.098
                        (0.0642)                (0.0705)
 Educational Attainment: ref. Illiterate
 Reads & Writes         -0.0316                 0.969
                        (0.297)                 (0.288)
 Less than              0.252                   1.287
 Intermediate           (0.218)                 (0.280)
 Intermediate           0.595***                1.814***
                        (0.184)                 (0.335)
 Above Intermediate     0.485**                 1.624**
                        (0.236)                 (0.384)
 University             0.913***                2.493***
                        (0.192)                 (0.479)
 Post-Graduate          1.079***                2.942***
                        (0.290)                 (0.855)
 Father’s Level of education: ref. Illiterate
 Reads & Writes         -0.0311                 0.969
                        (0.103)                 (0.0996)
 Less than              0.168*                  1.183*
 Intermediate           (0.0970)                (0.115)
 Intermediate           0.436***                1.547***
                        (0.0842)                (0.130)
 Above Intermediate     0.0358                  1.036
                        (0.206)                 (0.213)
 University             0.351***                1.421***
                        (0.116)                 (0.165)
 Post-Graduate          0.382                   1.466
                        (0.384)                 (0.562)
 Constant               -6.633***               0.00132***
                        (0.257)                 (0.000338)
 Observations           125,404                 125,404

Robust standard errors in parentheses,
*** p
COVID-19 and Algeria’s Labor Movement
Ashley Anderson, University of North Carolina, Chapel Hill

Introduction                                                          highly repressive regime. Perhaps counterintuitively, the
                                                                      coronavirus lockdown has provided a unique opportunity
On March 10, 2019, public sector workers poured into the              for unions to reframe their grievances against the
streets of Algiers in one of the first labor demonstrations of        government, diversify their tactics, and strengthen their
Algeria’s 2019 hirak movement. Spurred by the demands                 grassroots organizing, enabling certain sectors of the
of pro-democracy activists and independent trade unions,              labor movement to reach a much broader audience and
tens of thousands of workers stayed home to begin a                   pose an even greater threat to the regime. Thus, despite
five-day general strike against the Bouteflika government,            the temporary suspension of visible mobilization by labor
marking a pivotal turning point in the movement to end                unions, the pandemic has not posed an existential threat
Algeria’s 60-year military regime. Yet, barely a year later,          to the success of labor opposition writ large. Instead, the
the very same streets were empty, as the onset of the                 scaling back of public demonstrations has ushered in a
COVID-19 pandemic forced the government to issue a                    new era of collective action that I term collective activism
ban on all public demonstrations. This article analyzes the           among frontline and public sector workers that is likely
impact of the COVID-19 pandemic on labor mobilization                 to bolster labor mobilization efforts once the pace of the
in Algeria by discussing the challenges that government               pandemic has slowed.
restrictions have posed to the labor movement and the
ways in which unions have strategically adapted to this               The COVID 19 pandemic: A new challenge for labor
novel political circumstance.                                         opposition

Recent scholarship on the political impact of the                     The main challenge that the COVID-19 pandemic places
COVID-19 crisis suggests that the pandemic has                        upon labor movements everywhere is that it strikes at
opened a “window of opportunity” for governments to                   the very essence of trade unions’ strength: their ability to
more effectively repress activist movements without                   disrupt economic activity through public demonstrations.
attracting unwanted pressure from citizens and the                    While organized labor in Algeria has generally been
international community.1 As Eck and Hatz (2020) and                  viewed as passive relative to its North African counterparts
Grasse, Pavlik and Matfess (2020) show, governments                   in Tunisia and Egypt, strike activity has always formed a
have intensified their repressive campaigns in the wake               critical component of labor’s mobilization strategy vis-
of COVID lockdowns, using the public health emergency                 a-vis the regime and has been essential to its success in
instrumentally to surveil upon citizens and repress protests          key moments of the nation’s history. Indeed, the country’s
in known areas of dissent.2 3 At the same time, global crises         principal union, the UGTA, was born during the Algerian
such as the COVID pandemic may provide a temporary                    revolution as a way to mobilize workers in opposition
boost to government legitimacy as politicians employ crisis           to the French colonial regime. Even after independence,
frames to produce a “rally around the flag effect.”4                  when the union was subordinated to the state under the
                                                                      political leadership of the National Liberation Front (FLN),
While many may view Algeria’s lockdown as a boon for                  strikes served as an important way for workers to preserve
the government in its efforts to regain its hold onto power           their gains during periods of economic crisis (e.g 1977-
during the hirak, I argue that the COVID-19 pandemic                  1982) and avoid further cutbacks as a result of structural
has actually enabled the Algerian labor movement                      adjustment.5
to strengthen its protest mobilization in the face of a

                                                                 20
You can also read