Philadelphia's Labor Market - April 2021 Data Performance and Labor Market Information Team - Philadelphia Works
←
→
Page content transcription
If your browser does not render page correctly, please read the page content below

Executive
Philadelphia’s Labor Market                          Summary ........... 0
April 2021

Data Performance and Labor Market Information Team

Using the latest available data, this quarterly
                                       update offers insight into Philadelphia’s labor
                                       market, industry mix, and economic
Contents                               development.

Executive Summary                 1    In 2018, Philadelphia’s institutional and community leaders col-
                                       laborated to develop a comprehensive workforce development
Special Note: COVID-19 Pandemic   2    strategy. This document, Fueling Philadelphia’s Talent Engine, calls
                                       on Philadelphia Works, Inc. to serve as the city’s hub of labor market
                                       and economic reporting and analysis. Under this mandate, this
Overall Employment                3
                                       quarterly report provides insight into key measures of economic
                                       activity, providing leaders across public and private institutions an
Private Industry                  7    easy-to-access update on how Philadelphia’s economy and labor
                                       force continue to evolve.

Occupational Employment           12
                                       For more insight into Philadelphia’s labor force, economic
Employer Demand                   16   characteristics, and the ongoing recovery from the COVID-19
                                       employment crisis, visit the Data and Trends page of our website.
Philadelphia’s Labor Force        22

                                       Our Mission
                                       Philadelphia Works, Inc. develops and manages smart
                                       workforce solutions that respond to business needs and
                                       increase economic opportunity for all Philadelphia
                                       residents.
State of the Labor Market | Special Note on COVID-19 Impacts in
Philadelphia
    State of the Labor Market
   State   of the
    “Continued      Labor
               economic     Market
                        growth is critical to the future of our city
     and region, and is dependent upon a strong, skilled workforce.”
   “Continued     economic growth is critical to the future of our city
     Fueling Philadelphia’s Talent Engine
   and region, and is dependent upon a strong, skilled workforce.”
   Fueling Philadelphia’s Talent Engine
    Executive Summary
    • Philadelphia’s labor market continues to experience the effects of the COVID-
      19 pandemic and economic crisis. As of February 2021, more than 66,000
      Philadelphia residents have lost employment. Nevertheless, there are signs
      of improvement, with overall employment and labor force participation
      rising.

    • By industry, the Accommodation and Food Service sector has experienced
      the most significant impacts, losing more than 30,000 jobs since February
      2020. As vaccination rates have increased, however, we have seen strong
      growth in service-sector employment.

    • Despite concentrated losses among low-wage and low-skill employment,
      demand remains strong for high-skill workers, especially in healthcare and
      information technology.

    • Beyond the current crisis, Philadelphia’s economy struggles with economic
      and racial injustice. By race and ethnicity, non-white Philadelphians continue
      to experience disproportionately negative employment outcomes.

                                                                                                                                   1 CC BY-SA
                                                                                       This Photo by Unknown Author is licensed under
State of the Labor Market | Special Note on COVID-19 Impacts in
Philadelphia

   Special Note on COVID-19 Impacts in Philadelphia

   Due to constraints on the timeliness of available data, many of   Weekly Initial Claims for State Unemployment Benefits by Philadelphia
   the figures included in this report reflect pre-recession and     Residents: January 2020 to February 2021
   pre-pandemic conditions. While the long-term effects of the
   COVID-19 employment crisis remain unknown, other                                                       40,000
   reporting and analysis conducted by Philadelphia Works has
   shown where immediate impacts are being felt. Black and                                                35,000
   African American workers, young workers, and those
   employed in low-wage service sectors have been dis-                                                    30,000

                                                                     Weekly Initial Unemployment Claims
   proportionately affected by the current crisis. In many ways,
   these recent trends reinforce and exacerbate the economic                                              25,000
   inequities already occurring in Philadelphia.
                                                                                                          20,000
   Since March 15, 2020, more than 260,000
   Philadelphians have submitted unemployment
                                                                                                          15,000
   claims with the state of Pennsylvania.
   An unknown number more have filed for emergency                                                        10,000
   pandemic unemployment compensation through the federal
   government. While most of these initial claims were filed in                                            5,000
   March and April, thousands of Philadelphians continue to
   receive unemployment benefits, experiencing either total                                                   0
   unemployment or a reduction in hours.

                                                                                                                                             2
State of the Labor Market | Special Note on COVID-19 Impacts in
  Philadelphia

                          Overall Employment

This Photo by Unknown Author is licensed under CC BY-SA             3
State of the Labor Market | Overall Employment

  Overall Employment
   Since 2007, just prior to the Great Recession, employment in           As of February 2021, the overall employment of Philadelphia
   Philadelphia has witnessed strong growth. By February 2020, the        residents had declined by more than 66,000.
   total number of employed Philadelphians had grown by more than
                                                                          As vaccination rates across the country have increased, however,
   120,000 individuals, a 20% increase over pre-recession levels
                                                                          employment opportunities have also grown. In recent months in
   (Figures 1 and 2). More recently, the COVID-19 economic crisis has
                                                                          particular, we have seen stronger growth among hard-hit
   had major impacts on employment and labor force participation in
                                                                          industries and occupations.
   the city.

   Figure 1: Labor Force and Total Employment in Philadelphia: January 2007 to February 2021

   Source: Philadelphia Works Analysis of BLS, LAUS                                                                                          4
State of the Labor Market | Overall Employment

   In the second quarter of 2020, Philadelphia’s       Figure 2: Relative Change in Employment: January 2007 to February 2021
   unemployment rate peaked at more than 18%,
   roughly two percentage points higher than that of
   the state and four percentage points higher than
   that of the United States overall (Figure 3).

   While unemployment rates have improved, they
   have not returned to pre-COVID levels. As of
   February 2021, the city’s unemployment rate
   remained at 11.2%.

                 11.2%
                   February 2021                       Figure 3: Unemployment Rate: January 2007 to February 2021
                 Unemployment Rate

             -66,100
             Decline in Employment
         February 2020 to February 2021

   Source: Philadelphia Works Analysis of BLS, LAUS                                                                             5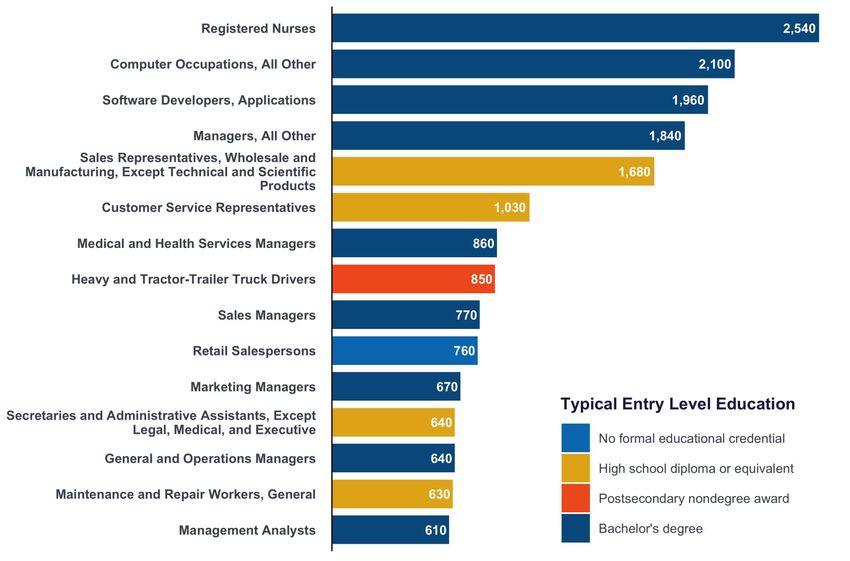
State of the Labor Market | Overall Employment

   In Philadelphia, service sectors, including hard-hit Food Service and   Though year-over-year employment remains down across all
   Accommodation establishments, have been among the largest               industries, these more recent patterns of growth indicate a
   contributors to recent employment growth.                               relatively strong recovery. As vaccination rates increase and the risk
                                                                           of serious infection falls, demand for service sector employment is
   In February 2021, Philadelphia employers added about 11,000 new
                                                                           likely to increase.
   jobs to their payrolls. More than half of these were in the
   Educational Services sector, while nearly one-third were in the         For the most up-to-date employment information, visit the Data
   Leisure and Hospitality sector (Table 1).                               and Trends page of our website.

     Table 1: Change in Employment by Industry Sector, February 2021

   Source: Philadelphia Works Analysis of PA CWIA, Non-Farm Payroll                                                                                 6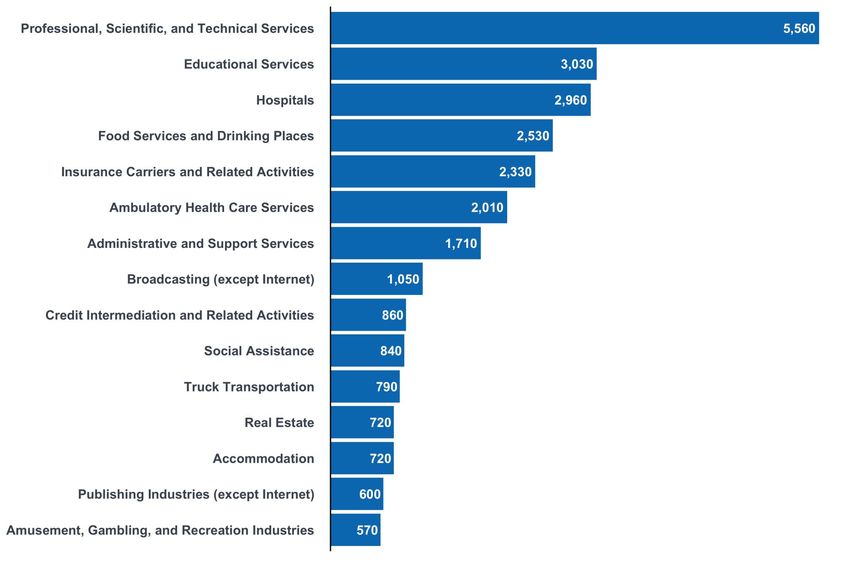
State of the Labor Market | Overall Employment

                                              Private Industry

This Photo by Unknown Author is licensed under CC BY-NC-ND       7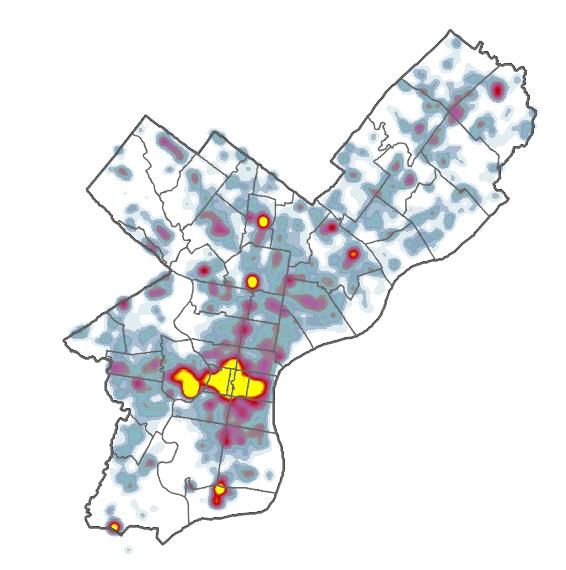
State of the Labor Market | Private Industry: Q3 2020

                                                                Figure 4: Annual and Quarterly Change in Private Employment by Industry Sector: Q3 2020
  Private Industry: Q3 2020
   The COVID-19 pandemic and resulting economic crisis
   have had uneven effects across Philadelphia’s economy.
   By industry, service sectors have seen the most sig-
   nificant overall job losses.

   However, despite its year-over-year decline, Accom-
   modation and Food Service employment grew by about
   8,000 jobs in the third quarter of 2020. Though we have
   seen more modest increases in recent months, the
   industry’s growth last summer indicates its potential to
   recover once social distancing measures are relaxed.

   Similar patterns can be seen in other heavily affected
   sectors, such as Educational Services and Retail Trade. No
   industry sector experienced significant declines in the
   third quarter of 2020.

          Federal QCEW data are released
          with a six-month delay. For more
        recent employment figures, visit the
          Current Labor Market Conditions
                page of our website.

   Source: Philadelphia Works Analysis of BLS, QCEW                                                                                              8
State of the Labor Market | Private Industry: Q3 2020
Table 2: Largest Employment Growth Over Previous Quarter: Q3 2020
Where the chart in Figure 4 shows high-level industry
sectors, Table 2 and Table 3 show both employment
growth and decline for more detailed sectors. The
third quarter growth in Accommodation and Food
Service employment, for example, is made up almost
entirely of Food Service workers, further suggesting
the industry’s potential for recovery.
Economic Base and Specialization
Philadelphia’s economy and labor force are anchored
by key institutions in education and health care. By
Table 3: Largest Employment Declines Over Previous Quarter: Q3 2020 industry, private-sector employment in Educational
Services, Hospitals and Health Care, and Professional
and Technical Services serve as the city’s economic
base. Combined, these sectors employ nearly half of
all Philadelphia workers (Table 4).
Compared to the United States overall, Philadelphia’s
economy is heavily specialized in Educational Services,
Air Transportation, Arts and Entertainment, and Social
Assistance. These industry sectors employ more
people in Philadelphia than would be expected based
on the size of the city’s labor force and national
patterns of employment (Table 5).
Source: Philadelphia Works Analysis of BLS, QCEW 9State of the Labor Market | Private Industry: Q3 2020
Table 4: Top 10 Industry Sectors by Employment in Philadelphia: Q3 2020
Table 5: Top 10 Industry Sectors by Local Specialization in Philadelphia: Q3 2020
Source: Philadelphia Works Analysis of BLS, QCEW 10State of the Labor Market | Private Industry: Q3 2020
Figure 5: Distribution of Philadelphia Businesses and Employment by More than 30% of Establishments with fewer than 5
Establishment Size, Q3 2020 employees are in the retail, food service, or
accommodation sectors.
6% of all Employment is in
Businesses with Fewer
than 5 Workers
In 2020, nearly 60% of all Philadelphia businesses em-
ployed fewer than 5 workers, making up 6% of the city’s
total employment (Figure 5). During the third quarter of
2020, employment grew across businesses of most sizes.
Those with fewer than 50 employees saw the most
significant relative growth.
Figure 6: Percent Change in Philadelphia Employment by Establishment
58% Size Over Previous Quarter, Q3 2020
of Philadelphia Businesses
Employ Fewer than 5 9%
Workers 8%
7% 6%
6%
4%
1%
0% 1%
The Small Business Administration typically defines a
small business as one with fewer than 500 employees.
Source: Philadelphia Works analysis of PA CWIA, Employment by Size Code 11State of the Labor Market | Private Industry: Q3 2020
Occupational
Employment
This Photo by Unknown Author is licensed under CC BY-SA 12State of the Labor Market | Occupational Employment Estimates
Occupational Employment Estimates
By occupation, recent patterns of employment in Philadelphia have By wage and educational attainment, COVID impacts are ex-
largely followed national trends. Figure 7 below depicts local and acerbating existing patterns of inequity. The vast majority of em-
national employment change along horizontal and vertical axes and ployment losses occurring in 2020 were concentrated among low-skill
overall local employment in the size of each bubble. As with Private and low-wage occupations (Figures 8 and 9). The figures reflected in
Industry, COVID-19 is disproportionately affecting those in service- this section are derived from an economic model, based on industry
oriented occupations. employment in the second quarter of 2020.
Figure 7: Percent Change in Employment for Occupations with at least 2,000 Workers in Philadelphia, December 2019 to June 2020
5%
Home Health Aides
0%
% Change Nationally
Light Truck Drivers
Fast Food
Counter Workers
-5%
Restaurant Supervisors
-10% Bartenders, Servers,
Dishwashers, and
Cooks
-15%
-20% -15% -10% -5% 0% 5% 10% 15%
% Change in Philadelphia
Source: Philadelphia Works Analysis of data from EMIS, Inc. 13State of the Labor Market | Occupational Employment Estimates
Table 6: Largest Occupations in Philadelphia, June 2020
Annual Annual
SOC Occupation 2020 Jobs ▼
Change Change %
31-1128 Home Health and Personal Care Aides 35,100 1,050 3%
29-1141 Registered Nurses 27,200 -260 -1%
25-1099 Postsecondary Teachers 20,400 -330 -2%
43-9061 Office Clerks, General 18,700 -670 -3%
35-3023 Fast Food and Counter Workers 18,700 -2,230 -11%
43-4051 Customer Service Representatives 13,400 -330 -2%
41-2011 Cashiers 11,900 -780 -6%
41-2031 Retail Salespersons 11,700 -1,140 -9%
53-7062 Laborers and Freight, Stock, and Material Movers, Hand 11,300 -350 -3%
43-6014 Secretaries and Administrative Assistants, Except Legal, Medical, and Executive 10,700 -340 -3%
Table 7: Top Occupations with at least 2,000 Employees by Annual Rate of Decline, December 2019 to June 2020
Annual Annual
SOC Occupation 2020 Jobs
Change Change % ▲
35-3011 Bartenders 3,300 -720 -18%
35-3031 Waiters and Waitresses 9,800 -2,100 -18%
35-9021 Dishwashers 2,400 -500 -17%
35-2014 Cooks, Restaurant 5,900 -1,170 -17%
35-9011 Dining Room and Cafeteria Attendants and Bartender Helpers 2,200 -400 -16%
35-1012 First-Line Supervisors of Food Preparation and Serving Workers 4,500 -650 -13%
35-3023 Fast Food and Counter Workers 18,700 -2,230 -11%
41-2031 Retail Salespersons 11,700 -1,140 -9%
53-3058 Passenger Vehicle Drivers, Except Bus Drivers, Transit and Intercity 4,200 -362 -8%
25-2011 Preschool Teachers, Except Special Education 2,400 -200 -8%
Source: Philadelphia Works Analysis of data from EMIS, Inc. 14State of the Labor Market | Occupational Employment Estimates
Figure 8: Occupational Employment Change by Median Wage in
84%
Philadelphia, December 2019 to June 2020
Less than $15 $15 to $30 $30 to $45 $45 to $60 $60 and Higher
0
Change in Employment
-2,000 Of employment declines were concentrated
among occupations in the bottom one-fifth of
-4,000
the wage spectrum
-6,000
86%
-8,000
-10,000
-12,000
Of employment declines were among
Figure 9: Occupational Employment Change by Typical Degree Requirements occupations typically requiring a high school
in Philadelphia, December 2019 to June 2020 diploma or no educational credential
Master's Degree or Higher
During the recovery from the Great Recession,
Bachelor's Degree
occupational growth in Philadelphia was highly
Some College or Associate's Degree bifurcated by wage and education. Gains were
concentrated among low- and high-paying
High School Diploma or Equivalent opportunities, following a national pattern of
growing income inequality. The COVID recession
Less than High School
is having major impacts on low-skill and low-
wage employment, exacerbating existing
inequities.
Change in Employment
Source: Philadelphia Works Analysis of data from EMSI, Inc. and BLS, OES 15State of the Labor Market | Occupational Employment Estimates
Employer Demand
This Photo by Unknown Author is licensed under CC BY-SA 16State of the Labor Market | Employer Demand
Employer Demand
As a proxy for employer demand in Philadelphia, this section presents the characteristics of
unique online job postings. While these data provide helpful insights, we must keep in mind
their limitations. First, postings are categorized by a computer program and are thus subject to
56,200
Unique Job Postings this Quarter
error. Second, since these postings include only those published to online job boards, they
potentially exclude demand not advertised online. This exclusion may further bias the
characteristics presented here, as the types of employment opportunities advertised online are
often inherently different from those that are not.
Figure 10: Monthly Job Postings in Philadelphia, Previous 24 Months
+5,000
Change in Total Postings
Over Previous Quarter
Source: Philadelphia Works Analysis of Burning Glass, Labor Insight 17State of the Labor Market | Employer Demand
Top Posting Employers Top In-Demand Certifications
Penn Medicine o Driver’s License
o Registered Nurse
Deloitte
o First Aid CPR
Thomas Jefferson University
o Basic Life Saving (BLS)
Comcast o Advanced Cardiac Life Support (ACLS)
Health Care Service Corporation o CDL Class A
University of Pennsylvania o Certified Public Accountant (CPA)
Children’s Hospital of Philadelphia
IBM Top In-Demand Skills
Temple University Health System o Customer Service
o Scheduling
Accenture
o Microsoft Excel
KPMG
o Microsoft Office
Allied Universal o Cleaning
Aramark o Budgeting
o Sales
Einstein Healthcare Network
Specialized and Software Skills
Source: Philadelphia Works Analysis of Burning Glass, Labor Insight 18State of the Labor Market | Employer Demand
Figure 11: Top Posted Occupations in Philadelphia, January to March 2021
Monthly job posting
updates can be found on
the At a Glance page of
our website.
Source: Philadelphia Works Analysis of Burning Glass, Labor Insight 19State of the Labor Market | Employer Demand
Figure 12: Top Posting Industries in Philadelphia, January to March 2021
Industry Spotlight
Food Service and
Drinking Places
Climbing three spots over the previous quarter,
Food Service and Drinking Places posted more
than 2,500 positions from January to March
2021. Waiters and Waitresses were the most
commonly posted occupation, while Aramark
was the top posting employer. Nearly 200
postings requested a ServSafe certification.
Source: Philadelphia Works Analysis of Burning Glass, Labor Insight and BLS, OES
Source: Philadelphia Works Analysis of Burning Glass, Labor Insight 20State of the Labor Market | Employer Demand
Figure 13: Education and Experience Requirements Indicated by Job Postings in Philadelphia, January to March 2021
For online job postings indicating a minimum
level of education, about 70% requested a
bachelor’s degree or higher.
Figure 13 displays job postings from the previous
three months segmented by requested levels of
education and experience. While a bachelor’s degree
is requested for roughly half of all postings, an
additional 20% request a master’s degree or higher.
Note that these results include only postings that
indicate a minimum level of education and therefore
do not include those where no minimum education is
required or requested.
Source: Philadelphia Works Analysis of Burning Glass, Labor Insight 21State of the Labor Market | Employer Demand
Philadelphia’s
Labor Force
This Photo by Unknown Author is licensed under CC BY-NC-ND 22State of the Labor Market | Philadelphia’s Labor Force
Figure 14: Total Population and Labor Force Participation by Age and Binary Sex in
Philadelphia’s Labor Force Philadelphia, 2019 Lighter shaded areas represent the population
not participating in the labor force.
While Philadelphia’s labor force has grown in
Labor Force Participation
recent years, employment outcomes vary by
race, ethnicity, and educational attainment.
Using data available from the American Community
Survey, this section presents the demographic char-
acteristics of Philadelphia’s workforce. These figures
represent individuals living in Philadelphia, regardless
of where they work. Due to their lag, the most recent
available data do not reflect the impacts of the COVID-
19 pandemic.
By age and binary sex, individuals between the ages of
25 and 34 make up the largest portions of
Philadelphia’s population and labor force (Figure 14).
For both men and women, labor force participation
among these age cohorts is between 75% and 85%,
higher than the overall rate of 62%.
Recent growth in the city’s labor force, as discussed in
the previous section, has been driven by an increase in
participation among women and an increase in
population among individuals 25 to 34. Again, these
figures represent Philadelphia residents and therefore
do not capture workers commuting into the city, a
demographic that is much more likely to be older.
Source: Philadelphia Works Analysis of U.S. Census Bureau, ACS 5-Year Estimates 23State of the Labor Market | Philadelphia’s Labor Force
Figure 15: Rates of Unemployment and Labor Force Participation by Race and Ethnicity,
2019
58% 70% 14%
Labor Force Participation Rate
60% 13% 65% 12%
61% 60% 12%
58%
Uneployment Rate
50% 10%
40% 47% 8%
Labor Force Participation Rate Among 8%
30% 7% 6%
Black and African American
Philadelphians in 2019 20% 5% 4%
10% 2%
0% 0%
American Indian Asian Black or African Hispanic or White
Residents of color are more American Latino
likely to be out of the labor Labor Force Participation Unemployment
force and unemployed. Figure 16: Rates of Unemployment and Labor Force Participation by Race, 2019
Among American Indian, Asian, Black and
African American, and Hispanic or Latino Working Age
residents, labor force participation was Population 58% 43%
much lower and unemployment was much
higher than for their white peers (Figure
15). Labor Force 8% 39% 8% 45%
In 2019, while Black and African American
residents made up 58% of Philadelphia’s
working age population, they made up just
Employed 8% 37% 8% 47%
37% of the city’s employed population
(Figure 16). Asian Black or African American Other Race or Multiracial White
Source: Philadelphia Works Analysis of U.S. Census Bureau, ACS 5-Year Estimates 24State of the Labor Market | Philadelphia’s Labor Force
In 2020, during the COVID-19 employment crisis, Figure 17: State Unemployment Claims Relative to 2018 Labor Force Estimates by
Black and African American Philadelphians were Race and Ethnicity, March to December 2020
much more likely to have filed initial claims for
Initial Claims
unemployment benefits and to have received Mar. 2020 to 48% 12% 33%
benefits for a longer period than their peers. Feb. 2021
Making up approximately 40% of Philadelphia’s
labor force in 2019, Black and African American
Labor Force
workers represented nearly half of all initial claims 2019 39% 13% 41%
filed from March 2020 to February 2021 (Figure Estimates
17). During the last week of February, Black and
Black Hispanic Pacific Islander or Asian White
African American Philadelphians filed almost 60%
of continued claims. Figure 18: State Unemployment Claims Relative to
2018 Labor Force Estimates by Census Tract, March
By geography, state unemployment claims were
to December 2020
concentrated in Philadelphia’s north and western
neighborhoods (Figure 18). These areas, home to
significant BIPOC populations, faced existing
employment barriers, concentrated poverty, and
lower levels of educational attainment.
The COVID-19 Employment Crisis has
disproportionately affected Black and
African American workers.
Source: Philadelphia Works Analysis of U.S. Census Bureau, ACS 5-Year Estimates; PA CWDS UC Claimants 25State of the Labor Market | Philadelphia’s Labor Force
Figure 19: Rates of Unemployment and Labor Force Participation by Educational
By educational attainment, individuals Attainment, 2019
with less than a bachelor’s degree are 100% 20%
Labor Force Participation Rate
more likely to be unemployed and less
Unemployment Rate
likely to participate in the labor force 80% 88% 16%
16% 78%
(Figure 19). For those with less than a
60% 67% 12%
high school diploma, employment
12%
outcomes are significantly worse. 40% 49% 8%
7%
In 2019, 13% of Philadelphia’s working 20% 4%
age population lacked a high school 4%
diploma. The unemployment rate 0% 0%
Less than High High School Diploma Some College or Bachelor's Degree or
among these individuals stood at 16%, School Diploma or Equivalent Associate's Degree Higher
compared to 12% for those with a high
Labor Force Participation Unemployment
school diploma, 7% for those with some
college or an associate’s degree, and 4% Figure 20: Rates of Unemployment and Labor Force Participation by Educational
for those with a bachelor’s degree or Attainment, 2019
higher (Figure 20).
Working Age
Population 13% 31% 24% 32%
49%
Labor Force Participation Rate Among
Labor Force
Employed
9%
8%
28%
27%
25%
25%
38%
40%
Philadelphians with less than a High
School Diploma in 2019
Less than High School Diploma High School Diploma or Equivalent
Some College or Associate's Degree Bachelor's Degree or Higher
26State of the Labor Market | Philadelphia’s Labor Force
Table 8: Most Common Degree and Certificate Completions in the Philadelphia MSA,
Academic Year 2019
Table 8 shows the most common
Master's
degrees awarded in the Philadelphia Degree Description
Total
Certificates
Associate Bachelor
Degrees or
Completions Degrees Degrees
region during the 2018-2019 academic Higher
year. Business Administration 5,480 20 910 1,840 2,720
Note that these figures reflect only Registered Nursing 5,360 130 820 3,810 610
individuals attending post-secondary Liberal Arts and Sciences 3,780 0 3,040 680 50
educational institutions. Individuals Finance 2,600 0 0 2,040 560
completing occupational training Financial Planning and Services 2,480 2,340 0 60 80
through workforce, nonprofit, or Psychology 2,300 0 240 1,880 180
private institutions are not included.
Biology/Biological Sciences 1,890 0 40 1,770 90
Marketing/Marketing Management 1,430 10 20 1,180 220
The top two programs, Accounting 1,410 20 10 1,100 280
Social Work 1,240 0 70 360 810
Business Administration and
Business/Commerce 1,240 0 450 550 240
Registered Nurses each Computer and Information Sciences 1,210 10 160 740 310
account for approximately Law 1,080 0 0 0 1,080
5.5% of all degrees awarded. Health Services/Allied Health 1,060 0 590 470 10
Cosmetology/Cosmetologist 1,040 1,040 0 0 0
Mechanical Engineering 960 0 10 800 150
Medicine 920 0 0 0 920
Political Science and Government 910 0 10 850 50
Degree categories may not sum due to Medical/Clinical Assistant 890 860 20 0 0
rounding. Management Science 850 0 0 370 480
27State of the Labor Market | Philadelphia’s Labor Force
Employment in Philadelphia is heavily Figure 21: Inflow-Outflow of Workers and Residents by Density of
Employment in Philadelphia, 2018
concentrated around Center City, University
City, and along the Broad Street corridor.
Philadelphia is intrinsically connected to its suburban neighbors. Nearly
346,000
half of all primary jobs in the city are held by workers that commute Live and Work in
from outside the city limits. Philadelphia
Meanwhile, prior to the COVID-19 pandemic, about one-fifth of
Philadelphia’s resident workers lacked access to a vehicle. Combined
with the city’s concentrated employment centers, access to job
opportunities for many residents depends on the city’s public
transportation system.
18%
Of Resident Workers Have No Access
to a Vehicle in 2019
25%
Of Resident Workers Relied on
310,000 235,000
Public Transportation in 2019 Commute In Commute Out
Source: Philadelphia Works Analysis of U.S. Census Bureau, ACS 5-Year Estimates and LHED 28For comments or questions about the contents of
this document, please reach out to
1617 John F. Kennedy Boulevard, 13th Floor
Philadelphia, PA 19103 data@philaworks.org
Administrative Offices: (215) 963-2100
Job Seeker and Business Services: (833) 750-5672You can also read