A BASELINE STUDY OF LABOR ISSUES AND TRENDS IN U.S. PORK PRODUCTION
←
→
Page content transcription
If your browser does not render page correctly, please read the page content below
August 2021

    A BASELINE STUDY OF LABOR ISSUES AND
       TRENDS IN U.S. PORK PRODUCTION

                                           Project Researchers:
        Christian Boessen, Georgeanne Artz, and Lee Schulz
                                   Originally completed in March 2018

                                               Updated by:
                                            Holly Cook

                                     Research Commissioned by the:

                     National Pork Producers Council

                                    Acknowledgements
We gratefully acknowledge the National Pork Producers Council Labor Security Task Force for providing
observations relevant to labor issues and trends in U.S. pork production. Their valuable input led to the
important findings presented here.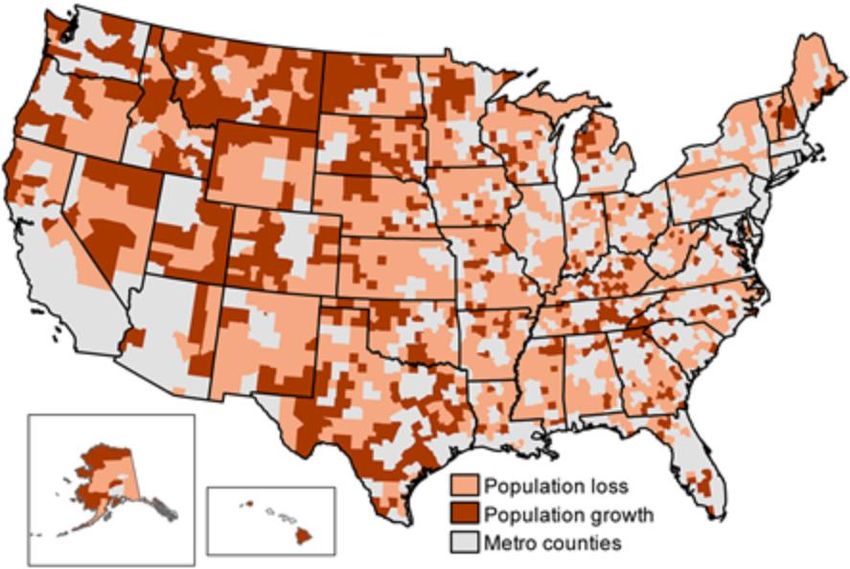
About the Principle Investigators
Christian Boessen, PhD, is a Senior Lecturer in the Department of Economics at Iowa State University. He
previously worked as a Swine Economist in the Commercial Agriculture Extension program and as an
Associate Teaching Professor at the University of Missouri. He earned a B.S. in Agriculture, as well as M.S.
and Ph.D. degrees in Agricultural Economics from the University of Missouri. His extension, research and
consulting work related to the swine industry has included work on contracting, environmental practices,
financial stress and disease economics. He has taught courses in finance, marketing, international
agribusiness, farm management, and macroeconomics. Boessen has also worked in university outreach
capacities with farmers and agricultural investors pursuing value-added projects and collective actions.
He’s been involved in projects in South America, Africa, South Asia and East Asia. Prior to his academic
career, Boessen worked in the agribusiness finance field, with positions in corporate finance, and
agricultural debt and equity investing. He has worked across the United States with experience in all the
major agricultural regions and sectors of agriculture.

Georgeanne Artz, PhD, is an Assistant Professor in the Department of Economics at Iowa State University.
Her current position focuses on research and teaching in the field of agribusiness. She earned her Ph.D. in
agricultural economics from ISU in 2005. She holds a B.A. in economics from Yale University and a M.S. in
resource economics and policy from the University of Maine at Orono. From 2005 to 2011 she was an
assistant professor at the University of Missouri in the Department of Agricultural and Applied Economics
with a joint appointment in the Truman School for Public Affairs. Dr. Artz teaches courses in intermediate
microeconomics and farm business management. Her research explores the performance of agricultural
and non-agricultural businesses in rural areas, as well as the policy, resource and management issues that
affect them. She has published specifically on trends in rural labor markets, rural business performance,
rural entrepreneurship, and the financial and human capital needs of rural firms.

Lee Schulz, PhD, is an Assistant Professor in the Department of Economics at Iowa State University. He
has served as the state extension livestock economist since joining Iowa State University in 2012. Lee
grew up on a diversified crop and livestock farm in Wisconsin. He obtained a B.S. in Agricultural Business
from the University of Wisconsin‐River Falls, a M.S. in Agricultural Economics from Michigan State
University, and a Ph.D. in Agricultural Economics from Kansas State University. His integrated research,
teaching, and extension program provides leadership in the study of, and educational programming for,
critical problems facing the livestock and meat industry, including marketing and risk management,
contracting, market concentration and performance, agricultural and trade policies, new technologies,
animal health and biosecurity, and regulatory issues. Schulz has published in professional journals,
extension publications, and the farm press and has spoken at numerous professional and agricultural
conferences.
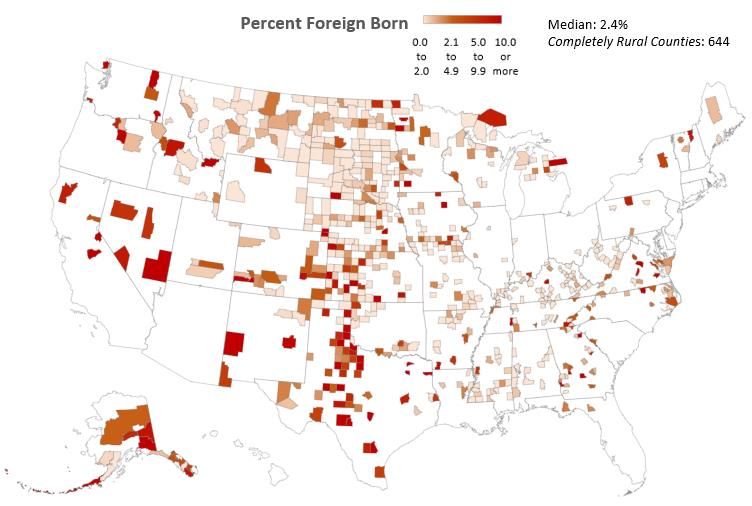
Table of Contents

EXECUTIVE SUMMARY ....................................................................................................................... 1

CHAPTER 1: INTRODUCTION AND OBJECTIVE..................................................................................... 3

CHAPTER 2: AGRICULTURAL LABOR MARKET TRENDS ....................................................................... 4
  2.1 Trends in the General Economy ................................................................................................. 6
  2.2 Trends in the Rural Population ................................................................................................... 9
  2.3 Trends in Immigration and the Labor Supply ............................................................................ 15
  2.4 Trends in Immigration and the Rural Labor Markets ................................................................ 18
  2.5 Possible Economic Implications of Changes in Immigration Laws or Policies ............................ 20
  2.6 Future Trends in Immigration .................................................................................................. 23

CHAPTER 3: LABOR MARKET SITUATION IN LEADING HOG PRODUCTION STATES ........................... 25

CHAPTER 4: INDUSTRY OUTREACH AND FINDINGS .......................................................................... 32
  4.1 Organizational Structure .......................................................................................................... 32
  4.2 Hiring Employees in the Local Labor Market ............................................................................ 34
  4.3 Hiring Immigrant or Temporary Foreign Employees ................................................................. 35
  4.4 Impact of New Regulations, Technologies, and Practices on Labor Requirements .................... 37
  4.5. Future Work ........................................................................................................................... 38

REFERENCES ..................................................................................................................................... 39
EXECUTIVE SUMMARY
In 2017, hog and pig farmers in the U.S. spent over $1.03 billion on hired labor, a 23 percent increase
from the previous Census of Agriculture in 2012. The labor expense was even greater, at $1.7 billion and a
46 percent increase, when contract and custom labor was included. Nearly 37 percent of hog and pig
farms reported having hired labor in 2017 and the average per farm hired labor expense was $122,504, a
54 percent increase from 2012. Almost 1,700 farms reported having a hired labor expense over $100,000
in 2017. Recruiting, retaining, and managing labor is therefore very important for an individual farm
operations’ success as well as the broader industry’s success.

The purpose of this study is to deliver a baseline on the labor issues and trends in U.S. pork production.
This study provides information regarding current challenges, opportunities, and future labor needs in
pork production that may influence management programs and direct policy initiatives going forward.

Several approaches were used to assess the labor situation and outlook. Existing literature and public
information were collected, reviewed, and a comprehensive summary provided to establish a baseline
understanding of the agricultural labor market situation with particular focus on the pork industry. Data
from the Bureau of Labor Statistics, USDA’s Economic Research Service, the U.S. Census Bureau, and the
Census of Agriculture were used to examine trends in farm wages, the size and trends in labor pools,
competition with other employers, and forces in the general economy which all affect farms’ ability to
hire and retain employees. We conducted interviews with pork industry participants to gain insight into
evolving labor trends and implications for the industry.

Key Findings
• Agriculture in general and particularly the hog industry has changed dramatically in recent decades,
   from an industry largely utilizing family labor to an increasingly capital intensive, technology, and
   science driven one with a significant demand for hired full-time skilled and unskilled workers. From
   2001 to 2020, employment in the swine industry grew by an annual rate of 1.5 percent, a rate nearly
   four times faster than employment growth in all U.S. industries. Total and weekly wages in hog
   production jobs have also grown faster than the average of all U.S. industries over this 20-year span.

•   The robust demand for labor in the hog industry is against a backdrop of increasingly threatening
    macroeconomic and demographic trends. The most immediate challenge to hog production firms in
    the industry has been the strengthening of the broader U.S. labor market with the U.S.
    unemployment rate falling from 10 percent in 2009 to 3.5 percent in early 2020. Unemployment rates
    spiked in mid-2020 in the wake of national shutdowns but have shown a steep decline in early 2021
    as many returned to work. These national unemployment trends still understate the tight labor
    supply in most of the largest hog production states where unemployment is below the national level,
    even during the March 2020 – April 2021 period of COVID-19 shocks. During this period, the nation’s
    top 8 hog producing states averaged an unemployment rate 1.3 percent lower than the national rate.
    Furthermore, in the largest hog production states the labor force participation rates are generally well
    above the national average, indicating little or no slack in these local labor markets.

•   The most threatening trend facing hog producing firms in the longer term are the demographic
    realities in non-metropolitan counties where hog producing firms are overwhelmingly located.
    Population growth has been slowing in U.S. non-metro counties for decades and large swaths of rural
    America have had negative growth or loss. From 2010 to 2016, the overall non-metro population
                                                                                                  1|P a ge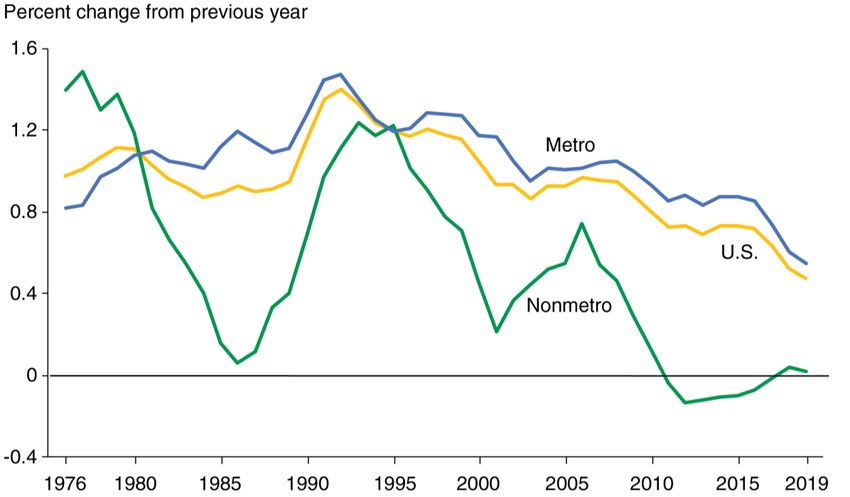
growth rate became negative for the first time, and although growth has been slightly positive or
    neutral from 2017 to 2019, non-metro populations in agricultural regions continue to see population
    loss. The aging rural workforce that remains is increasingly unable and unwilling to do the strenuous
    labor that agricultural work demands. As more rural residents age beyond their childbearing years,
    this negative trend in population and labor force will likely accelerate. From 2014 to 2019, the rural
    labor force shrank in five of the eight largest hog producing states.

•   A final, and important, trend that is exacerbating the ever-tightening rural labor market is the
    declining flow of immigrants into rural labor markets. Over the last 30 years, the immigration of
    foreign-born workers offset some of the decline in rural native-born population and labor force. That
    trend had likely already reversed even before the recent emergence of political sentiment toward
    stricter immigration controls and increased enforcement. Furthermore, an increasing proportion of
    the large influx of immigrant workers that came to the U.S. in the 1980s and 1990s are aging beyond
    their prime working years. Ever improving economies and rapidly falling population growth in
    immigrant sending countries are increasingly changing the calculus of potential immigrants. There are
    more and better jobs in many immigrant sending countries and the baby-booms in those countries
    that fed the immigration waves in recent decades are past. These trends, in an environment of tighter
    immigration rules and enforcement, combined with the negative growth in native-born rural
    populations almost certainly portend decades of increasingly difficult labor market conditions for all
    rural firms including hog producing firms.

•   This study included interviews of pork industry participants. Key themes and responses included:
        o The importance of being able to hire workers into companies at the right stage or level and in
            a way to develop both pig skills and people skills for leadership development and growth and
            promotion within a company.
        o The increasing difficulty of hiring dependable employees in the local labor market. The biggest
            challenge with native-born local workers was work schedules that require work on weekends
            and holidays more so than physical demands of the job.
        o Foreign-born workers have performed well but current guest worker programs are less than
            ideal and create additional management challenges.
        o Changes in farm specific procedures, auditing, Pork Quality Assurance, antibiotic-use
            guidelines, and other regulations and protocols have created strong demand for employees
            with higher levels of education and training.
        o A final noteworthy sentiment expressed at different points in the interviews was an attitude
            that the industry and the employers therein simply have to adapt and attract people to their
            businesses—which is particularly insightful given the external nature of the macroeconomic,
            demographic, and political forces affecting the supply side of local labor markets.

•   This study provides information from which to assess the pork production labor market situation and
    outlook. Conclusions will have much greater leveraged value if they are used as foundational
    information as management and policy initiatives go forward. That is, the information from this study
    can be used to determine where the most fruitful efforts might be spent in workable options for
    workforce needs and where those efforts may be less productive without other external
    developments.

                                                                                                2|P a ge
CHAPTER 1: INTRODUCTION AND OBJECTIVE
Background
There is increasing concern across all sectors of agriculture that the market for farm labor has become
extremely challenging due to a combination of factors. For pork production, increased scale of production
and the adoption of new technologies (and practices) has required changes in the industry’s labor needs.
Some new technologies require little if any additional labor while others are much more labor intensive.
Furthermore, many new technologies require more highly skilled labor, altering the mix of employees
needed on farm. Thus, changes in the structure of the industry and technology developments continue to
be accompanied by large changes in the demand for employees and skills. On the supply side, actual and
proposed changes in wages, safety, and immigration policies are also impacting the market for farm
labor. Pork production relies on labor for year-round animal care and technical support, distinguishing
this sector from some other sectors of agriculture which rely more heavily on seasonal labor. This broad
situation highlights the need for this project. A better understanding of the nature and extent of pork
production labor market issues and trends can inform management and policy solutions.
Objectives and Procedures
The purpose of this study is to identify and document changes occurring in the pork labor market that
may impact the industry now and in the future. The objective is to determine current challenges,
opportunities, and future labor needs in pork production that may influence management programs and
direct policy initiatives going forward.
To complete the study, three major sources of information were analyzed. First, existing literature and
public information was used to establish a baseline understanding of the current agricultural labor market
situation with particular focus on pork production. Second, public data from the Bureau of Labor
Statistics, USDA’s Economic Research Service, the U.S. Census Bureau, and the Census of Agriculture were
used to examine trends in farm wages, the size and trends in labor pools, competition with other
employers, and forces in the general economy which all can affect managers’ ability to hire and retain
employees. Third, the project researchers conducted interviews with representatives from the pork
industry. To ensure confidentiality of those providing comments, the names of individuals and
organizations are not reported. Although it is impossible to capture comments from every participant, the
report reflects sentiments from a broad array of these industry stakeholders.
Every industry participant we interviewed applauded NPPC for taking the initiative to commission this
study. Participants thanked us for providing them with the opportunity to provide input. In many ways
the active discussions we had with participants were viewed as the first in a multi-step process towards
assessing pork production labor market issues and carefully assessing ways to inform management and
policy solutions.
3|P a geCHAPTER 2: AGRICULTURAL LABOR MARKET TRENDS
Conditions in the agricultural labor market have been challenging for decades. The agricultural industry in
the U.S. has progressed from a fairly large labor-intensive sector where family members supplied the
majority of the farm labor, to one of much larger, more capital-intensive farms requiring a larger
workforce comprised of skilled farm operators supplemented by a pool of unskilled labor, which is often
seasonal and migrant. As a result of this evolution in both the number and the skill level required of
employees in agriculture, many farmers have struggled with labor hiring and retention challenges.
Nevertheless, at the national level, the labor market in agriculture in general, and in animal agriculture in
particular, looks strong. Since 2001, employment in the agricultural industry has grown from 1,178,302 to
1,247,580 jobs, or about 6 percent. Between 2001 and 2011, employment remained relatively steady in
the industry, with a more rapid increase after 2011, when agricultural industry employment added nearly
100,000 jobs by 2016 and peaked in 2018. Average agricultural employment took a dip in 2020 after the
COVID-19 pandemic caused economic shocks across the country. However, it is important to note that
agricultural employment reinstated over 200,000 jobs from the first to the third quarter of 2020.
Average weekly wages (in nominal dollars) consistently rose over this time period; 97 percent over the
20-year period and up 20 percent in the last five years. This translates to a 4.9 percent average annual
growth rate in average weekly wages over the entire time period, higher than the 3.8 percent increase for
total U.S. employment over the same time. During the last five years, average weekly wages in agriculture
have grown at a similar pace to the rest of U.S. industries, with an average of 3.9 percent per year.
Table 1 presents detailed information on labor market measures at the national level for all industries
combined, all industries in non-metropolitan areas combined, the agricultural industry (NAICS 11)1, the
hog production industry (NAICS 1122), construction (NAICS 23), manufacturing (NAICS 31-33), and mining,
quarrying, and oil and gas extraction (NAICS 21), which we label energy production. The latter three
industries are ones that tend to compete with hog production for workers in many local labor markets.
One thing to note from the numbers in the table is that employment growth in non-metropolitan areas
has been negative. This suggests that agriculture, which is located primarily in non-metropolitan areas,
has often been a source of job growth, while other industries in these areas have been declining.
1
NAICS is an acronym for the North American Industry Classification System. It is the standard used by Federal statistical
agencies to classify business establishments for the purpose of collecting, analyzing, and publishing statistical data related
to the U.S. business economy (https://www.census.gov/eos/www/naics/).
4|P a geTable 1. Average Annual Growth Rates in Labor Market Measures for Selected Industries
Average Average
Employ- Establish- Total
Weekly Annual
ment ments Wages
Wages Wages
Average Annual Growth Rate, 2001-2020
U.S., All Industries 0.4% 1.6% 4.5% 3.8% 3.8%
U.S. Non-Metro, All Industries -0.3% 1.0% 3.8% 4.4% 4.4%
All Agriculture (NAICS 11) 0.3% 0.3% 5.4% 4.9% 4.9%
Hog Production (NAICS 1122) 1.5% 1.4% 6.5% 3.9% 3.9%
Construction (NAICS 23) 0.3% 0.5% 4.3% 3.8% 3.8%
Manufacturing (NAICS 31-33) -1.3% -0.5% 1.3% 3.6% 3.5%
Energy Production (NAICS 21) 0.5% 1.2% 4.3% 4.2% 4.2%
Average Annual Growth Rate, 2011-2020
U.S., All Industries 0.8% 1.6% 4.3% 3.3% 3.3%
U.S. Non-Metro, All Industries -0.4% 1.0% 3.0% 3.6% 3.6%
All Agriculture (NAICS 11) 0.7% 1.4% 5.4% 4.4% 4.4%
Hog Production (NAICS 1122) 0.7% 0.7% 4.5% 3.5% 3.5%
Construction (NAICS 23) 3.1% 1.1% 7.3% 3.3% 3.3%
Manufacturing (NAICS 31-33) 0.3% 0.6% 2.8% 2.4% 2.4%
Energy Production (NAICS 21) -2.6% -0.2% -1.4% 1.6% 1.6%
Average Annual Growth Rate, 2016-2020
U.S., All Industries -0.4% 1.6% 3.4% 3.9% 3.9%
U.S. Non-Metro, All Industries -0.4% 1.7% 3.4% 3.9% 3.9%
All Agriculture (NAICS 11) -0.3% 1.0% 3.6% 3.9% 3.9%
Hog Production (NAICS 1122) -1.0% 0.4% 2.0% 3.1% 3.1%
Construction (NAICS 23) 1.5% 1.9% 4.7% 3.0% 3.0%
Manufacturing (NAICS 31-33) -0.3% 0.9% 2.2% 2.6% 2.6%
Energy Production (NAICS 21) -2.4% -1.3% -1.1% 1.4% 1.4%
Note: Authors’ calculations using data from Bureau of Labor Statistics Quarterly Census of Employment and Wages (2001-2020)
The hog production industry, like the agricultural industry as a whole, has been growing. In 2020,
the U.S. hog production industry (NAICS 1122) employed 30,886 workers and paid more than $1.3
billion in wages, accounting for 2.5 percent of U.S. agricultural employment and 2.7 percent of
agricultural wages.
Over the past 20 years, hog production industry employment has increased 30.0 percent, total
wages 130.7 percent (in nominal $) and average weekly wages 77.5 percent. This is slightly higher
than the increase in average weekly wages for all U.S. industries, which was 76.6 percent over the
same period. The annual growth rate in average weekly wages was lower than the agricultural
industry as a whole, 3.9 percent versus 4.9 percent over the 20-year period and 3.1 percent versus
3.9 percent over the last 5 years.
The 2001-2020 period spans the worst U.S. recession since the Great Depression and over this
period the hog industry created jobs faster than every other sector outlined in Table 1. The 30.0
percent increase in hog industry employment over the 20-year period is large in comparison with
5|P a geindustries which compete with agriculture for workers. Energy production sector employment rose
1.0 percent, while construction employment rose 5.9 percent and manufacturing employed 26.2
percent fewer workers in 2020 than it had in 2001.
In the most recent 5-year period, hog industry employment has declined at an average annual rate
of 1.0 percent, while construction employment outpaced this with 1.5 percent growth, likely due to
the housing recovery. Employment in the energy production sector also fell by 2.4 percent.
Manufacturing employment fell, but at a slower rate, an average of 0.3 percent per year. All of
these measures include 2020 data and economic shocks related to COVID-19. Despite the COVID-19
effects on employment, the general trend of growth in these other sectors, which provide job
opportunities for similarly skilled workers, has likely put additional pressure on hog industry
employers to raise wages or offer other non-monetary benefits in order to attract new employees
and retain existing workers. Note that although hog industry employment growth turned negative
over the 5-year period, growth in average annual and weekly wages was greater in the hog industry
than in competing industries.
Hiring and retaining quality workers on swine farms is and will continue to be a major challenge for
management. As Swan (2010) suggests, "Modern-day pig production is less about managing pigs
than it is about managing people." Given that the pork production industry is largely rural-based,
the extent to which this particular challenge can threaten the long-term viability of operations
depends on the larger demographic and macroeconomic forces that are shaping rural labor markets
and the policy responses to these forces. Management can best deal with the internal business
realities but mostly can only react to the external threats.
The following sections address the forces that are shaping rural labor markets and that are largely
out of the control of managers. These include trends in the general economy, population, and
immigration.
2.1 Trends in the General Economy
The strength or weakness of the general economy affect rural labor markets in that increasing
opportunity and demand for workers outside local labor markets can reduce the supply of workers
locally. For example, if local economic activity remains constant while the general economy
strengthens, eventually workers will likely exit the local labor market to seek jobs in other labor
markets. While many economists have commented on the relatively slow pace of economic
recovery since the 2007-2009 recession, the positive economic growth since the recession was
steady leading up to 2020 and is one of the longest on record. Shocks related to the COVID-19
pandemic caused a spike in unemployment after the second quarter of 2020, but due to the nature
of the shocks, recovery of the unemployment rate has been much more rapid than in the years
following the recession.
Figure 1 details the significant drop in unemployment since the last recession when unemployment
peaked at 10 percent. At the beginning of 2020, with the national unemployment rate below 4
percent, many economists suggested that the national economy was at or near full employment,
which is the point at which further reduction in unemployment is likely to trigger inflation. Figure 1
6|P a gealso shows a spike in the national unemployment rates in the second quarter of 2020. The COVID-
19 pandemic led to a shutdown of the U.S. economy, and forced many people either temporarily or
permanently out of work. Within months, the national unemployment rate moved from its lowest
point in decades to its highest. Despite higher unemployment rates in recent quarters, agricultural
firms are still increasingly competing for workers that can find alternative jobs in fields such as
construction, manufacturing, and energy industries.
Figure 1. Civilian Unemployment Rate, Seasonally Adjusted
Note: Gray shaded area denotes recession.
Source: U.S. Bureau of Labor Statistics
Figure 2 illustrates the overall tightening of the national labor market in a more tangible way. In any
labor market, the labor force shrinks or grows based on the number of people actually seeking
work, population growth, immigration, and retirement or exits from the labor force.
7|P a geFigure 2. Number of Unemployed Persons per Job Opening, Seasonally Adjusted
Note: Gray shaded area denotes recession.
Source: U.S. Bureau of Labor Statistics
At the end of the recession in 2009 there was a severe drop in jobs available relative to the labor
force and there were almost seven people seeking work for every job opening. From 2010 to early
2020, job creation outpaced growth in the labor force. By October 2017, this ratio was at a point
where there was only one worker seeking employment for every posted job opening, implying a
very tight labor market that only continued to tighten. The ratio of job seekers per job opening
remained low, even dipping below one, until the COVID-19 pandemic began causing economic
disruptions in March of 2020. This period is represented by the spike in unemployed persons per
job opening after March 2020. As depicted by Figure 2, this hike in unemployed persons per job
recovered much quicker than the previous spike brought on by the 2007-2009 recession and was
back to 1.2 by March 2021.
The national unemployment rate represents the jobless rate for all workers in the U.S. workforce
and can mask other issues facing firms that are seeking to hire workers. In the case of pork
production firms, there is a need for both skilled and unskilled labor. Not only is there a demand for
manual or unskilled labor, but the increasing levels of technology and science driven production
methods mean that operations need workers with higher levels of knowledge, skills, and abilities.
Many of these positions are best suited for workers with college degrees or post-secondary
education training. Figure 3 reports the unemployment rate by educational attainment and shows
that workers with only a high school education had a jobless rate mirroring the national average.
However, it is apparent from Figure 3 that the labor market for workers with higher levels of
education is much tighter. The unemployment rate for workers with some college or associates
degrees in March 2019 was 3.3 percent and only 2.0 percent of workers with a bachelor’s degrees
were unemployed. Even through the wake of COVID-19 shocks in 2020, workers with some college
8|P a geor a bachelor’s degree experienced much lower unemployment rates than those with a high school
degree or less.
Figure 3. Unemployment Rates for Persons over 25, by Educational Attainment
Source: U.S. Bureau of Labor Statistics
2.2 Trends in the Rural Population
The most fundamental determinant of local labor supply is local population. Population and thus
labor supply are driven by natural growth (births minus deaths) and migration (domestic relocation
and foreign immigration). Population and demographic trends in much of rural America pose a
strategic threat not only to pork production firms but also a long-term threat to the rural economy
and communities in general.
Local population in the short run is fairly fixed. Over years and more likely decades, however,
conditions in the local labor market to a large extent affect local populations. If economic activity in
the local labor market is sufficient, more workers stay and have children that may in turn stay and
enter the local labor force. In addition, sustained economic activity and worker demand can induce
workers from outside the local labor market to move in. A lack of local economic growth and
employment combined with increased educational attainment and better opportunities in other
labor markets increases the opportunity cost for workers to stay in a local market. This leads to
workers moving away and seeking better opportunities elsewhere. The former can create a positive
feedback loop resulting in increased population and labor demand and thus leading to more
economic activity and jobs. The latter can lead to a negative feedback loop, with declining labor
demand and economic activity, fewer jobs and declining population.
9|P a geDeclining population begins with out-migration of people pursuing better economic opportunities
and/or increased amenities. Out-migration of younger adults leads to fewer births relative to
deaths and natural growth falls. The only possible off-set to out-migration and low or negative
natural growth is in-migration. If opportunities elsewhere in the domestic or global economy are
superior and immigration policy limits immigration, population will decline. This condition reduces
the labor supply in terms of workers but also results in an aging population and likely a lower
proportion of highly skilled workers.
The USDA Economic Research Service tracks population changes in rural areas and in a publication
covering the years 1976-2019 reported that in 2017, non-metro population in the U.S. experienced
slight overall growth after six straight years of decline (Cromartie, 2020). During and after the Great
Recession, non-metro population growth declined well over one percent. From 2010 to 2016, non-
metro population growth even became negative for the first time. Before this, loses in non-metro
counties across rural America were offset by population growth in other non-metro counties to
some degree. While trends have improved slightly in recent years, the gap between metro and non-
metro population growth remains significant. Figure 4 shows metropolitan population as a faster
growth area in recent years, helping to offset the shrinking non-metro population. Total population
growth remains positive but has been trending downward since 1990, indicating that overall growth
is slowing. Non-metro population growth remained around zero from 2017 to 2019, with just 0.02
percent growth from 2018 to 2019.
The negative trends in non-metro population have ominous implications for rural labor market
conditions in both the short- and long-term and the phenomenon is not comprised of isolated
areas. From 2010 through 2016, almost 70 percent (1,350 of 1,976) of non-metro counties lost
population. The gap between metro and nonmetro growth rates narrowed just slightly from 2016
to 2019 as nonmetro areas experienced very modest population growth. However, it is important
to be aware that the non-metro counties that did not lose population over this period were
overwhelmingly in areas of oil or gas production and in scenic mountains or coastal regions (Figure
5). The population increases these regions masks more severe population declines in other more
agricultural focused regions.
10 | P a g eFigure 4. Percent Change in Population from Previous Year by Metro/Non-Metro Status, 1976-2019
Source: Cromartie, 2020. Data from Economic Research Service and U.S. Census Bureau
While Figure 4 reports population change levels rising above zero in 2017, counties classified as
non-metro farming counties had previously been losing population at a rate almost ten times the
average. Non-metro farming counties lost population at the rate of 1.7 percent from 2010 through
2016 after a decline of 1.8 percent from 2002 through 2008.
Figure 5. Non-Metro Population Change, 2010-2016
Source: Cromartie, 2017. Data from Economic Research Service and U.S. Census Bureau
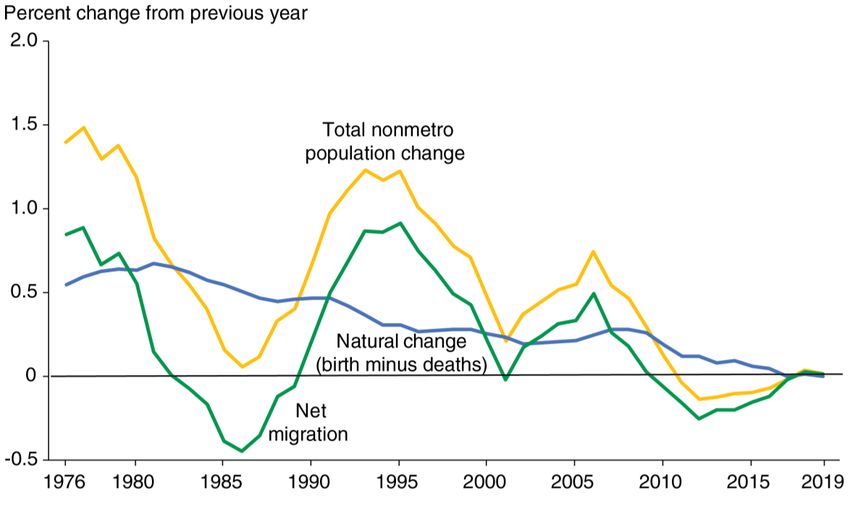
11 | P a g eFigure 6 provides a decomposition of the negative trends in rural population growth. As mentioned
previously, natural change and migration drive overall population change. Net migration from non-
metro counties has been negative since the start of the last recession indicating that more people
are leaving rural areas than are moving in. The effect of out-migration would have been worse over
the period if not for natural change (births exceeding deaths). However, the natural change is
approaching zero and this may portend a tipping point for many rural labor markets. The declining
natural change is a function of people of child-bearing age migrating away but is also driven by the
aging of the people that stay. The combination of out-migration and aging means that natural
change will turn negative in more and more rural counties in the coming years, accelerating the
negative trends in population. Note that this chart is based on 2010 census numbers projected
forward and does not yet account for mortalities associated with the COVID-19 pandemic.
Increased mortality associated with the virus is likely to have a significant impact on rural
communities and will contribute to the ongoing decline in population growth from natural
change (Cromartie, 2020)
Figure 6. Non-metro Population Change and Components of Change, Percent Change from the
Previous Year
Source: Cromartie, 2020. Data from Economic Research Service and U.S. Census Bureau
Population decline in much of rural America is only part of the labor supply challenge facing rural
employers such as pork production firms. Not only are such firms facing the threat of a shrinking
labor force, but the demographic composition of the existing labor supply also exacerbates the
problem. The median age of rural population is 42 years versus 37 years in urban areas.
The peaks in lines in Figure 7 illustrate the differences in median age and the accompanying bar
graph shows the age distribution. The tallest bars in the urban population (blue) distribution
indicate that the largest population age groups are in the prime working years of 18-44 years of age.
12 | P a g eConversely the tallest bars in the rural population (green) distribution indicate the largest age
groups are beyond their prime working years and are nearing retirement. This is particularly
important given that workers beyond their mid-forties are increasingly unwilling or unable to do the
strenuous manual labor associated with farm related work. Fan et al. (2015) assert “Because
agricultural work is physically demanding, it is difficult to remain in agriculture over one’s working
life.” They go on to note that “[a] seasonal agricultural worker who was 22 in 1986 would be 45 in
2009. By 2009, the farm labor force had few such workers (and few farmworkers over the age of
45). Thus, to maintain a large and flexible agricultural worker force, a steady stream of new, young
workers is required – whether it be from a porous border, temporary work permits, or a perpetual
program of earned legalization through farm work.”
Figure 7. Age Distribution of Urban and Rural Populations
Source: U.S. Census Bureau, 2019 American Community Survey, 2019 5-year estimates
13 | P a g ePork producing firms are finding it more challenging to hire both unskilled workers as well as skilled
workers with higher education levels. Changes in technology and production practices in swine
production increasingly require that workers have advanced education and training beyond high
school. Rural areas of the United States have been experiencing out-migration of young, educated
adults, or “brain drain,” for a long time.
Theodore Roosevelt’s 1907 establishment of the Country Life Commission was due, in part, to
concern about “the apparent tendency of the smartest and most promising young people in the
countryside to move to cities” (as quoted in Artz and Yu, 2011). Figure 8 reports the percentage of
rural and urban population with high school and bachelor’s degrees by age groups. While rural and
urban populations are similar in terms of high school education, a significantly lower percentage of
rural residents have bachelor’s degrees. Perhaps the most troubling indicator from Figure 8 is that
the lowest levels of educational attainment are among “entry-level” or the youngest age groups.
The lowest level of bachelor’s degree attainment by rural men is among 18–24-year-olds and 25-34
year olds, indicating that more of this age group are leaving and/or fewer young rural people are
pursuing degrees.
Figure 8. Educational Attainment by Age and Sex for Urban and Rural Populations
Source: U.S. Census Bureau, 2019 American Community Survey, 5-year estimates
14 | P a g e2.3 Trends in Immigration and the Labor Supply
Immigration, the movement of people from other countries into the U.S. has been central to the
growth and development of the U.S. economy throughout history. Throughout this same history of
development, immigration and the presence of immigrants in communities has always been a
contentious issue. However, few economists would dispute the importance and central role of
immigration to U.S. economic development. Two forces drive the growth of any economy: 1) the
number of workers or labor force producing goods and services, and 2) the productivity or the
quantity each worker can produce. In recent decades, as the native-born workforce has aged
rapidly and birth rates have fallen, skilled and unskilled immigrants have been crucial to maintaining
and growing the workforce and increasing productivity. Given the declining rural population and
aging rural workforce detailed previously, immigrants have been an especially important factor in
maintaining rural labor supplies.
In 1900 there were 76 million people in the U.S. and 13.7 percent were first generation immigrants
(Figure 9)2. Immigration to the U.S. slowed with the Great Depression and tightening of immigration
laws, and with growth in population, the proportion of first-generation immigrants reached its low
in 1970 at 4.7 percent.
The turning point in immigration began with the passage of the 1965 Immigration and Nationality
Act that made significant changes to U.S. immigration policy by removing a long-standing national
origins quota system that favored immigrants from Europe. After this change, immigration
increased slowly in the 1970s, then increased dramatically from the 1980s onward. By 2018 there
were 45 million immigrants in the U.S., which is a record high, but the proportion of first-generation
immigrants (14.1 percent) it is nearly identical to that of 1900.
Figure 9. First-and Second-Generation Immigrant Percent of U.S. Population, 1900-2018
Source: Pew Research Center
2
Chart available online from the Pew Research Center: https://www.pewresearch.org/hispanic/chart/first-and-
second-generation-share-of-the-population/
15 | P a g eWhat is very different today is the origins of U.S. immigrants. For example, in 1960, 84 percent of
immigrants came from Europe and Canada and only 10 percent were from Mexico and other Latin
American countries. In 2018, 50 percent of immigrants were from Mexico and other Latin American
countries and another 28 percent from South and East Asia (Figure 10) 3.
Figure 10. Origins of the U.S. immigrant population, 1960-2018
Source: Pew Research Center
The large wave of immigrants into the U.S. over the last 50 years is unprecedented in terms of
numbers and it has played an important role in shaping the U.S. labor supply overall and particularly
the supply of unskilled labor. Because a large proportion of immigrants come during their working
years and may not bring family, the foreign-born share of the labor force has increased more than
its proportion of the population. In 1970, foreign-born workers made up 5.2 percent of the labor
force. By 2020, 17.0 percent of the labor force was foreign born (Figure 11).
3
Chart available online from the Pew Research Center: https://www.pewresearch.org/hispanic/2020/08/20/facts-
on-u-s-immigrants/
16 | P a g eFigure 11. Percent Foreign Born in US. Labor Force
20.3% 20.5%
18.6%
17.0%
16.7%
15.2% 15.6%
12.5%
11.0%
9.3%
8.1%
6.7%
5.9%
5.2%
1900 1910 1920 1930 1940 1950 1960 1970 1980 1990 2000 2007 2015 2020
Source: Bureau of Labor Statistics, U.S. Census Bureau
It would be easy to presume that immigration disrupted U.S. labor markets from 1970 to 2020, but
that was not the case. Over the same period factors such as aging, the peak of women joining the
workforce, a declining labor force participation rate, and other cyclical forces caused a significant
slowing in labor force growth from the native-born population. In Figure 12, the actual growth in
the labor force over this period is presented on the backdrop of the level of foreign workers in the
labor force.
Figure 12. Number of Foreign-Born in Labor Force and Percent Change in U.S. Civilian Labor Force
30.0 3.0%
25.0 2.5%
20.0 2.0%
15.0 1.5%
10.0 1.0%
5.0 0.5%
0.0 0.0%
1960-70 1970-80 1980-90 1990-2000 2000-10 2010-20
Foreign-Born in Civilian Labor Force (millions)
% Change in Civilian Labor Force
Source: Bureau of Labor Statistics, U.S. Census Bureau
17 | P a g eThe initial influx of immigrants came while American baby-boomers were young and entering the
work force, a combination that contributed to a relatively high, 2.6 percent growth rate in the labor
force from 1970 to 1980 (orange line). However, after 1980, growth in the native-born working age
population slowed dramatically and total labor force has increased at less than one-half percent
over the last decade. During the last decade, the entry of foreign-born workers accounted for 60
percent of the one-half percent growth, illustrating the importance of immigration for U.S. labor
markets. Without immigration, the U.S. labor force would likely have shrunk from 2010 to 2020.
2.4 Trends in Immigration and the Rural Labor Markets
For a century, immigrant labor from various countries has been crucial for the production of high
value vegetable, fruit, and nut crops in the United States. Immigrant labor in animal agriculture is a
more recent phenomenon, becoming increasingly important as demand for workers increased
dramatically as the scale of livestock and poultry production increased. In many rural labor markets,
large scale livestock and poultry operations created jobs and demand for unskilled labor that did
not exist in the local labor market prior to the emergence of these firms. This evolution of modern
animal agriculture production and the associated increased labor demand occurred over the same
time that large portions of rural America were losing population.
Economists often debate if jobs follow workers, implying businesses start where there is an ample
labor resource, or if the reverse is true, that workers follow jobs. In the case of large scale animal
agriculture, there is surely little doubt that land, feed and open space, and processing facilities
largely determined where large livestock farms located. In many regions of populous animal
agriculture, foreign-born workers willing to move into shrinking rural labor markets have likely been
critical to development of today’s efficient meat, poultry and dairy value chains.
In the early decades of the immigration wave, from 1970 to 1980, newly arrived immigrant workers
in general were largely concentrated in metropolitan areas. Outside of the metro areas during this
decade, new immigrants from Mexico and other Latin American countries were concentrated in the
three Southwestern states (TX, NM, AZ) and California, primarily harvesting seasonal crops, often
returning to their country of origin after the harvest. However, as the immigration wave continued,
immigrant workers settled in labor markets across the country and by 1990, Mexico was the top
country of origin for immigrants in 18 U.S. states. By 2016 Mexican immigrants were the largest
groups in 34 U.S. states.
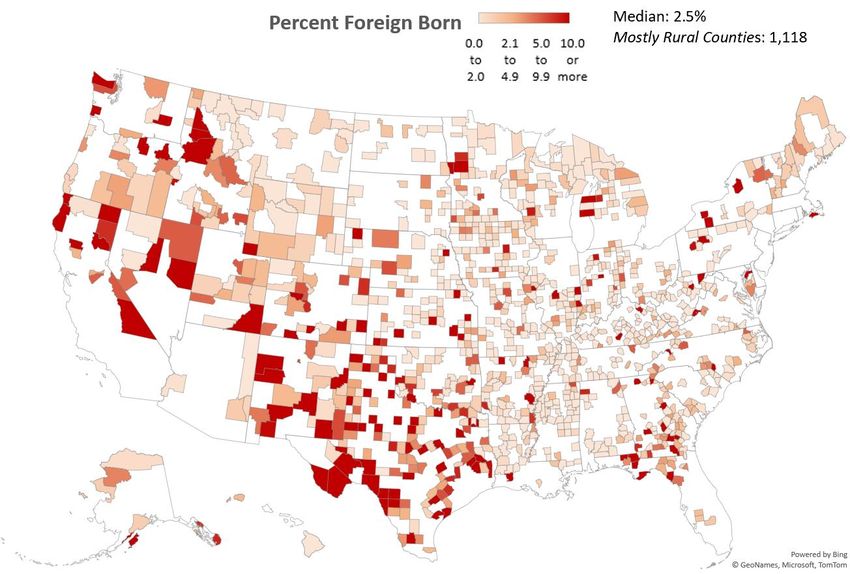
As can be seen from Figure 13, immigrant workers more frequently settle in urban counties, making
up almost 7.4 percent of urban residents. By comparison, the average immigrant populations as a
percent of rural counties' populations is low. According to U.S. Census Bureau estimates, in mostly
rural counties, foreign born residents are just over 4 percent of the population and only 3.5 percent
in completely rural counties. The median percentage foreign born in completely rural counties is
estimated to be 2.4 percent, meaning that in half of completely rural counties, foreign born
residents comprise less than 2.4 percent of the population. However, given that the labor force
participation rate for immigrant workers is higher than for native-born workers, the proportion of
immigrants in the rural labor force is higher than the 3.5 to 4.2 percent of population.
18 | P a g eFigure 13. Percentage Foreign-Born by Urban/Rural Status of County 2014-2019 5-year estimates
Source: Author’s calculations using data based on sample, 2014 and 2019 American Community Survey 5-year estimates, U.S. Census Bureau
Figure 14 displays the geographic distribution of foreign-born population in mostly rural counties. In
the Midwest, Great Plains and Southeast regions, the counties around meat processing centers had
the highest percentages of foreign-born residents.
Figure 14. Percent Foreign Born for Mostly Rural Counties: 2014-2019
Source: Author’s calculations using data based on sample, 2014 and 2019 American Community Survey 5-year estimates, U.S. Census Bureau
19 | P a g eFigure 15 indicates the contribution of foreign-born workers to the rural labor force. Outside of the
completely rural counties of the Southern Plains, foreign-born residents account for just over 2
percent of the population in most completely rural counties. As mentioned previously, unskilled and
skilled immigrant workers have been critical to economic growth in the U.S. through maintaining
growth in the labor force and contributing to productivity gains. In many rural labor markets,
immigrant workers have lessened the negative effect of net out-migration, helping to keep rural
communities in these markets economically viable.
Figure 15. Percent Foreign Born for Completely Rural Counties: 2014-2019
Source: Author’s calculations using data based on sample, 2014 and 2019 American Community Survey 5-year estimates, U.S. Census Bureau
2.5 Possible Economic Implications of Changes in Immigration Laws or Policies
Given the political straws in the wind today, many agricultural stakeholders are concerned about
the economic effects of possible tightened immigration and large-scale deportations of
unauthorized workers. Because such policy shifts would affect the overall economy broadly, and
would ripple out well beyond the agricultural sectors, an analysis of such policy changes are beyond
the scope of this study. However, during previous national immigration debates, there was research
into economic effects of tightening immigration. The 112th Congress (2011-2013) considered
multiple policy measures that would have restricted immigration and to support those debates, the
U.S. Department of Agriculture’s Economic Research Service conducted extensive research into the
effects of various immigration reform scenarios. An ERS 2012 study analyzed the effects of dramatic
immigration policy changes because overall, labor costs make up approximately 17% of the variable
20 | P a g ecosts of production in U.S. agriculture as a whole. The Agricultural Resource Management survey in
2018 indicated that labor costs make up 13% of total farm expenses, and for some agricultural
production sectors, labor costs approach 40% of total costs (see Figure 16).
Figure 16. Hired Labor Costs as a Percent of Total Expenses in U.S. Agriculture, by Production
Specialization, 2018.
Source: USDA, Economic Research Service using data from USDA’s 2018 Agricultural Resource Management Survey
The 2012 study used a simulation analysis to estimate the impact of a 5.8-million-person reduction
in the number of unauthorized workers—agricultural and nonagricultural. This was compared to a
base forecast which simulated how the economy would evolve under current laws and policies at
the time of the study. Using simulation models to analyze the policy proposals was appropriate as
the question pertained to the future or “what if?” and thus no actual data or results existed. The
study made a 15-year projection of the results in agriculture and the overall U.S. economy.
In the study, the unauthorized workforce was assumed to decrease by 2.1 million over the first 5
years. In year 5, the unauthorized workforce in the U.S. economy as a whole would be 4.0 million
people smaller than in the base forecast. Growth in the unauthorized workforce was assumed to
resume thereafter but at a slower pace than in the base forecast. By year 15, the projected size of
the unauthorized workforce was 8.5 million, compared with 14.3 million in the base forecast, a
difference of 5.8 million, or 40%.
The long-run results from the decreased unauthorized labor supply showed a reduction in the labor
supply to agriculture with effects on agricultural output and exports. Fruit, tree nuts, vegetables,
and nursery production were among the most affected sectors with long-run relative declines of
2.0% to 5.4% in output and 2.5% to 9.3% in exports. These effects were smaller in other, less labor-
21 | P a g eintensive, parts of agriculture—a 1.6% to 4.9% decrease in output and a 0.3% to 7.4% decrease in
exports.
The number of unauthorized workers employed as farmworkers fell by between 34.1% and 38.8%,
relative to the base forecast for year 15. The number of farmworkers who were either U.S.-born or
foreign-born, permanent residents increased by about 2.4% to 4.0% in the long run, compared with
the base forecast, and their wage rate increased by 3.3% to 7.5%. However, the increased farm
employment of U.S.-born and other permanent resident workers was not sufficient to offset the
decrease in unauthorized farmworkers. As a result, the total number of farmworkers decreased by
3.4% to 5.5%.
Model results suggested that wages would rise for U.S.-born and other permanent resident
workers, relative to the base forecast, in some lower paying occupations where unauthorized
workers are common. Wages would decrease slightly in many higher paying occupations, and
decrease on average. Several factors accounted for the slight decrease in earnings. First, the
decrease in the supply of unauthorized labor would lead to a long-run relative decrease in
production, not just in agriculture but in all sectors of the economy. This, in turn, reduces incomes
to many complementary factors of production, including U.S.-born and foreign-born, permanent
resident workers in higher paying occupations. Second, with the departure of so many unauthorized
workers, the occupational distribution of U.S.-born and other permanent resident workers
necessarily shifts in the direction of more hired farm work and other lower paying occupations, such
as food service, child care, and housekeeping, and away from higher paying occupations which is a
much larger category. The effect of this compositional change was to reduce the average real wage
for U.S.-born and foreign-born, permanent resident workers in all sectors of the economy, even as
real wages in many lower paying occupations rose.
In the long term, overall gross national product accruing to U.S.-born and foreign-born, permanent
residents would fall by about 1%, compared with the base forecast. This result indicated that the
negative economic effects generated by the departure of a significant portion of the labor force
outweighed the positive effects on the wages of U.S.-born workers and other permanent residents
employed in lower paying occupations.
The results and conclusions of the study are broadly consistent with previous research related to
immigration and labor markets pertaining to agriculture. A key assumption in this study is that the
elasticity of labor supply is significantly less than infinite, which as is supported by most of the
research on the topic (Zhaniser, et. al.). The implication of this assumption is that native-born
workers would not simply replace a large reduction in in foreign-born workforce at the same wage
level. Figure 12 which reports growth in the U.S. labor force, shows that growth in the labor force
from native-born workers is trending toward zero, which begs the question— where would the
native-born workers come from? Given the assumption that labor supply is less than infinite,
researchers generally conclude or predict the following outcomes given a reduction in the supply of
foreign-born workers:
22 | P a g e• Real wages increase in response to the decreased supply of workers
• Increased wages result in a reduction in the demand for workers and agricultural
employment falls
• Agricultural output declines as farmers abandon labor intensive enterprises
• Mechanization and technological advances replace labor in the long run
Huffman (2007) and Martin (2009) emphasize that the response to rising wages is more dramatic on
the demand for labor as compared to the supply. Martin and Calvin (2010) comment that “most
analysts conclude that farmers will mechanize or reduce production before raising wages high
enough to induce U.S. farmworkers into the fields.”
2.6 Future Trends in Immigration
An apparent growing consensus among immigration researchers is that legal and illegal low-skilled
immigration into the U.S. has peaked and will decline in the coming decades, even if U.S. policies do
not put tighter controls on immigration. Hanson, Liu and McIntosh (2017) expressed the following
sentiment in a recent article—“The policy dilemma facing the United States is thus not so much
how to arrest massive increases in the supply of foreign labor, but rather how to prepare for a
lower-immigration future”. Table 2 summarizes issues identified by Hanson, Liu and McIntosh
(2017) with added trends and implications for the U.S. labor market.
23 | P a g eTable 2. Summary of Trends and Implications Related to Immigration affecting the U.S. Labor Market
Source: Hanson, Liu and McIntosh (2017)
It is important to note that just as the COVID-19 pandemic affected the U.S. economy, it also had
major implications for the economic conditions in immigrant-origin countries. Mexico, the top
country of origin for immigrants in 34 U.S. states, was launched into its worst recession in 90 years
with an 8.5% reduction in gross domestic product (GDP) in 2020. The country is expected to make a
partial economic recovery in 2021, regaining up to 5% of GDP, but is not projected to fully recover
until 2024. Aside from this, the trends and implications detailed in Table 2 are likely unaffected by
COVID-19 disruptions.
24 | P a g eCHAPTER 3: LABOR MARKET SITUATION IN LEADING HOG PRODUCTION STATES
This chapter focuses on the labor market situation and the trends likely affecting hog producing
firms in the eight largest hog producing states. These states are Illinois, Indiana, Iowa, Minnesota,
Missouri, Nebraska, North Carolina, and Ohio. According to the 2017 USDA Census of Agriculture
these 8 states represent 37 percent of U.S. hog operations and 81 percent of the U.S. hog inventory.
As such, labor statistics from these states provide a representative cross section of the U.S. hog
industry.
After the last recession, unemployment rates fell dramatically in the eight leading hog producing
states. While unemployment rates in four (Ohio, North Carolina, Illinois, Missouri) of the eight
states were at or near the December 2019 national unemployment of 3.6 percent, four (Nebraska,
Iowa, Minnesota, Indiana) of the eight had unemployment levels significantly below the national
average in the same period (Figure 17). Labor markets in these leading pork production states are
clearly tightening more than the national market during normal economic times. After nine months
of COVID-19 related shocks, December 2020 unemployment rates were again lower than the
national unemployment rate for all selected states except Illinois.
Figure 17. Unemployment Rate in Eight Largest Hog Producing States, 12/2009, 12/2019, 12/2020
Source: Authors' Calculations using data from Bureau of Labor Statistics, Quarterly Census of Employment and Wages.
25 | P a g eYou can also read