Re-entering Agflation - World Food Prices to Hit Record High

Page created by Steve Barker
 
CONTINUE READING
Re-entering Agflation - World Food Prices to Hit Record High
Re-entering Agflation
World Food Prices to Hit Record High
Re-entering Agflation - World Food Prices to Hit Record High
Re-entering Agflation
                                   World Food Prices to Hit Record High

                                                                                                                                                                 Luke Chandler
                                                                                                                                                                 luke.chandler@rabobank.com

                                                                                                                                                                 Nick Higgins
                                                                                                                                                                 nicholas.higgins@rabobank.com

Rabobank International              Disclaimer: This document is issued by Coöperatieve Centrale Raiffeisen-Boerenleenbank B.A. incorporated in the Netherlands, trading as
                                    Rabobank International (“RI”). The information and opinions contained in this document have been compiled or arrived at from sources
Agri Commodities Market Research    believed to be reliable, but no representation or warranty, express or implied, is made as to their accuracy, completeness or correctness.
                                    This document is for information purposes only and is not, and should not be construed as, an offer or a commitment by RI or any of its
Food & Agribusiness                 affiliates to enter into a transaction, nor is it professional advice. This information is general in nature only and does not take into account
Research and Advisory               an individual’s personal circumstances. All opinions expressed in this document are subject to change without notice. Neither RI, nor other
                                    legal entities in the group to which it belongs, accept any liability whatsoever for any loss howsoever arising from any use of this document
agrimarketsresearch@rabobank.com    or its contents or otherwise arising in connection therewith. This document may not be reproduced, distributed or published, in whole
www.rabotransact.com                or in part, for any purpose, except with the prior written consent of RI. All copyrights, including those within the meaning of the Dutch
                                    Copyright Act, are reserved. Dutch law shall apply. By accepting this document you agree to be bound by the foregoing restrictions.
                                    © Rabobank International Utrecht Branch, Croeselaan 18, 3521 CB, Utrecht, the Netherlands +31 30 216 0000
Re-entering Agflation - World Food Prices to Hit Record High
Contents | i

Contents
                                                                                                                                                                                                Page

Executiv e summar y . . . . . . . . . . . . . . . . . . . . . . . . . . . . . . . . . . . . . . . . . . . . . . . . . . . . . . . . . . . . . . . . . . . . . . .                                 1

Section 1
The price of food will incr ease fur ther . . . . . . . . . . . . . . . . . . . . . . . . . . . . . . . . . . . . . . . . . . . . . . . . . . . . .                                               3
  Not a case of déjà vu for food prices: Why 2013 will be different to 2008 . . . . . . . . . . . . . . . . . . . . . . . . . .                                                                   4
  Regional effects: Asia, the Middle East and North Africa to slow demand . . . . . . . . . . . . . . . . . . . . . . . . . .                                                                     6
  Free markets are out the window when food prices are on the table . . . . . . . . . . . . . . . . . . . . . . . . . . . . .                                                                     9

Section 2
Global agr icultur al prices spik e, again . . . . . . . . . . . . . . . . . . . . . . . . . . . . . . . . . . . . . . . . . . . . . . . . . . . . .                                             13
  Agricultural commodity prices to remain high for some time yet . . . . . . . . . . . . . . . . . . . . . . . . . . . . . . . . .                                                               14
  Speculative influence has diminished . . . . . . . . . . . . . . . . . . . . . . . . . . . . . . . . . . . . . . . . . . . . . . . . . . . . . . . . . . . .                                   16
  Demand rationing to hit biofuels and animal protein industries . . . . . . . . . . . . . . . . . . . . . . . . . . . . . . . . . .                                                             17
  Second order impacts—the knock-on effects . . . . . . . . . . . . . . . . . . . . . . . . . . . . . . . . . . . . . . . . . . . . . . . . . . . .                                              18
  Grains and oilseeds . . . . . . . . . . . . . . . . . . . . . . . . . . . . . . . . . . . . . . . . . . . . . . . . . . . . . . . . . . . . . . . . . . . . . . . . . . . . .                  19
  Animal protein . . . . . . . . . . . . . . . . . . . . . . . . . . . . . . . . . . . . . . . . . . . . . . . . . . . . . . . . . . . . . . . . . . . . . . . . . . . . . . . . . .             19
    Chicken . . . . . . . . . . . . . . . . . . . . . . . . . . . . . . . . . . . . . . . . . . . . . . . . . . . . . . . . . . . . . . . . . . . . . . . . . . . . . . . . . . . . . .          20
    Pork . . . . . . . . . . . . . . . . . . . . . . . . . . . . . . . . . . . . . . . . . . . . . . . . . . . . . . . . . . . . . . . . . . . . . . . . . . . . . . . . . . . . . . . . . .     20
    Beef . . . . . . . . . . . . . . . . . . . . . . . . . . . . . . . . . . . . . . . . . . . . . . . . . . . . . . . . . . . . . . . . . . . . . . . . . . . . . . . . . . . . . . . . . .     20
  Dairy . . . . . . . . . . . . . . . . . . . . . . . . . . . . . . . . . . . . . . . . . . . . . . . . . . . . . . . . . . . . . . . . . . . . . . . . . . . . . . . . . . . . . . . . . . .    21
  Beverages . . . . . . . . . . . . . . . . . . . . . . . . . . . . . . . . . . . . . . . . . . . . . . . . . . . . . . . . . . . . . . . . . . . . . . . . . . . . . . . . . . . . . .          21
    Soft drinks . . . . . . . . . . . . . . . . . . . . . . . . . . . . . . . . . . . . . . . . . . . . . . . . . . . . . . . . . . . . . . . . . . . . . . . . . . . . . . . . . . . .          21
    Beer . . . . . . . . . . . . . . . . . . . . . . . . . . . . . . . . . . . . . . . . . . . . . . . . . . . . . . . . . . . . . . . . . . . . . . . . . . . . . . . . . . . . . . . . . .     22
  Value-added processing . . . . . . . . . . . . . . . . . . . . . . . . . . . . . . . . . . . . . . . . . . . . . . . . . . . . . . . . . . . . . . . . . . . . . . . . .                       22
  Farm inputs . . . . . . . . . . . . . . . . . . . . . . . . . . . . . . . . . . . . . . . . . . . . . . . . . . . . . . . . . . . . . . . . . . . . . . . . . . . . . . . . . . . . .          23
Re-entering Agflation - World Food Prices to Hit Record High
Executive summary | 1

Executive summary

       Skyrocketing agricultural commodity prices        and, consequently, we expect agricultural
       are causing the world to re-enter a period of     commodity prices—particularly for grains
       agflation, with food prices forecast to reach     and oilseeds—to remain at elevated levels
       new record highs in 2013.                         for at least the next 12 months.

         • Agricultural commodity production has         This time around, the most affected
           plunged as droughts in the US, South          commodities are largely used in animal feed
           America and Russia have diminished crop       and are not core food staples of the world’s
           prospects and tightened already low           developing economies. This is a very different
           inventory levels.                             scenario from that in 2008, when declining
                                                         wheat stocks and several national bans on
         • The social impact should be different to
                                                         rice exports limited the amount of grains
           2008 as this time around crop shortages
                                                         available for direct human consumption.
           are affecting feed intensive crops such as
                                                         We estimate that world corn (soybean) stocks
           corn and soybeans, rather than core food
                                                         will fall to only 51 (73) days of use at the
           staples such as wheat and rice.
                                                         end of 2012/13, compared to 62 (83) days in
         • Food security remains a highly sensitive      2007/08, whereas wheat and rice stocks are
           issue in many regions, and we expect to       expected to improve over the same period
           see a return of government interventions,     (see Figure 0.2). Stocks of core food staples,
           which could exacerbate food and               such as rice and wheat, are forecast to
           commodity price volatility.                   comprise a larger share of total grain and
                                                         oilseed stocks in 2012/13 at 61 percent versus
         • The rally in grain and oilseed prices will
                                                         53 percent in 2007/08. As a result, while corn
           have a significant knock-on effect to
                                                         and soybean prices are at record highs, wheat
           animal protein industries and other
                                                         and rice prices are more than 30 percent
           processing supply chains−raising prices
                                                         lower than their 2008 peaks.
           for meat consumers and challenging
           processor margins around the globe.           A more subdued non-food inflationary
                                                         environment will result in less social pressure
       Food price inflation is once again
                                                         from rising food prices this time around. Non-
       accelerating, triggered by the worst drought
                                                         food inflationary pressure relative to 2008 will
       the United States (US) has seen in nearly a
                                                         also be reduced by weaker global growth,
       century and exacerbated by droughts in
                                                         lower energy prices and reduced freight costs.
       South America and Russia. Rabobank analysis
                                                         However, as in 2008, increased government
       suggests world food prices may reach an
                                                         stockpiling, trade restrictions and other forms
       all-time high in Q1 2013, peaking in Q3 2013
                                                         of intervention remain a significant threat as
       (see Figure 0.1). In order for demand rationing
                                                         governments look to abate the local effects
       to take place and encourage a supply
                                                         of higher international prices.
       response, prices will need to stay high
Re-entering Agflation - World Food Prices to Hit Record High
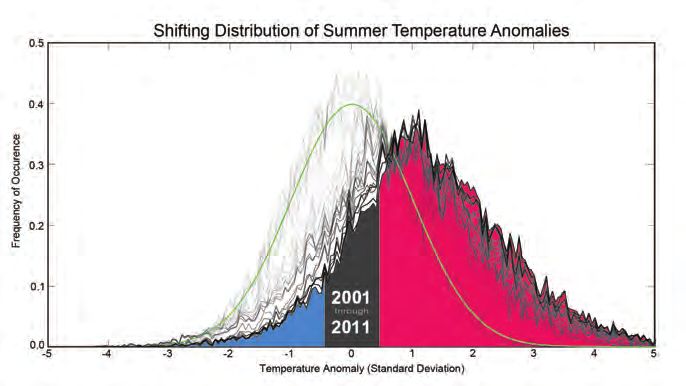
2 | Rabobank Re-entering Agflation

                                                                                     The impact of higher grain and oilseed prices
                                                                                     will be significant for the animal protein and
                                                                                     dairy sectors as they are likely to be squeezed
                                                                                     by higher feed costs. The long production
                                                                                     cycles of the animal protein and dairy
                                                                                     industries will have lingering effects on global
                                                                                     food prices as herds (especially cattle) take
                                                                                     longer to rebuild—maintaining upward
                                                                                     pressure on food prices. The full effect of this
                                                                                     commodity price rally and the subsequent
                                                                                     lower meat and milk output, will be a multi-
                                                                                     year rebuilding of herds, which will sustain
                                                                                     high price levels of these products.
                                                                                     Meanwhile, effects on the beverages and
                                                                                     value-added products (VAP) sectors will be
                                                                                     more muted as grains and oilseeds constitute
                                                                                     a smaller part of the overall production costs.

  Figure 0.1: Rabobank forecasts that the FAO Food Price Index                                                                                                Figure 0.2: Soybean and corn inventories are set to decline to
  will hit new record highs in early 2013                                                                                                                     lower levels than 2008, while wheat and rice are more abundant

          550                                                                                                                                   275                                            110
          500                                                                                                                                   250                                            100
                                                                                                                                                              global stocks (million tonnes)

          450                                                                                                                                   225                                             90
          400                                                                                                                                   200
                                                                                                                                                                                                80
  index

                                                                                                                                                      index

          350                                                                                                                                   175
                                                                                                                                                                                                70
          300                                                                                                                                   150
          250                                                                                                                                                                                   60
                                                                                                                                                125
          200                                                                                                                                   100                                             50

          150                                                                                                                                    75                                             40
                         Mar 01

                                                                                                                     Mar 11
                Mar 00

                                  Mar 02
                                           Mar 03
                                                    Mar 04
                                                               Mar 05
                                                                        Mar 06
                                                                                 Mar 07
                                                                                          Mar 08
                                                                                                   Mar 09
                                                                                                            Mar 10

                                                                                                                              Mar 12
                                                                                                                                       Mar 13

                                                                                                                                                                                                          Corn   Soybeans      Rice   Wheat   Combined

            S&P Agri Index                                   FAO Food Price Index (RHS)                                                                                                        Average (97-06)   07/08      12/13f

  Source: FAO, Rabobank, 2012                                                                                                                                 Source: USDA, Rabobank, 2012
Section 1 The price of food will increase further | 3

1 The price of food will increase further

           The coming year will likely see the world                                  Q1 2012. These impacts, combined with
           economy re-enter a period of agflation as                                  a less certain outlook for Australian grain
           grain and oilseed stocks decline to critically                             production, have accelerated the trend
           low levels, pushing the FAO Food Price Index                               of decreasing inventories across the grains
           above record nominal highs set in February                                 and oilseeds complex and pushed agricultural
           2011. These high food prices have been                                     commodity prices near record highs. Global
           triggered by droughts in several key growing                               grain and oilseed stocks are now forecast to
           regions, led by the 2012 US drought, the worst                             decline for the third consecutive year, and
           since 1936. At the end of August, severe (or                               higher food prices are still needed to meet
           worse) drought conditions covered over                                     the clear and present need for a reduction
           42 percent of the US mainland (see Figure 1.1).                            in global demand.
           As a result, 2012/13 grain and oilseed
                                                                                      Our modelling suggests that the FAO Food
           production is likely to see a reduction of
                                                                                      Price Index will rally another 15 percent from
           over 8 percent YOY, from already depressed
                                                                                      31 August 2012 levels to 243 points by
           levels. Despite higher planted acreage, this
                                                                                      30 June 2013 (see Figure 1.2). July readings of
           year has also seen a drought in Russia as well
                                                                                      the index saw a 6 percent increase after prices
           as La Niña-related dryness, which impacted
                                                                                      had fallen during the previous four months,
           the harvesting of South American crops in
                                                                                      although the index stagnated in August.

            Figure 1.1: Drought conditions in the US are the worst since 1936, the Dust Bowl era

                       L                                                                          S
                                                        SL
                                  SL                                  SL
                  SL
                                                                                           SL L
                                                             SL
                           SL                                                  SL
                                                SL
                                                                  L                    L

                                                                                                          Drought Impact Types:
                            L
                                                                                                              Delineates dominant impacts

                                           L                               L                              S = Short-term, typically 6 months
                                                                                                          (e.g. hydrology, ecology)

                D0 Abnormally dry              D1 Drought - moderate                D2 Drought - severe

                D3 Drought - extreme           D3 Drought - exceptional

            Source: USDA, Rabobank, 2012
4 | Rabobank Re-entering Agflation

                                                                                      We expect future gains in the FAO Food Price                                                  for placement onto feed lots (CME Feeder
                                                                                      Index to be faster in the near term, with food                                                Cattle) are expected to increase by 6 percent
                                                                                      prices expected to rally 12 percent from 31                                                   and 8 percent, respectively, over that same
                                                                                      August levels by the end of 2012 and growth                                                   period. Price rallies in these markets lag those
                                                                                      slowing to 2 percent for the first half of 2013.                                              of grains markets due to the downstream
                                                                                      Peak aggregate food prices, according to our                                                  nature of the industry, with animal protein
                                                                                      current estimates, should therefore occur                                                     companies needing to adjust to higher feed
                                                                                      during the Q2/Q3 transition in 2013.                                                          costs. This involves reducing the size of the
                                                                                                                                                                                    animal herd, initially creating a supply glut,
                                                                                      Fundamentals remain much tighter than
                                                                                                                                                                                    which then leads to higher prices as supplies
                                                                                      current official market estimates, with existing
                                                                                                                                                                                    drop. Dairy prices are expected to respond
                                                                                      food price records, set in 2011, likely to be
                                                                                                                                                                                    more quickly as herd reductions translate into
                                                                                      broken as the severity of the situation
                                                                                                                                                                                    higher milk prices on a shorter scale—
                                                                                      becomes clear. As a result of droughts in
                                                                                                                                                                                    although rebuilding dairy herds also has a
                                                                                      key exporting countries and rapid demand
                                                                                                                                                                                    long cycle, prolonging any shortage created.
                                                                                      growth in developing countries, the
                                                                                                                                                                                    Grain and oilseed prices are not expected to
                                                                                      combined global wheat, rice, corn and
                                                                                                                                                                                    be major direct contributors to further food
                                                                                      soybean stocks-to-use is expected to fall to
                                                                                                                                                                                    price moves, with average grain prices
                                                                                      19.6 percent in 2012/13—only 0.4 percent
                                                                                                                                                                                    increasing 6 percent by 30 June 2013, offset
                                                                                      above 2007/08 levels. Combined stocks-to-
                                                                                                                                                                                    by falling CBOT Soybean prices, which we
                                                                                      use for these key commodities had fallen
                                                                                                                                                                                    expect to fall nearly 12 percent over the same
                                                                                      14 percentage points in the eight years
                                                                                                                                                                                    period. Divergence between grain and oilseed
                                                                                      to 2007/08. Although the timing of price
                                                                                                                                                                                    prices is driven by the relative importance of
                                                                                      changes remains uncertain, we believe that
                                                                                                                                                                                    South America in the oilseeds complex, where
                                                                                      the FAO Food Price Index provides a useful
                                                                                                                                                                                    a good harvest is expected to relieve some of
                                                                                      proxy for prices paid by world consumers
                                                                                                                                                                                    the supply-driven price pressure.
                                                                                      for food, and gives an indication of how
                                                                                      agricultural commodity prices may translate
                                                                                                                                                                                    Not a case of déjà vu f or f ood pr ices:
                                                                                      into prices at the local shop. The model uses
                                                                                                                                                                                    Why 2013 will b e diff erent to 2008
                                                                                      our house forecasts for commodity futures
                                                                                                                                                                                    The spike in world food prices this year is
                                                                                      prices, futures curves for livestock prices,
                                                                                                                                                                                    expected to ration animal feed, unlike the
                                                                                      and momentum factors to anticipate
                                                                                                                                                                                    staple grain shortage of 2008. We estimate
                                                                                      future changes.
                                                                                                                                                                                    that world grain and oilseed stocks will fall
                                                                                      Meat and dairy prices, which comprise                                                         to only 71 days of use by the end of 2012/13,
                                                                                      52 percent of the FAO Food Price Index, are the                                               compared to 70 days in 2007/08. Despite
                                                                                      primary drivers of our forecast for further food                                              the two events seeming similar, we expect
                                                                                      price increases (see Figure 1.3). The price of                                                social pressure for food availability to be
                                                                                      pork, demonstrated by the lean hog futures                                                    lessened as consumers switch consumption
                                                                                      curve, is expected to rally 31 percent from                                                   from animal protein back towards staple
                                                                                      spot prices by 30 June 2013. Cattle ready                                                     grains—an option not available in 2007/08
                                                                                      for slaughter (CME Cattle) and cattle ready                                                   due to severe shortages of wheat and rice.

  Figure 1.2: The FAO Food Price Index is forecast to rise to new                                                                                             Figure 1.3: Meat and dairy prices comprise 52% of the FAO Food
  record levels in 2013                                                                                                                                       Price Index

          550                                                                                                                                   275                                         Sugar 7%
          500                                                                                                                                   250
          450                                                                                                                                   225
                                                                                                                                                                       S&POils
                                                                                                                                                                       FAO Agri
                                                                                                                                                                           Food14%Index
                                                                                                                                                                                   Price Index (RHS)              Meat 35%

          400                                                                                                                                   200
  index

                                                                                                                                                      index

          350                                                                                                                                   175
          300                                                                                                                                   150
          250                                                                                                                                   125
          200                                                                                                                                   100
          150                                                                                                                                    75                   Cereals 27%
                         Mar 01

                                                                                                                     Mar 11
                Mar 00

                                  Mar 02
                                           Mar 03
                                                    Mar 04
                                                               Mar 05
                                                                        Mar 06
                                                                                 Mar 07
                                                                                          Mar 08
                                                                                                   Mar 09
                                                                                                            Mar 10

                                                                                                                              Mar 12
                                                                                                                                       Mar 13

                                                                                                                                                                                                          Dairy 17%

            S&P Agri Index                                   FAO Food Price Index (RHS)

  Source: FAO, Bloomberg, Rabobank, 2012                                                                                                                      Source: FAO, Rabobank, 2012
Section 1 The price of food will increase further | 5

                                                                               Our analysis indicates that world stocks of                                                                             in five of the thirteen marketing years since
                                                                               soybeans in the 2012/13 season will fall to                                                                             the turn of the millennium (see Figure 1.4).
                                                                               just 73 days of use (-6 YOY) while corn stocks
                                                                                                                                                                                                       In fact, world wheat stocks are expected to
                                                                               will fall to just 51 days of use (-4 YOY). These
                                                                                                                                                                                                       end this season with 90 days of use (-14 YOY)
                                                                               numbers compare to 83 days and 62 days,
                                                                                                                                                                                                       and should remain considerably higher than
                                                                               respectively, for the 2007/08 season. As this
                                                                                                                                                                                                       the 76 days of use reached in 2007/08
                                                                               season’s decline in stocks is concentrated in
                                                                                                                                                                                                       (see Figure 1.5). Rice stocks are also significantly
                                                                               corn and soybeans (used largely in animal
                                                                                                                                                                                                       more plentiful this time around with 81 days
                                                                               feeds), stock tightness can be alleviated
                                                                                                                                                                                                       of use (-2 YOY) compared with just 69 days in
                                                                               through reduced meat and dairy consumption.
                                                                                                                                                                                                       2007/08. Export bans in major rice exporting
                                                                               These effects will be masked in the shorter
                                                                                                                                                                                                       countries, including India and Vietnam, were
                                                                               term as higher slaughter rates temporarily
                                                                                                                                                                                                       a key component of the 2008 record rally in
                                                                               increase meat supply. The longer term effect
                                                                                                                                                                                                       rice prices, with August 2012 rice prices of
                                                                               will be reduced animal herd sizes, which will
                                                                                                                                                                                                       USD 15.6 per cwt still 34 percent below the
                                                                               drive down production and increase prices.
                                                                                                                                                                                                       2008 peak. While there have been some
                                                                               Unlike in 2007/08, higher prices will linger this
                                                                                                                                                                                                       concerns with the sub-par Indian monsoon,
                                                                               time, even if increased production alleviates
                                                                                                                                                                                                       at this stage production has not been as
                                                                               pressure on underlying grain fundamentals
                                                                                                                                                                                                       adversely affected as in 2008. Additionally,
                                                                               as herds take time to rebuild.
                                                                                                                                                                                                       non-grain and oilseed prices have remained
                                                                               The crisis of 2008 was many years in the                                                                                more subdued, with sugar—a large food-
                                                                               making, with stocks-to-use declining across                                                                             price component—falling 16 percent YTD.
                                                                               the grains and oilseeds complex beginning                                                                               However, with the reference #11 sugar price
                                                                               in 2000 as emerging market and biofuel                                                                                  trading at USc 20 per lb, prices remain well
                                                                               demand accelerated. The 2008 crisis was                                                                                 above the 2008 average price of USc 12 per lb,
                                                                               a signal that there was not enough growth                                                                               with prices declining from their peak of USc
                                                                               in production or investment in agriculture                                                                              35 per lb in February 2010.
                                                                               to meet the accelerated growth rate in
                                                                                                                                                                                                       Meat consumption will be significantly more
                                                                               consumption. The subsequent price response
                                                                                                                                                                                                       affected than the consumption of grain
                                                                               incentivised the largest grain and oilseed
                                                                                                                                                                                                       (e.g. bread) as demand rationing will be
                                                                               harvest ever in 2008/09. However, the record
                                                                                                                                                                                                       focused in the feed grains complex. One
                                                                               crop was not sufficient to rebuild depleted
                                                                                                                                                                                                       direct consequence of this, due to the long
                                                                               inventory levels as consumption growth
                                                                                                                                                                                                       animal protein and dairy production cycles,
                                                                               kept pace with production increases.
                                                                                                                                                                                                       will be that price effects will linger longer as
                                                                               Ultimately, prices dropped and output
                                                                                                                                                                                                       herds (especially cattle) take longer to rebuild.
                                                                               faltered in 2010/11, prompting another
                                                                                                                                                                                                       As herds are liquidated this will increase
                                                                               agricultural commodity rally. The coming
                                                                                                                                                                                                       supplies in the short term and depress prices.
                                                                               decline in world grain and oilseed stocks
                                                                                                                                                                                                       In the medium/longer term this will maintain
                                                                               reinforces the longer term trend of
                                                                                                                                                                                                       upward pressure on food prices as meat
                                                                               consumption surpassing production,
                                                                                                                                                                                                       and dairy supplies contract.
                                                                               with production only outpacing supply

Figure 1.4: Combined world stocks-to-use for wheat, rice, corn                                                                                            Figure 1.5: Combined world stocks-to-use for wheat, rice, corn
and soybeans began to decline in 1999/2000                                                                                                                and soybeans improved following 2007/08, but are forecast
                                                                                                                                                          to decline for the third consecutive year in 2012/13
          34                                                                                                                     2,400                                                 120
          32                                                                                                                     2,300                                                 110
                                                                                                                                                          days of use (world stocks)

          30                                                                                                                     2,200                                                 100
                                                                                                                                         million tonnes

          28                                                                                                                     2,100                                                  90
percent

          26                                                                                                                     2,000                                                  80
          24                                                                                                                     1,900                                                  70
          22                                                                                                                     1,800                                                  60
          20                                                                                                                     1,700                                                  50
          18                                                                                                                     1,600                                                  40
                       00/01

                                                                                                        10/11
               99/00

                               01/02
                                       02/03
                                               03/04
                                                       04/05
                                                               05/06
                                                                       06/07
                                                                                07/08
                                                                                        08/09
                                                                                                09/10

                                                                                                                11/12
                                                                                                                        12/13f

                                                                                                                                                                                              07/08

                                                                                                                                                                                                             08/09

                                                                                                                                                                                                                            09/10

                                                                                                                                                                                                                                          10/11

                                                                                                                                                                                                                                                        11/12

                                                                                                                                                                                                                                                                      12/13f

           Stocks/use                      Consumption (RHS)                               Production (RHS)                                                                            Corn       Soybeans           Rice           Wheat             Combined

Source: FAO, Rabobank, 2012                                                                                                                               Source: USDA, Rabobank, 2012
6 | Rabobank Re-entering Agflation

                                     Low growth, lower oil prices and weaker                                 that the share of global demand reduction
                                     consumer confidence levels are all likely to                            will be proportionally larger in the Middle
                                     lessen the impact of higher food prices this                            East, North Africa and Asia, where demand
                                     time around. Persistent economic output                                 is more elastic and where lower incomes
                                     gaps relative to pre-2008 levels have recently                          drive consumers to reduce animal protein
                                     contained, and will likely continue to contain                          and milk consumption in favour of staple
                                     inflationary pressures. This is an important                            grains (see Figure 1.7).
                                     difference compared to 2007/08 as there was
                                                                                                             Higher prices will stall the long-term trend
                                     no output gap in that period and broadly
                                                                                                             towards higher animal protein diets in
                                     based inflationary pressures drove food prices
                                                                                                             developing economies. Rabobank expects
                                     higher. The US dollar—the currency commonly
                                                                                                             the developing world—with its high demand
                                     used for pricing world grains—has depreciated
                                                                                                             elasticity, especially to meat—to ration import
                                     11 percent since its peak in late 2008, which
                                                                                                             demand of grains, oilseeds and meat most
                                     also helps to alleviate the food price pressures
                                                                                                             heavily, leading consumption growth to slow
                                     of the first half of 2012 in importing nations.
                                                                                                             and even recede for a period as prices rise.
                                     Crude oil prices are lower than in 2008,
                                                                                                             Ultimately, the extent of this season’s price
                                     reducing bullish pressure on input costs such
                                                                                                             hikes for corn and soybeans is likely to reduce
                                     as fertiliser and fuel, which are highly related
                                                                                                             meat consumption growth in the coming
                                     to energy prices, and therefore alleviating
                                                                                                             years, moving counter to the longer term
                                     some pressure on agricultural commodity
                                                                                                             trend of increasing animal protein
                                     prices (see Figure 1.6). Despite this, some
                                                                                                             consumption. This is a form of demand
                                     pressure remains, with a mild US economic
                                                                                                             rationing—as on a calorie-for-calorie basis
                                     recovery underway, strong emerging market
                                                                                                             meat and dairy products require multiples
                                     growth, and geopolitical tensions in the
                                                                                                             of grain inputs used in direct grain
                                     Middle East inducing average prices of over
                                                                                                             consumption—and will reduce pressure
                                     USD 110 per barrel for Brent crude oil over
                                                                                                             on global grain and oilseed balance sheets.
                                     the last 12 months. If economic growth picks
                                     up and oil prices rise, there could be further                          Meat demand reduction in the Middle East
                                     bullish pressure on agricultural commodity                              and North Africa is likely to cut grain imports
                                     prices in 2013.                                                         9 percent YOY in 2012/13. Meat price elasticity
                                                                                                             in these regions averages -0.5, in line with
                                     Regional eff ects: Asia, the M iddle E ast                              Asia, but likely understates the true sensitivity
                                     and N or th Africa to slo w demand                                      to price increases due to high income, small
                                     Rabobank expects that emerging market                                   population states such as Kuwait. However,
                                     demand for animal proteins will be most                                 reduction in grain import demand in some
                                     affected by higher food prices. Although high                           countries (Morocco is one such case) will be
                                     prices will be felt chiefly in the meat and dairy                       limited by post-Arab spring wariness as
                                     sectors, and although the developed world                               higher prices for staple grains are commonly
                                     consumes a disproportionate share of these                              considered a key catalyst for the kind of
                                     products, food makes up a smaller share of                              unrest seen in recent years. In order to limit
                                     developed world budgets with consumers                                  the risk of another period of widespread
                                     less responsive to price changes. This means                            social unrest, governments in these regions

                                      Figure 1.6: Agricultural commodity prices and energy prices
                                      remain strongly correlated

                                                   600                                                               160
                                                   550                                                               140
                                                   500
                                                                                                                     120
                                                   450
                                                                                                                           index value

                                                                                                                     100
                                      USD/barrel

                                                   400
                                                   350                                                                80
                                                   300                                                                60
                                                   250
                                                                                                                      40
                                                   200
                                                   150                                                                20
                                                   100                                                                 0
                                                         2000

                                                                 2002

                                                                        2004

                                                                                    2006

                                                                                               2008

                                                                                                      2010

                                                                                                              2012

                                                     Brent Crude Oil           S&P Agri Index (RHS)

                                      Source: Bloomberg, Rabobank, 2012
Section 1 The price of food will increase further | 7

Figure 1.7: Meat price elasticity of demand is highest in the developing world where meat comprises a larger share of household budgets

     Very high (-.50 to -0.65)

     High (-.45 to -0.50)

     Medium (-.40 to -0.45)

     Moderate (-.25 to -0.40)

     Low (-.25 to -0.35)

     No information available

Source: USDA, Rabobank, 2011

                                  may choose to keep domestic prices                              imports will remain supported with the
                                  artificially low. Large hard-currency reserves,                 region maintaining a share of nearly a third
                                  generally derived from oil export revenue,                      of global wheat imports (see Figure 1.8).
                                  provide additional support for government
                                                                                                  Asian demand is also expected to decline as
                                  purchases. Despite this, Rabobank expects the
                                                                                                  increasing prices interact with high animal
                                  regions to import under 78 million tonnes of
                                                                                                  protein demand elasticity, with much of the
                                  grain in 2012/13—the lowest amount since
                                                                                                  region lacking protectionist policies. Although
                                  2007/08. Imports would be even lower, but
                                                                                                  the region may move to adopt more
                                  base import demand has been increased due
                                                                                                  protectionist measures (see pages 9 to 11)
                                  to lower yields in 2011/12 in grain producing
                                                                                                  we believe that higher food prices will
                                  areas of North Africa. Although feed grain
                                                                                                  ultimately lower animal protein consumption,
                                  demand is likely to fall, we expect that staple
                                                                                                  and therefore reduce meat imports.

                                    Figure 1.8: The Middle East and North African regions rely heavily on grain and oilseed imports,
                                    comprising a third of global wheat trade

                                                                          Tunisia                            Syria
                                                                                                                                                     Afghanistan
                                                 Morocco                                          Israel              Iraq               Iran
                                                                                                           Jordan
                                                                                                                                Kuwait
                                                             Algeria
                                                                                    Libya      Egypt
                                                                                                                    Saudi Arabia

                                                                                                                                         Oman

                                                                                                                             Yemen

                                    Share of global wheat trade
8 | Rabobank Re-entering Agflation

                                                 Meat price elasticity averages -0.52 in South                 of the recent rally is expected to be more
                                                 Korea, Vietnam, Malaysia and Indonesia. Even                  benign, with the recent rally in international
                                                 if governments undertake protectionist                        prices seeing them gain (but not meet)
                                                 measures to encourage imports, as mooted                      higher Chinese prices (see Figure 1.9).
                                                 by South Korea in early August, we expect
                                                                                                               Domestic inflationary pressure will also
                                                 that animal protein imports (chiefly those
                                                                                                               be alleviated by falling asset prices as the
                                                 from the US) will fall as the US domestic
                                                                                                               Shanghai Composite Equity Index, down
                                                 animal protein sector is squeezed by higher
                                                                                                               14 percent from its May 2012 peak, is
                                                 costs. In this way, we see much of the decline
                                                                                                               correlated, with a nine-month lag, to
                                                 in US feed demand, and subsequent meat
                                                                                                               food price inflation (see Figure 1.10). This
                                                 production, ultimately falling on Asian
                                                                                                               relationship between equity prices and food
                                                 consumption—tempering the recent trend
                                                                                                               price inflation suggests that wealth effects
                                                 of rapidly increasing US meat exports into
                                                                                                               may drive part of Chinese households’
                                                 this region.
                                                                                                               consumption behaviour. Lower perceived
                                                 Demand rationing is expected to be limited                    wealth may therefore temper growth in
                                                 in China, the world’s largest net importer of                 per capita meat consumption.
                                                 food, with net imports of grains and oilseeds
                                                                                                               Demand from developed net importing areas
                                                 increasing to new record highs in 2012/13.
                                                                                                               is generally unresponsive to changes in food
                                                 This will see net imports jump 19 percent to
                                                                                                               prices. Europe and Japan are the second and
                                                 89 million tonnes in the 2012/13 marketing
                                                                                                               third largest importers of global grains and
                                                 year, with soybean imports the chief driver of
                                                                                                               oilseeds, respectively. They are also the only
                                                 demand—although corn and wheat imports
                                                                                                               developed economies included in the world’s
                                                 are also expected to increase. Soybean
                                                                                                               top 30 importers. Demand for grains in these
                                                 imports, of which China imports 70 percent
                                                                                                               countries is so inelastic that responsiveness
                                                 of world trade, are expected to be 62 million
                                                                                                               to price changes is statistically zero—though
                                                 tonnes in 2012/13, a 4 percent increase YOY.
                                                                                                               higher meat elasticity is expected to result
                                                 Despite higher prices, it is the government
                                                                                                               in some reductions in animal protein
                                                 rather than consumers that will face
                                                                                                               consumption. Despite low price elasticity, we
                                                 international markets, muting the
                                                                                                               expect demand in Japan and Europe will slow
                                                 transmission of higher prices to the Chinese
                                                                                                               marginally, with importing end users acting
                                                 consumer. The Chinese government’s ability
                                                                                                               to protect profits through stock drawdowns,
                                                 to act quickly was exemplified by the
                                                                                                               but otherwise ultimately able to pass higher
                                                 21 August announcement that China will
                                                                                                               prices through to the consumer. However,
                                                 redistribute commercial importers’ unused
                                                                                                               longer term consequences of food price
                                                 2012 quotas for wheat, corn, rice, sugar and
                                                                                                               inflation may be particularly visible in Europe,
                                                 cotton (there is no soybean quota). This
                                                                                                               potentially increasing pressure on
                                                 signals the Chinese government’s desire
                                                                                                               governments to repeal bans on growing
                                                 for imports to continue. Chinese domestic
                                                                                                               genetically modified (GM) crops or to reverse
                                                 prices for corn and soybean have been above
                                                                                                               biofuel mandates. Stagnating economic
                                                 USD 8.00/bu and USD 16.00/bu, respectively,
                                                                                                               growth provides additional support for this
                                                 since early 2011. Therefore, the price shock

  Figure 1.9: Chinese soybean prices have long been higher than                     Figure 1.10: China’s food prices are closely correlated to the
  those in the US (and internationally) with the recent rally                       performance of financial assets, such as the Shanghai
  seeing the margin decrease                                                        Composite Equity Index presented below
              850                                                                            7,000                                                          30

              750                                                                            6,000                                                          25
                                                                                                                                                            20
              650                                                                            5,000
  USD/tonne

                                                                                                                                                            15
              550                                                                            4,000
                                                                                                                                                                  percent
                                                                                     index

                                                                                                                                                            10
              450                                                                            3,000
                                                                                                                                                             5
              350                                                                            2,000
                                                                                                                                                             0
              250                                                                            1,000                                                           -5

              150                                                                               0                                                           -10
                                                                                                     2005

                                                                                                            2006

                                                                                                                    2007

                                                                                                                             2008

                                                                                                                                      2009

                                                                                                                                              2010

                                                                                                                                                     2011
                    2006

                           2007

                                  2008

                                          2009

                                                       2010

                                                               2011

                                                                       2012

              Dalian Soybeans     CBOT Soybeans                                                Shanghai Composite          CPI - Food (RHS)

  Source: USDA, Bloomberg, 2012                                                      Source: NBSC, Bloomberg, Rabobank, 2012
Section 1 The price of food will increase further | 9

                                                                    hypothesis as cost conscious consumers are                                                           developing nations—a figure which expands
                                                                    more likely to react to higher meat prices,                                                          to 27 percent once fish and dairy
                                                                    increasing the popularity of policies that                                                           consumption are included—which means
                                                                    increase grain production and reduce prices.                                                         an increase in commodity prices will have a
                                                                                                                                                                         larger impact on household budgets in these
                                                                    Rising feed costs will have a substantial
                                                                                                                                                                         regions compared to developed countries.
                                                                    impact on the US livestock industry but
                                                                                                                                                                         With food comprising such a large share
                                                                    domestic meat consumption will be less
                                                                                                                                                                         of spending, especially in Asia, increases
                                                                    affected. The US has the lowest meat price
                                                                                                                                                                         in food prices could possibly have knock-
                                                                    elasticity in the world, with consumption
                                                                                                                                                                         on effects in demand growth of other
                                                                    least likely to drop in response to higher
                                                                                                                                                                         commodities and consumer spending
                                                                    prices. However, the effects on the US
                                                                                                                                                                         more broadly (see Figure 1.12).
                                                                    livestock complex will be extensive and,
                                                                    despite inelastic domestic demand, meat
                                                                                                                                                                         Free mar kets ar e out the windo w
                                                                    product exports are likely to fall. The US
                                                                                                                                                                         when f ood pr ices ar e on the table
                                                                    became a net exporter of animal protein in
                                                                                                                                                                         Increases in commodity stockpiling and
                                                                    2006, with rapid increases in Asian demand
                                                                                                                                                                         other interventionist measures, such as export
                                                                    driving exports up by 14 percent per annum
                                                                                                                                                                         bans, are a distinct possibility in 2012/13
                                                                    since (see Figure 1.11). Relatively inelastic
                                                                                                                                                                         as governments react to protect domestic
                                                                    demand in the US should see this trend
                                                                                                                                                                         consumers from increasing world food prices.
                                                                    reversed in 2013, with meat imports rising
                                                                                                                                                                         Rabobank sees Asian and Middle Eastern
                                                                    while exports fall as other countries are
                                                                                                                                                                         countries as the most likely first movers, with
                                                                    unable to afford the higher prices that US
                                                                                                                                                                         large foreign currency reserves and large
                                                                    exporters will demand. This trend could be
                                                                                                                                                                         portions of household expenditure exposed
                                                                    exacerbated by increases in grain stockpiling
                                                                                                                                                                         to food prices encouraging early action to
                                                                    as other nations protect domestic industries
                                                                                                                                                                         protect social order (see Figure 1.13).
                                                                    and consumption, supporting US grain and
                                                                                                                                                                         Increased government intervention will likely
                                                                    oilseed exports while slowing the animal
                                                                                                                                                                         add to increasing world commodity and
                                                                    protein export complex.
                                                                                                                                                                         food prices with domestic stockpiles meaning
                                                                    Ultimately, we expect that the effects of                                                            that a larger portion of already low global
                                                                    higher global prices will be contingent upon                                                         stocks sits idle. We expect that localised
                                                                    the political sensitivity of higher price moves                                                      efforts to increase stockpiles would be
                                                                    as well as the size of government foreign                                                            counterproductive at the global level, with
                                                                    reserves. We believe that many of the largest                                                        those countries least able (or willing) to pay
                                                                    importing countries will be able to stabilise                                                        higher prices likely to see greater moves
                                                                    domestic prices by implementing domestic                                                             in domestic food price inflation. This is a
                                                                    procurement programmes, which could                                                                  vicious circle, with governments committing
                                                                    offset the effects of higher global prices                                                           to domestic stockpiling and other
                                                                    and cushion domestic consumption.                                                                    interventionist measures earlier than
                                                                    Grains, oilseeds and meat make up at least                                                           usual—recognising the risk of being left
                                                                    20 percent of discretionary income in                                                                out as exportable stocks decline further.

Figure 1.11: US pork, veal and beef exports should come under                                                                 Figure 1.12: Food comprises a much larger share of consumer
pressure as Asian importers reduce demand due to                                                                              budget in Asia than in higher income countries,
higher prices                                                                                                                 such as the US     Exports
                                                                                                                                                 production
                  4                                                                                     25                              50
                 3.5                                                                                                                    45                                Imports
                                                                                                        23                              40
                  3
                                                                                                                                        35
                                                                                                        21
million tonnes

                                                                                                             million tonnes

                 2.5                                                                                                                    30
                                                                                                                              percent

                  2                                                                                     19                              25
                 1.5                                                                                                                    20
                                                                                                        17                              15
                  1
                                                                                                                                        10
                                                                                                        15
                  .5                                                                                                                     5
                  0                                                                                     13                               0
                       1960

                              1965

                                     1970

                                               1975

                                                      1980

                                                             1985

                                                                     1990

                                                                            1995

                                                                                   2000

                                                                                          2005

                                                                                                 2010

                                                                                                                                             Philippines

                                                                                                                                                           India - CPI

                                                                                                                                                                          Vietnam

                                                                                                                                                                                    Indonesia

                                                                                                                                                                                                Thailand

                                                                                                                                                                                                           China

                                                                                                                                                                                                                   Malaysia

                                                                                                                                                                                                                              Hong Kong

                                                                                                                                                                                                                                          Taiwan

                                                                                                                                                                                                                                                   Singapore

                                                                                                                                                                                                                                                               Korea

                                                                                                                                                                                                                                                                       US

                   Imports                  Exports          Production (RHS)

Source: USDA, Rabobank, 2012                                                                                                  Source: Bloomberg, Rabobank, 2011
10 | Rabobank Re-entering Agflation

  Figure 1.13: Higher food prices had significant geopolitical consequences in 2008 as riots occurred in many regions

       Food riots, 2007-2008

  Source: USDA, Rabobank, 2011

                                      Russian export bans may not be imposed, but           • A Mexican entity purchased the fourth-
                                      we expect the effects to be similar, with               largest single order of corn ever from the
                                      demand for exports in the Black Sea region              US. A chicken import tariff was introduced
                                      outstripping available supplies for export.             in response to reported US dumping of
                                      These pressures have risen again due to                 chicken legs and thighs.
                                      intense drought crippling Black Sea wheat
                                                                                            • South Korea is currently considering
                                      production. Grain export bans, emanating
                                                                                              whether to introduce a domestic
                                      from the Black Sea region—led by Russia—
                                                                                              purchasing regime for grains and oilseeds.
                                      have historically been a threat to grain price
                                      stability, although recent comments by the            • China’s soybean purchases show little to
                                      Russian government suggest bans are                     no sign of slowing down, with 12 million
                                      unlikely in the near term. We expect that if            tonnes of the 2012/13 US soybean crop
                                      export bans are not imposed by Russia,                  sold—a 14 percent increase in new crop
                                      internal Black Sea region trade will grow to            sales compared to this point in 2011.
                                      see Kazakhstani wheat moved into Russia in
                                                                                            • Iran—a country that is usually self-
                                      early 2013 to offset the rapid pace of Russian
                                                                                              sufficient in wheat, importing only
                                      exports seen in Q3 2012. This will have an
                                                                                              0.5 million tonnes in 2010/11—has
                                      effect similar to an export ban: reducing the
                                                                                              reportedly transacted several sales of over
                                      available Black Sea region surplus, albeit with
                                                                                              1 million tonnes of wheat from both
                                      lower near-term price volatility. This solution
                                                                                              Pakistan and India, and purchases of rice
                                      still means the market has to adjust to lower
                                                                                              and corn could follow, placing further
                                      wheat supplies but delays the impact—
                                                                                              pressure on global grain and oilseed
                                      kicking the can further down the road.
                                                                                              balance sheets.
                                      Rabobank has been monitoring several
                                                                                            • Indonesia is repealing import tariffs on
                                      events that could be the beginning of a
                                                                                              soybeans to protect domestic tofu
                                      trend towards larger government purchases
                                                                                              processors, and has announced plans to
                                      in 2013.
                                                                                              increase grain stockpiles.
Section 1 The price of food will increase further | 11

Expectations of further increases in food
prices and high supply uncertainty will see
competition for world food inventories
increase, resulting in reduced stocks in major
exporting countries. China and India have
increased their shares of global stocks in
the past five seasons in order to combat high
domestic prices (see Figure 1.14). The
increasing shares of China and India have
come at the expense of US inventories; the US
is forecast to have 11 percent of global stocks
in 2012/13, down from 20 percent in 2005/06.
As the scale of damage to the US corn and
soybean crops becomes more apparent,
Rabobank expects there will be a renewed
tendency to increase domestic stockpiles in
China, but this will be constrained by the low
supply. As US stocks have continually fallen
since 2005/06, and are now at pipeline levels
for most grains and oilseeds, further increases
in US exports to support stockbuilding
in China are not possible. Chinese imports
will have to originate from further afield,
increasing competition and disrupting
traditional trading partnerships. Other
countries will therefore have to outbid
incremental Chinese demand, placing
further pressure on agricultural commodity
prices. Given the high prices and low
availability of exportable supply, we
anticipate the Chinese share of global
stocks will fall in coming seasons as their
strategic reserves are drawn down.

 Figure 1.14: The share of wheat, rice, corn and soybean stocks held
 by the world’s largest countries has declined since 1999/2000

                           100
                            90
                            80
 global stocks (percent)

                            70
                            60
                            50
                            40
                            30
                            20
                            10
                             0
                                                           00/01

                                                                                                                                           10/11
                                   97/98
                                           98/99
                                                   99/00

                                                                   01/02
                                                                           02/03
                                                                                   03/04
                                                                                           04/05
                                                                                                   05/06
                                                                                                           06/07
                                                                                                                   07/08
                                                                                                                           08/09
                                                                                                                                   09/10

                                                                                                                                                   11/12
                                                                                                                                                           12/13

                           China             India                 US                Other

 Source: USDA, Rabobank, 2012
Section 2 Global agricultural prices spike, again | 13

2 Global agricultural prices spike, again

            Global grain and oilseed prices are currently     Many comparisons have been made to the
            experiencing their third major rally in only      devastating drought of 1988, when corn
            five years as a combination of adverse            production fell 31 percent YOY. However,
            weather and robust demand keeps global            according to heat and precipitation records,
            stocks at record low levels (see Figure 2.1).     the damage to this year’s crop may be even
            As often occurs in major agricultural price       more severe. June to August precipitation and
            rallies, the trigger in 2012 has been a           heat in the central US, where most of the US
            weather-induced supply shock. This has            row crops are produced, is likely to result in
            been supported by a sustained period of           the least favourable growing conditions seen
            strengthening agricultural commodity              since the Dust Bowl (peaking in 1936), and
            demand; all the while, inventory levels have      the third worst in over a century. Our crop
            been unable to be replenished. Over the past      modelling indicates that there may still be a
            five seasons, low grain and oilseed stocks        considerable downside from current official
            have left the market without any buffer to        production forecasts, which reflects our bias
            adverse growing conditions. This is a short-      that prices are unlikely to have reached a high
            term versus long-term problem, with the           at this stage of the season. The market may
            short-term supply response thus far unable        still need to price in further reductions to
            to meet the requirements of longer term           output as well as a risk premium associated
            demand for feed grains to supply the animal       with the coming South American crops.
            protein consumption growth in emerging
                                                              Production setbacks this season have not
            market economies and the rapid acceleration
                                                              been limited to the US, with a number of key
            in world biofuel demand experienced over
                                                              regions suffering adverse seasonal conditions
            the past decade. Given the inability for prices
                                                              in 2012. Widespread droughts in South
            to incentivise a sufficient supply response
                                                              America and Russia together with a sub-par
            during these recent price rallies, we expect
                                                              Indian monsoon, disease issues in China and
            the 2012 price reaction will need to be
                                                              some dry conditions in Western Australia,
            strong and sustained.
                                                              have all negatively impacted world grain and
            The primary catalyst of the current               oilseed production this season. We estimate
            agricultural price rally has been devastating     that this season’s adverse weather has slashed
            droughts in the US, South America and Russia,     over 165 million tonnes from the global grain
            which have slashed grain and oilseed              and oilseed balance sheet. Taken together
            production expectations. US corn production       with already tight stock levels coming into
            is now forecast to fall 29 percent below          the season, this underscores the need for a
            initial USDA expectations, a 14 percent           relatively unprecedented amount of demand
            decline YOY and the lowest level in nine          rationing in the global grains and oilseeds
            years, despite record plantings this season.      sector. Global corn consumption is likely to
14 | Rabobank Re-entering Agflation

                                                Figure 2.1: Wheat, corn and soybean prices are experiencing
                                                their third major price rally in five years—setting records for
                                                soybeans and corn
                                                             18
                                                             16
                                                             14
                                                             12

                                                USD/bushel
                                                             10
                                                              8
                                                              6
                                                              4
                                                             2
                                                              0

                                                                                                                                         2011
                                                                  2003

                                                                         2004

                                                                                  2005

                                                                                            2006

                                                                                                    2007

                                                                                                           2008

                                                                                                                     2009

                                                                                                                                2010

                                                                                                                                                2012
                                                                  CBOT Wheat               CBOT Corn              CBOT Soybeans

                                                Source: Bloomberg, Rabobank, 2012

                                              decline YOY for the first time in 17 years.                                               However, we still expect prices to remain
                                              However, total global grain use is likely to                                              above long-run average levels, unless there
                                              exceed production for the seventh time                                                    is a major demand shock in the market, such
                                              in 14 years.                                                                              as a major policy change (e.g. biofuels) or a
                                                                                                                                        global recession.
                                              Agricultur al commo dit y pr ices
                                                                                                                                        The scale of the production setbacks this
                                              to remain high f or some time y et
                                                                                                                                        season will underscore the need for an almost
                                              Record high agricultural commodity
                                                                                                                                        unprecedented amount of demand rationing.
                                              prices will be required over the next 12 to
                                                                                                                                        We believe that this will be a much more
                                              24 months in order to cut demand and
                                                                                                                                        difficult task than current livestock and
                                              encourage a production response from
                                                                                                                                        ethanol production margins would suggest.
                                              the world’s farmers next season. We expect
                                                                                                                                        Entrenched demand, feedback effects from
                                              agricultural commodity prices will peak
                                                                                                                                        animal protein price increases, hedged
                                              somewhere between Q4 2012 and Q1 2013
                                                                                                                                        production margins within the hog and
                                              as new crop prospects in Brazil and Argentina
                                                                                                                                        cattle sectors and the US ethanol mandate
                                              are showing signs of trend line yields being
                                                                                                                                        (Renewable Fuel Standard-RFS) will likely
                                              achieved for corn and soybeans. Beyond this
                                                                                                                                        mean that elevated agricultural commodity
                                              period, we anticipate an easing in prices if
                                                                                                                                        prices will be required for the entire
                                              seasonal conditions normalise and world
                                                                                                                                        marketing year and beyond in order to
                                              inventory levels can recover (see Figure 2.2).
                                                                                                                                        sufficiently limit both US and global use.

  Figur e 2.2: Rabobank quar terly a verage gr ain and oilseed pr ice forecasts

                                      Q4’09   Q1’10           Q2’10       Q3’10          Q4’10     Q1’11   Q2’11        Q3’11          Q4’11    Q1’12   Q2’12   Q3’12   Q4’12   Q1’13   Q2’13

  Wheat (CBO T)        USc/bu          522     496                467       653           707       786      745            690         615      643     642     860     880     900     920

  Wheat (Matif )     EUR/tonne         129     125                132       200           225       252      233            199         186      210     212     255     261     267     273

  Corn                 USc/bu          386     370                355       422           562       670      731            696         620      641     617     790     800     810     820

  Soybeans             USc/bu         1,002    955                957     1,035          1,245     1,379   1,361            1,356      1,175    1,272   1,426   1,725   1,685   1,600   1,450

  Soy oil              USc/lb         38.1    38.6                38.1     40.2          51.0      57.0     57.2            55.7       50.6     52.9    52.2    53.0    52.5    52.0    51.0

  Soymeal             USD/ton          306     278                281       305           338       367      353            352         302      339     413     510     490     420     375

  Palm oil          MYR/tonne         2,309   2,577           2,527       2,650          3,293     3,675   3,362            3,097      3,016    3,219   3,245   2,850   2,900   3,000   3,100

  Source: Bloomberg, Rabobank, 2012
Section 2 Global agricultural prices spike, again | 15

                                                         Several key factors are likely to support                              commodity prices are needed to encourage
                                                         US domestic demand, reducing world export                              improved production in South America, the
                                                         availability and supporting prices into                                Black Sea region and the US in the short term.
                                                         2012/13 and beyond as global grain and                                 High fertiliser prices, which are linked with
                                                         oilseed stocks decline more than expected:                             stubbornly high energy prices, remain a
                                                                                                                                key cost of production for agricultural
                                                                 • US broiler egg sets are up 1 percent YOY,
                                                                                                                                commodities (see Figure 2.3). Other rising
                                                                   and chick placements are flat YOY as of
                                                                                                                                production costs, such as improved seed
                                                                   8 September.
                                                                                                                                technology and rising land rents, will also
                                                                 • The US pork industry had the opportunity                     prove to be increasing hurdles to farmer
                                                                   to use futures markets to lock in profit                     profitability, and will require higher prices
                                                                   margins for 2012, which would likely                         as an incentive to invest in expanded
                                                                   shield margins from rising feed costs                        production. Additionally, the bulk of potential
                                                                   until 2013.                                                  acreage gains are in countries with high
                                                                                                                                political risks, causing a larger risk premium
                                                                 • US consumers are able (and historically
                                                                                                                                to be associated with the investments
                                                                   willing) to pay high prices for animal
                                                                                                                                required. Despite these opportunities to
                                                                   protein. The USDA estimates that the US
                                                                                                                                build production, it is unlikely that inventories
                                                                   has the most inelastic meat demand of
                                                                                                                                will be substantially rebuilt in only one
                                                                   any country.
                                                                                                                                season, with consecutive seasons of
                                                                 • Despite the US ethanol mandate, use                          favourable conditions and increased
                                                                   is likely to prove inelastic even if the                     plantings required to alleviate the pressures
                                                                   mandate is relaxed as oxygenate                              of low inventory levels within the global
                                                                   requirements and strong blending                             grains and oilseeds complex.
                                                                   margins above USD 0.60 per gallon
                                                                                                                                Weather risks remain, with intensifying
                                                                   support demand.
                                                                                                                                concerns in Russia, India and Western
                                                                 • Declining corn use for ethanol                               Australia, supporting wheat prices
                                                                   production also detracts one-third of                        and limiting the amount of wheat-for-corn
                                                                   a bushel of distillers dried grains (DDG)                    substitution in global feed rations. Wheat
                                                                   feed for every bushel used for ethanol—                      substitution in feed rations has been a major
                                                                   intensifying soymeal and corn use in feed                    mitigating factor to short corn supplies in
                                                                   rations. We expect there to be a loss of                     the past 12 months. However, weather risks
                                                                   4.5 million tonnes YOY of high protein                       are threatening production in major wheat
                                                                   DDGs production in the 2012/13                               producing regions, namely Russia, where
                                                                   marketing year.                                              wheat production is now forecast to fall
                                                                                                                                30 percent YOY, albeit from record high
                                                         The incremental cost of increasing
                                                                                                                                levels. Given the magnitude of the wheat
                                                         agricultural output, which is vital to rebuilding
                                                                                                                                production shortfall in Russia, there are
                                                         global buffer stocks, is growing larger and
                                                                                                                                lower estimates of available export surpluses.
                                                         supporting higher equilibrium agricultural
                                                                                                                                Restrictions on exports are likely to come
                                                         commodity prices. Higher agricultural
                                                                                                                                either in the form of a ban or Russia importing

Figure 2.3: Despite lower oil prices than in 2008, cost of US corn                                     Figure 2.4: Substantial threats to rebuilding stocks from
production remained higher as land rental and seed prices                                              current levels remain, with rice yields likely to deteriorate
rose strongly                                                                                          if El Niño eventuates
           700                                                                                                   3                                                                          24

           600                                                                                                   2                                                                          18

           500                                                                                                   1                                                                          12
USD/acre

                                                                                                                 0                                                                           6
                                                                                                       percent

           400
                                                                                                                                                                                                  index

           300                                                                                                   -1                                                                          0

           200                                                                                                   -2                                                                          -6

           100                                                                                                   -3                                                                         -12

             0                                                                                                   -4                                                                         -18
                                                                                                                                                 2000/01

                                                                                                                                                                                  2010/11
                                                                                                                      1990/91

                                                                                                                                 1995/96

                                                                                                                                                                  2005/06
                                                                            2011

                                                                                       2012f

                                                                                               2013f
                     2005

                                2006

                                         2007

                                                  2008

                                                          2009

                                                                     2010

           Seed             Fertiliser and chemicals

           Fuel, lube, and electricity          Land rental equivalent         Other                             Rice yield        Southern Oscilation Index (RHS)

Source: USDA, Bloomberg, Rabobank, 2011                                                                Source: BOM, USDA, Bloomberg, Rabobank, 2012
16 | Rabobank Re-entering Agflation

                                      Kazakhstani wheat, removing Black Sea                                    weather-risk premiums during early phases
                                      region wheat from the international market.                              of the growing season. This will be especially
                                                                                                               evident during the first half of the calendar
                                      A strengthening El Niño pattern threatens to
                                                                                                               year when Northern Hemisphere summer
                                      erode non-US seaborne grain supplies as the
                                                                                                               row crops are being planted.
                                      Australian East Coast growing areas often
                                      experience drought during El Niño periods.
                                                                                                               Specula tiv e influenc e has diminished
                                      The risk of lower Australian East Coast
                                                                                                               The recent rally in global grain and oilseed
                                      production this season seems relatively minor
                                                                                                               prices has been predominantly driven by
                                      as precipitation to date has been sufficient,
                                                                                                               fundamentals. The speculative positions in
                                      although a lack of moisture on the West Coast
                                                                                                               corn, the most heavily traded agricultural
                                      still stands to reduce production from last
                                                                                                               futures market have been lower than the
                                      year’s record crop. El Niño would also place
                                                                                                               previous price rally in 2010/11. A possible
                                      pressure on global rice balance sheets with
                                                                                                               reason for this is the uncertain macro
                                      global yields historically correlated to the
                                                                                                               environment this time around, due to
                                      Southern Oscillation Index as dryness
                                                                                                               economic troubles in the EU and slowing US
                                      hampers planting (see Figure 2.4). These
                                                                                                               growth, which has created a more cautionary
                                      ongoing production risks are another
                                                                                                               environment. However, there has been a
                                      factor that will likely keep global grain and
                                                                                                               significant inflow of investor money as the
                                      oilseed prices at elevated levels over the
                                                                                                               severity of the US drought became clear.
                                      next year due to the need for increased
                                      weather risk premiums.                                                   Managed money has doubled its net long
                                                                                                               position in the agricultural complex, growing
                                      Longer term agricultural commodity prices
                                                                                                               from 430,160 contracts to 811,152 contracts
                                      are expected to be supported by the
                                                                                                               since mid-June, but down from 2010 peaks
                                      increased number of extreme weather events
                                                                                                               (see Figures 2.6 and 2.7). Over half of the
                                      which continue to hamper inventory building.
                                                                                                               increase has come from position building
                                      Extreme weather reduces the ability of global
                                                                                                               CBOT Corn contracts with managed
                                      growers to respond to increased demand,
                                                                                                               money net long positions rising from
                                      with heat stress during critical summer
                                                                                                               260,154 contracts to 323,629 contracts over
                                      periods offsetting higher planted acreage
                                                                                                               the period. This inflow of long positions may
                                      and increasing pre-harvest abandonment.
                                                                                                               have helped sustain the upward momentum
                                      Heat stress risks were recently highlighted
                                                                                                               of prices. However, the direction and for
                                      in a multi-decade study by NASA showing
                                                                                                               the most part, the magnitude of the price
                                      mean summer temperatures and volatility
                                                                                                               move needed have been the result of
                                      increasing uniformly since the 1960s
                                                                                                               fundamentally driven events this season.
                                      (see Figure 2.5). Price shocks as a result of
                                      low grain and oilseed stocks will likely                                 Evidence from recent rallies demonstrates
                                      continue to be exacerbated by adverse                                    differing outcomes with speculators
                                      weather. Subsequently, we expect commodity                               withdrawing 92 percent of their net long
                                      prices in futures markets to reflect increased                           positions following the 2007/08 peak, and

                                       Figure 2.5: Changing temperature anomalies, as observed by NASA, show volatility has been
                                       increasing; the flattening of this distribution shows that a wider range of extreme temperatures is
                                       now occurring compared to past decades

                                       Reference years 1951 to 1980

                                       Source: NASA/Goddard Space Flight Center GISS and Scientific Visualization Studio, Rabobank, 2012
Section 2 Global agricultural prices spike, again | 17

                                                                  prices falling 47 percent over the same                                                     evident in reduced ethanol production in
                                                                  period. However, the next largest drawdown                                                  the US and then, as hedge coverage declines
                                                                  in net long positions, -73 percent in 2011,                                                 into Q1 2013, in the North American animal
                                                                  saw prices fall 26 percent, suggesting that                                                 protein sector. Ethanol production will remain
                                                                  fundamentals following this period required                                                 a feature in the US, although it will decrease
                                                                  still higher prices than speculators were                                                   for the first time in 17 years in 2012/13. There
                                                                  willing to bet on. If fundamental data                                                      are indicators that this decrease may begin
                                                                  continues to deteriorate, and demand                                                        soon, with current ethanol production margins
                                                                  for agricultural commodities proves as                                                      near the worst in the industry’s history.
                                                                  entrenched as we forecast, speculative net
                                                                                                                                                              World feed consumption demand is nearly
                                                                  longs in the agricultural complex should
                                                                                                                                                              impervious to price shocks in the short term,
                                                                  continue to rise, surpassing record levels set
                                                                                                                                                              with global demand rising in 36 out of the
                                                                  in September 2010. Further supporting the
                                                                                                                                                              last 47 years and only declining 5 percent YOY
                                                                  fundamental, rather than speculative, backing
                                                                                                                                                              on two occasions in the 1974/75 and 1988/89
                                                                  of the 2012 rally is that much of the gain in
                                                                                                                                                              marketing years (see Figures 2.8 and 2.9).
                                                                  prices pre-dated the speculative increases.
                                                                                                                                                              This remains the most difficult portion of
                                                                  This is in sharp contrast to 2008.
                                                                                                                                                              the balance sheet to forecast as strategic
                                                                                                                                                              geopolitical decisions, including stockpiling,
                                                                  Demand r ationing t o hit biofuels and
                                                                                                                                                              tariffs and export bans, will determine how
                                                                  animal pr otein industr ies
                                                                                                                                                              much strain is placed on major grain and
                                                                  Demand rationing for grains and oilseeds use
                                                                                                                                                              oilseed exporting nations—the largest of
                                                                  is expected to be strongest in the US ethanol
                                                                                                                                                              which is still the US. Rabobank expects
                                                                  industry, where corn use is expected to
                                                                                                                                                              combined global soybean and corn trade of
                                                                  fall 11 percent YOY in the 2012/13 season.
                                                                                                                                                              191 million tonnes in 2012/13, up 4 percent
                                                                  Although US ethanol and short-term animal
                                                                                                                                                              YOY, spurred by Chinese soybean demand.
                                                                  protein production are both relatively
                                                                                                                                                              This will place further pressure on the US
                                                                  inelastic, the scale of the US drought will
                                                                                                                                                              internal stock situation and, ultimately, prices
                                                                  require significant demand destruction across
                                                                                                                                                              for consumers. This will especially be the
                                                                  both industries, in order to contain shortages
                                                                                                                                                              case if government stockpiling increases
                                                                  in feed grains. Importantly, we see declines
                                                                                                                                                              and low demand elasticity means larger price
                                                                  in ethanol use happening within the bounds
                                                                                                                                                              increases are needed in the US as a result.
                                                                  of the ethanol mandate, dictated by the
                                                                  needs of gasoline refineries, with further                                                  Diminished US soybean production and
                                                                  declines possible (but not likely) whether or                                               subsequent evidence of inelastic Chinese
                                                                  not the mandate is waived in the near term.                                                 demand suggest higher prices are needed
                                                                  Global corn and soymeal use for animal feed                                                 to ration demand in 2013. Prices for soymeal
                                                                  is forecast to decline over 6 percent from                                                  and soy oil have also risen, maintaining crush
                                                                  initial 2012/13 USDA estimates in May,                                                      margins, and driving import demand for
                                                                  although it is still set to rise 1 percent from                                             China. Soymeal is seen as the limiting factor
                                                                  2011/12 levels. Rabobank expects that                                                       in the oilseeds complex, demonstrated by its
                                                                  demand rationing will initially be most                                                     69 percent outperformance of soy oil YTD.

Figure 2.6: Net long positions by managed money in the                                                              Figure 2.7: Speculative net longs have been relatively more
agricultural complex have increased to levels seen in 2007/08                                                       concentrated in the grain and oilseed complex during the
but are below 2010/11 highs                                                                                         current agricultural commodity rally
                     1,400                                                                            600                                1,400

                     1,200                                                                            550                                1,200
thousand contracts

                                                                                                      500                                1,000
                                                                                                                    thousand contracts

                     1,000
                                                                                                      450                                 800
                                                                                                            index

                      800
                                                                                                      400                                 600
                      600
                                                                                                      350                                 400
                      400                                                                                                                 200
                                                                                                      300
                      200                                                                             250                                    0
                        0                                                                             200                                -200
                                                                        Jun 10

                                                                                  Jun 11

                                                                                             Jun 12
                             Jun 06

                                      Jun 07

                                                Jun 08

                                                         Jun 09

                                                                                                                                                                                                               2011
                                                                                                                                                 2006

                                                                                                                                                           2007

                                                                                                                                                                     2008

                                                                                                                                                                                    2009

                                                                                                                                                                                                 2010

                                                                                                                                                                                                                           2012

                     Managed money net length                     S&P GS agri commodity Index (RHS)                                        Grains and oilseeds       Soft commodities              Livestock

Source: CFTC, Liffe, Rabobank, 2012                                                                                  Source: CFTC, Liffe, Rabobank, 2012
18 | Rabobank Re-entering Agflation

  Figure 2.8: Global feed use in the grains and oilseeds complex                                                                                   Figure 2.9: History suggests that significant, and recurrent, price
  has increased in 36 out of the past 47 marketing years despite                                                                                   increases are required to significantly ration global feed demand
  escalating prices
              450                                                                                                           900                              20                                                                                                      80
              400
                                                                                                                            800                              15                                                                                                      60
              350
              300                                                                                                           700                              10                                                                                                      40

                                                                                                                                  million tonnes
  USD/tonne

                                                                                                                                                   percent

                                                                                                                                                                                                                                                                           percent
              250
                                                                                                                            600                               5                                                                                                      20
              200
              150                                                                                                           500                               0                                                                                                       0
              100
                                                                                                                            400                               -5                                                                                                     -20
               50
                0                                                                                                           300                              -10                                                                                                     -40

                                                                                                                                                                           70/71

                                                                                                                                                                                                                     90/91
                                                                                                                                                                   66/67

                                                                                                                                                                                   74/75

                                                                                                                                                                                           78/79

                                                                                                                                                                                                   82/83

                                                                                                                                                                                                             86/87

                                                                                                                                                                                                                             94/95

                                                                                                                                                                                                                                     98/99

                                                                                                                                                                                                                                             02/03

                                                                                                                                                                                                                                                     06/07

                                                                                                                                                                                                                                                             12/13
                                                    80/81

                                                                                            00/01
                    64/65

                            68/69

                                    72/73

                                            76/77

                                                            84/85

                                                                    88/89

                                                                            92/93

                                                                                    96/97

                                                                                                    04/05

                                                                                                            08/09

                                                                                                                    12/13

               Feed price                   Feed use (RHS)                                                                                                    Change in feed use                           Change in average price (RHS)

  Source: USDA, Bloomberg, Rabobank, 2012                                                                                                          Source: USDA, Bloomberg, Rabobank, 2012

                                                                            We expect that higher prices for downstream                                                                would only be feasible if the RFS mandate
                                                                            soy products (at the consumer level) are                                                                   were repealed, something that we are not
                                                                            inevitable in open markets, with adjustments                                                               expecting at this point.
                                                                            to US production likely to see the US domestic
                                                                                                                                                                                       As corn production losses cannot be
                                                                            crush fall 175 million bushels YOY to
                                                                                                                                                                                       completely taken out of US ethanol
                                                                            1,530 million bushels in 2012/13. China’s
                                                                                                                                                                                       demand, we expect US livestock corn feed
                                                                            soybean imports continue to grow, reaching
                                                                                                                                                                                       to be reduced by 400 million bushels YOY
                                                                            5.87 million tonnes in July 2012, up
                                                                                                                                                                                       to 4,150 million bushels in 2012/13. The US
                                                                            10 percent from July 2011 before declining
                                                                                                                                                                                       government introduced a USD 383 million
                                                                            2 percent YOY in August to 4.42 million tonnes.
                                                                                                                                                                                       drought relief package, mainly for the
                                                                            We expect that near record-high prices need
                                                                                                                                                                                       livestock industry, which amounts to less than
                                                                            to be sustained as supplies in Brazil, Argentina
                                                                                                                                                                                       46 million bushels of corn at current prices.
                                                                            and the US dwindle into early 2013.
                                                                                                                                                                                       While demonstrating the scope of support
                                                                            We believe that US refinery demand for                                                                     behind the livestock industry, this is equal to
                                                                            ethanol, the only feasible oxygenate                                                                       only 1 percent of the industry’s corn use in
                                                                            for gasoline in the short term, could push                                                                 the 2011/12 marketing year. This will have
                                                                            ethanol prices above current gasoline                                                                      little-to-no effect on the scale of demand
                                                                            prices. Ethanol margins averaged negative                                                                  rationing undertaken in 2012/13. Although,
                                                                            USD 0.06 per gallon over the month                                                                         as will be discussed on page 19, many
                                                                            during August, with production falling                                                                     livestock producers have hedges currently
                                                                            to 820,000 bushels per day, which, if held                                                                 in place, the strength of market pressures is
                                                                            constant during the 2012/13 marketing year,                                                                extraordinary, with US livestock herds likely
                                                                            would imply corn ethanol use of 4,500 million                                                              to be liquidated at an accelerating pace in
                                                                            bushels—in line with Rabobank forecasts.                                                                   1H 2013. Near record-low hog margins of
                                                                            The potential reductions in corn demand                                                                    negative USD 60 per head should begin to
                                                                            for ethanol, initially the most elastic form                                                               reduce production in the US pork industry,
                                                                            of demand due to excess oxygenation                                                                        with other countries following in lock-step
                                                                            of gasoline in the last two years, will see                                                                as lower margins shift the supply of animal
                                                                            production fall 500 million bushels short                                                                  protein to a lower base (see Figure 2.10).
                                                                            of the 5 billion bushels implied by the RFS
                                                                            mandate. In the short term, a 20 percent                                                                   Second or der impac ts—the k nock-on
                                                                            fall in ethanol production would require an                                                                eff ects
                                                                            extra 200,000 barrels per day of oil imports,                                                              Rabobank believes that the new records
                                                                            increasing pressure on retail gasoline prices.                                                             being set in grain and oilseed prices will have
                                                                            Longer term, should negative blending                                                                      long-tailed effects on a number of F&A supply
                                                                            economics at the refinery level be sustained,                                                              chains. Short term, we will see significant
                                                                            the relatively abundant supply of natural                                                                  pressure on quickly processed parts of the
                                                                            gas-derived oxygenate substitutes could                                                                    global grains and oilseeds complex, such as
                                                                            be supported and would pose a threat                                                                       milling, brewing and ethanol. Longer term,
                                                                            to the sustainability of the conventional                                                                  and most importantly, sustained higher prices
                                                                            biofuels industry in the US. However, this                                                                 and lags in animal protein herd adjustments
You can also read