NITROGEN POLLUTION: FROM THE SOURCES TO THE SEA - A Science Links Publication of
←
→
Page content transcription
If your browser does not render page correctly, please read the page content below

NITROGEN POLLUTION:
  FROM THE SOURCES
     TO THE SEA

        A Science Links™ Publication
                   of the
     Hubbard Brook Research Foundation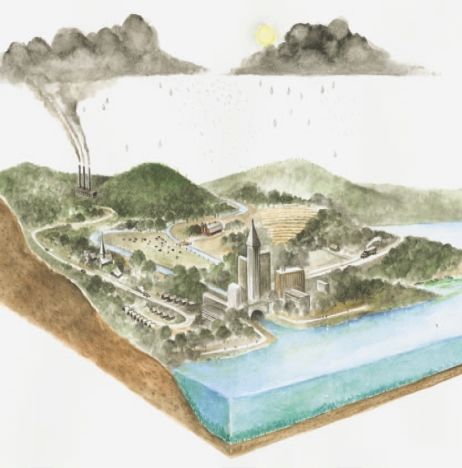
NITROGEN POLLUTION:
  FROM THE SOURCES
     TO THE SEA

        A Science Links™ Publication
                   of the
     Hubbard Brook Research Foundation

                                         PAGE 1
Acknowledgments
  This report is a publication of the HBRF Science LinksTM program. Science LinksTM
has been supported by:
  Jessie B. Cox Charitable Trust
  Davis Conservation Foundation
  McCabe Environmental Fund of the New Hampshire Charitable Foundation
  The Merck Family Fund
  New York State Energy and Research Development Authority
  The John Merck Fund
  The Henry Luce Foundation
  The Orchard Foundation
  Harold Whitworth Pierce Charitable Trust
  The Sudbury Foundation

Figure credits:
Figure 2a: developed by Christine Goodale
Figure 2b: provided by Elizabeth Boyer; Kimberley Driscoll
Figure 3: illustrated by David Baird
Figure 6: illustrated by David Baird
Figure 13b: courtesy of Scott Ollinger
Figure 15: provided by Greg Lawrence, U.S.G.S.
Figure 18: developed by Limin Chen

Photo/Illustration credits:
Cover illustration: David Baird
Sewage treatment plant, pages 1 and 21: EarthTech
Eutrophic water, page 1: W. Bennett, U.S. Geological Survey
Vehicle polluting, page 1: Emma Lee/Life File
Ash ozone damage, pages 1 and 12: National Park Service
White pine ozone injury, page 12: North Carolina Cooperative Extension
Pine stands, page 14: John Aber
Seagrass beds, page 16: Robert Howarth

Other credits:
  Some data used in this publication were obtained from scientists of the Hubbard Brook
Ecosystem Study. PnET-BGC calculations were coordinated by Limin Chen. The Hubbard Brook
Experimental Forest is operated and maintained by the Northeastern Research Station,
U.S. Department of Agriculture, Newtown Square, PA.

Text by: Kathy Fallon Lambert, HBRF and Charles Driscoll, Syracuse University
Copy-editing by: Cathy Donohue (Montpelier, Vermont)
Design by: Mirabile Design (Montpelier, Vermont)
Printing by: Stillwater Graphics (Williamstown, Vermont)

PAGE 2

Summary
     Over the past century, human activity has greatly increased the amount of nitrogen pollution in the environment.
Human sources of reactive nitrogen in the Northeastern U.S (the Northeast) are dominated by airborne nitrogen
emissions that are deposited on the Earth, nitrogen in food and nitrogen fertilizer. Excess reactive nitrogen in the
environment has given rise to a cascade of pollution problems across the Northeast. Fortunately, several policy options
exist for reducing nitrogen pollution and its effects.

Nitrogen Sources
The three largest sources of reactive nitrogen to the Northeast are nitrogen in food, airborne nitrogen emissions
and nitrogen fertilizer.
    Food that is imported to the Northeast accounts for the largest amount of reactive nitrogen in the region
(38-75 percent). Airborne emissions of nitrogen oxides and ammonia and the subsequent deposition from the
atmosphere contribute 11-36 percent; and nitrogen fertilizer adds another 11-32 percent.

Nitrogen Effects
Nitrogen pollution contributes to ground-level ozone, acid rain and acidification of soil and surface waters,
disruption of forest processes, coastal over-enrichment and other environmental issues.
     Forests of the Northeast are experiencing elevated inputs of reactive nitrogen. While this nitrogen may initially
increase forest productivity, it can eventually damage soil, reduce tree growth and produce acidic nitrate runoff to
streams. Nitrate runoff from forests contributes to the acidification of streams and lakes.
     Nitrogen emissions are also the primary source of ground level ozone that damages plants and compromises
human health. It is estimated that forest productivity is diminished by as much as 14 percent in the region due to
high levels of ozone. Approximately 26 million people in the Northeast are exposed to high ozone levels each year.
     Remote forests receive most of their nitrogen pollution from nitrogen deposition, while large populated
watersheds receive nitrogen from many sources. Examples include food imports for humans that result in
nitrogen-rich wastewater, nitrogen emissions that are eventually deposited on the Earth’s surface, and nitrogen
in fertilizer that can run off into surface waters.
     After entering a watershed, reactive nitrogen is transported downstream to estuaries. Fourteen major estuaries in
the Northeast have been classified as “highly impacted” due to elevated nitrogen inputs. These impacts include the
loss of seagrass beds, increased algal blooms, reduced biodiversity and fish kills due to oxygen depletion.

Nitrogen Management
Controls on vehicle and utility emissions of nitrogen oxides produce the largest reductions in airborne
nitrogen pollution in the Northeast.
      The largest sources of airborne nitrogen in the Northeast are vehicles and electric utilities. Therefore, it is not
surprising that reducing emissions from these sources would result in the greatest improvement in airborne nitrogen.
However, according to model results from this study, the emission reductions called for in the 1990 Clean Air Act
Amendments (CAAAs) will not sufficiently reduce nitrogen deposition at the Hubbard Brook Experimental Forest
in New Hampshire or the Biscuit Brook watershed in New York to mitigate elevated nitrogen runoff. Additional
reductions in nitrogen emissions (~30 percent) would reduce nitrogen runoff to less harmful levels.
      The 1990 CAAAs will also not reduce the deposition of acid compounds sufficient to mitigate acid rain effects
in the Biscuit Brook or Hubbard Brook watersheds. However, when additional nitrogen emission reductions and a
simultaneous 75 percent cut in sulfur dioxide emissions from electric utilities beyond the 1990 CAAAs are considered,
it is predicted that Biscuit Brook would achieve nearly full chemical recovery by 2050 and Hubbard Brook would
experience marked improvement in soil conditions and water quality.
Nitrogen removal from wastewater at a basin-wide scale is the single most effective means of reducing
nitrogen loading to estuaries in the Northeast.
     With respect to nitrogen loading to estuaries, model results from this study show that wastewater treatment results
in the largest reduction in loading of reactive nitrogen to Long Island Sound of Connecticut and New York and Casco
Bay of Maine. Nitrogen removal at wastewater treatment plants throughout the watershed and improvements in
septic systems are predicted to reduce nitrogen loading by about 55 percent to Long Island Sound and 40 percent to
Casco Bay.

                                                                                                                  PAGE 3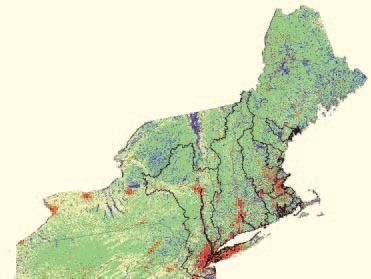
Why assess nitrogen in the environment?
Nitrogen pollution is steadily increasing and has emerged as a pressing
environmental issue of the 21st century.
     Nitrogen is an essential nutrient that is used by all living things. Under pristine
conditions, there is usually not enough nitrogen to go around. Over the past 100 years,
however, conditions have changed. The growing human population has increased
demand for food and energy worldwide. Meeting these demands has increased the
amount of reactive nitrogen1 in the
environment. The primary processes
developed in the past century that
convert unreactive nitrogen to
reactive nitrogen are the manufacture
of fertilizer, the combustion of fossil

                                                                                                                                                    Reactive nitrogen (terragrams per year)
fuels and the planting of nitrogen-

                                                          Human Population (billions)
harnessing croplands (see Figure 1).
     Excess reactive nitrogen in the                                          Natural N Fixation
environment can lead to pollution
problems, including the deterioration
of air quality, disruption of forest
processes, acidification of lakes and
streams, and degradation of coastal
waters. While the global increase in
reactive nitrogen from human
activities supports higher crop yields            1850         1870   1890          1910    1930          1950     1970         1990         2010
                                                                                            Year
and greater energy production, it also
sets off a series of adverse environ-              Global population Total reactive N    N fixation in cropland Fossil fuel N   Industrial N fixation

mental changes known as a “nitrogen
cascade.” Given the combination of
beneficial and harmful effects, nitrogen pollution in the environment is often                                               FIGURE 1: k
referred to as “too much of a good thing.”                                                                                   Human activities
     A group of scientists convened by the Hubbard Brook Research Foundation                                                 have increased the
examined the sources and consequences of nitrogen pollution in the Northeastern                                              production of
United States (the Northeast). This report summarizes their findings. The Northeast                                          reactive nitrogen.
provides an interesting case study in nitrogen pollution because this region:                                                From Galloway
     1. has experienced steady population growth which tends to increase reactive                                            and Cowling 2002.
        nitrogen in the environment (see Figure 2a);
     2. has undergone significant land use change since farm abandonment in the late
        1800s, which influences nitrogen retention and loss (see Figure 2a);
     3. receives large amounts of reactive nitrogen to the air, land and water; and
     4. encompasses a diverse landscape ranging from sparsely populated and
        acid-sensitive forests with few sources of nitrogen to densely populated urban
        areas with multiple sources of nitrogen (see Figure 2b).
This report addresses three major questions regarding nitrogen pollution in the
Northeast:
     1. What are the anthropogenic (i.e. human-derived) sources of reactive nitrogen?
     2. What are the ecological effects of nitrogen pollution?
     3. To what extent will policy options reduce nitrogen pollution and mitigate its
        effects?

1
  Reactive nitrogen refers to all forms of nitrogen that are readily available to biota (largely ammonia,
ammonium and nitrate). Unreactive nitrogen exists mostly as inert N2 gas. In excess, reactive nitrogen
causes nitrogen pollution.

PAGE 4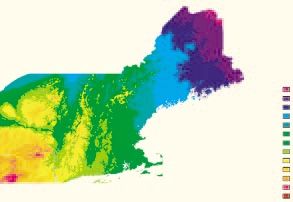
North

                                                                                                                                                                       Casco Bay
                                                                                                                                                                     Great Bay
                                                                                                                                                                     Merrimack Harbor
FIGURE 2a: l                                                                                                                                                         Massachusetts Bay
The study area includes
eight large watersheds
and two upland forested
watersheds.                                                                                                                                                            Buzzards Bay
                                                                                                                                                                   Narragansett Bay
                                                                                                                                                           Long Island Sound
                                                                                                                                                     Raritan Bay
                          20                                                                      80%
                                                                        Percent total land area

                                       New York                                                                                                                    FIGURE 2b:

                                                                                                                                                            k
  Population (millions)

                          15                                                                      60%
                                                                                                                             Forest
                                                                                                                                                             Land use and population
                          10                                                                      40%         Farmland                                       trends. Data sources:
                                                   New England                                                                                               U.S. Bureau of Census
                                                                                                  20%
                          5                                                                                                                                  and U.S. Department of
                                                                                                                     Other                                   Agriculture.
                          0                                                                       0%
                              1850   1900           1950         2000                                  1850   1900          1950      2000
                                            Year                                                                     Year

How does nitrogen become a pollutant?
Nitrogen becomes a pollutant when more reactive nitrogen is released
into the environment than can be assimilated without degrading air,
land and water resources.
     Nitrogen constitutes 78 percent of the Earth’s atmosphere in the basic form of
N2 (diatomic nitrogen). N2 is an “unreactive” form of nitrogen that plants and
animals cannot access directly. In order for organisms to draw on this nitrogen to
support their growth, the nitrogen must be “fixed” – that is, converted from the
unreactive N2 form to a reactive form such as nitrate (NO3) or ammonia (NH3). In
an environment absent of human influence, this conversion occurs only through
fixation by plant- and soil-associated bacteria and lightning strikes.
     Human processes have doubled the global rate at which reactive nitrogen is
produced (see Figure 1). This change has led to an increase in the sources of
reactive nitrogen that contribute to environmental pollution. These human-derived
sources of reactive nitrogen include airborne emissions from fossil fuel combustion
by vehicles and electric utilities, fertilizer production that results in runoff from
farms as well as suburban and urban lands, and imported food that produces
nitrogen-rich effluent leached from septic tanks and discharged from wastewater
treatment plants. Figure 3 shows the sources and fate of nitrogen in both a pristine
and human-altered landscape (see Figure 3 fold-out, back cover).

                                                                                                                                                                                PAGE 5
Additional reactive nitrogen created through human activities becomes a pollution
problem when the supply of reactive nitrogen from all sources entering a watershed
exceeds the basic needs of the plants, microbes and animals in that watershed, or when
nitrogen emitted to the air cannot be assimilated without adverse effects on air quality.
The Cascade of Nitrogen Pollution
Air quality impacts:
~ Elevated ground-level ozone
~ Increased particles in the air
~ Reduced visibility
~ Increased acid rain and nitrogen deposition
o
Forest impacts:
~ Increased acidity of forest soils
~ Nitrogen saturation of forest ecosystems
~ Ozone damage to forests
o
Water quality impacts:
~ Elevated acidification of lakes and streams
~ Groundwater contamination
~ Over-enrichment of coastal ecosystems
Other impacts:
~ Increased production of greenhouse gases contributing to global climate change
~ Adverse human health effects from particulate matter and ground-level ozone k
FIGURE 4:
Total reactive
What are the sources of reactive nitrogen in the nitrogen inputs
Northeast? to several large
watersheds in
The largest sources of reactive nitrogen in Northeast watersheds are the Northeast
nitrogen in food, nitrogen deposition and nitrogen fertilizer. and mid-Atlantic.
To determine the sources
of reactive nitrogen that
cause nitrogen pollution we
analyzed eight large water- 80
sheds in the Northeast (see N in food
Northeast mid-Atlantic
Figure 2b). The results show Atmospheric N deposition
that food (most of which is Fertilizer N
60
imported from outside the
N Inputs to Watersheds
N in feed
region) accounts for the N fixation
(kg N/ha-yr)
largest amount of reactive
nitrogen in the region (38-75 40
percent). Airborne emissions
of nitrogen oxides (NOx) and
ammonia (NH3), and the
subsequent deposition2 of 20
nitrate (NO3) and ammonium
(NH4), contribute 11-36
percent. Nitrogen fertilizer
0
A
D
E
A
A
H
C
Y
CT
RI
y, M
y, M
y, M
y, M
M
y, N
N
N
ay,
d,
ay,
ay,
d,
Ba
Ba
a
tB
Ba
Ba
un
un
kB
sB
tB
sco
et
ts
So
ke
an
So
ard
ea
ac
et
ns
ea
2
Deposition is the transfer of
rit
Ca
nd
rim
Gr
us
o
ga
zz
ap
Ra
lic
ch
Isla
ra
Bu
nitrogen from the air to the
er
m
es
sa
ar
M
Pa
Ch
ng
as
N
Earth’s surface through rain,
Lo
M
snow, clouds, fog, gases, or
particles. Note: nitrogen inputs are calculated for the watershed draining each estuary.
PAGE 6applied to crops, pastures and lawns adds another 11-32 percent (see Figure 4).
Other sources of reactive nitrogen that contribute to pollution include increased
production of crops that host nitrogen-fixing bacteria, and nitrogen in animal feed.
Together, these two sources constitute 2-16 percent of the reactive nitrogen in
Northeast watersheds.
The major sources of reactive nitrogen in Northeast watersheds differ
significantly from sources in other regions. For example, in Chesapeake Bay and
Pamlico Sound, two largely agricultural watersheds in the Middle Atlantic region of
the U.S. (the mid-Atlantic), nitrogen fixation in croplands is the largest source of
reactive nitrogen (28 and 53 percent respectively), followed by fertilizer (21 and 29
percent respectively). The nitrogen sources in these mid-Atlantic watersheds reflect
their heavy agricultural land use, in contrast to the more urbanized land use pattern
in the Northeast. The wide variation in sources of reactive nitrogen suggests that
management approaches should reflect regional differences.
This analysis of eight Northeast watersheds also shows a wide range in the rate
that reactive nitrogen is added to the watersheds. The values range from a low of
14 kilograms of nitrogen per hectare per year (kg N/ha-yr), or 12.5 lbs N/acre-yr,
in the Saco River watershed that drains to Casco Bay, Maine, to a high of 68 kg N/
ha-yr (61 lbs N/acre-yr) in the Massachusetts Bay watershed. This range in reactive
nitrogen inputs results from differences in population density and land use (e.g.
forest, urban and agricultural).
On a landscape scale it is also clear from this analysis that sources of reactive
nitrogen vary significantly in forested headwaters compared to densely populated
coastal zones. For example, in the relatively remote and unpopulated forested
watersheds of the Hubbard Brook Experimental Forest of New Hampshire, nearly
100 percent of new reactive nitrogen originates from emissions by vehicles, electric
utilities, and agricultural activities. By contrast, food dominates the sources of
reactive nitrogen in the populated coastal zone.
The following sections explore each of the nitrogen sources in greater detail. k
FIGURE 5:
l Nitrogen in food (38-75 percent) Changes in nitrogen
Based on U.S. Census and Department of Agriculture statistics, nitrogen in consumption by humans
food is the largest source of reactive nitrogen in nearly all of the eight Northeast in New England and
New York.
watersheds we examined. Since the
Northeast has a high population and
relatively low food production,
imported food represents a major
input of reactive nitrogen. The water-
shed with the highest total annual
600
input of nitrogen from the net import Fats & Oils
of food is the Hudson River watershed Fruit
500
that drains to Raritan Bay. This is due Vegetables
to the large size and population of Legumes
Nitrogen (kilograms)
400
this watershed compared to the Other Dairy
others studied. The watershed with 300
Cheese
the highest annual input of nitrogen Lowfat Milk
from food per watershed area is Whole Milk
200
Grain
Massachusetts Bay (75 percent).
Eggs
This is attributed to the relatively 100
Fish
high population density and limited
Poultry
agricultural production in this water- 0
1909 1917 1925 1933 1941 1949 1957 1965 1973 1981 1981 1989 1997 Meat
shed.
Year
PAGE 7The consumption of protein, and the associated consumption of nitrogen, has
been tracked by the U.S. Department of Agriculture since 1909 (grams of nitrogen =
grams of protein/6.25). With the increase in population and per capita consumption
of nitrogen, the total amount of nitrogen consumed in New England and New York
has risen steadily since the early 1900s (see Figure 5). The average human body
needs roughly 2.0 grams of nitrogen per day to support basic metabolic functions
(Galloway and Cowling 2002). The typical American diet supplies approximately
13 grams of nitrogen per day (Boyer et al. 2002).
Food generates reactive nitrogen in the environment as a byproduct of both
food production and
food consumption.
Food production
Nitrogen in the Food Cycle
leaves a legacy of
reactive nitrogen in Meat: 7.7 grams N
the regions where Milk: 1.3 grams N
it is produced. It is
estimated that 10
times the amount Bread: 0.4 grams N
of nitrogen is used
during the food
production process
than is ultimately
consumed by humans 2. Food consumed
as protein (Galloway
and Cowling 2002).
Much of this addi-
Peas: 0.7 grams N
tional nitrogen is
applied as fertilizer
that can run off into
groundwater, rivers
3.Nitrogen wasted
and coastal waters.
Moreover, the produc-
tion of animal protein
adds substantial 1. Food imported
quantities of reactive
nitrogen to the
environment in the
form of nitrogen-rich
manure that can
decrease water quality 4. Nitrogen discharged by
in agricultural areas. treatment plants
Once food is
consumed, it can
contribute to pollution
through the produc-
Note: the nitrogen content in food groups is based on a single serving.
tion and discharge of k FIGURE 6:
Source: http://www.nal.usda.gov/fnic/cgi-bin/nut_search.pl
sewage. Humans do Nitrogen in food is a
not utilize all of the major contributor to
nitrogen contained in food. The remaining nitrogen is lost as waste to septic systems nitrogen loading in
or wastewater treatment plants. While the technology exists to remove reactive Northeast estuaries.
nitrogen from wastewater, investments in these upgrades have not been made at
most treatment plants (see Box on page 21). Since most septic systems and treatment
plants do not effectively remove nitrogen from the waste, reactive nitrogen is
eventually discharged to rivers and coastal waters where it contributes to water
quality problems (see Figure 6).
PAGE 8l Deposition of nitrogen
(11-36 percent)
The deposition of nitrogen to
the Earth’s surface resulting from
airborne emissions is the second
largest source of reactive nitrogen
in the eight Northeast watersheds Legend
thousand short tons
analyzed. The airborne emissions N/year
of reactive nitrogen are derived
from the burning of fossil fuel and
agricultural activities. The most
prevalent nitrogen emissions are * Source area based on
21-hour back trajectory.
nitrogen oxides (NOx) and
ammonia (NH3). Based on data
from the U.S. Environmental 2% 2% 1%
2%
Protection Agency (EPA), nitrogen 4%
oxides constitute 66-73 percent 8%
of the total nitrogen emitted in
39%
the airshed3 of the Northeast
16%
and ammonia contributes the
remaining 27-34 percent.
26%
Emissions can also include natural
or human-derived organic nitrogen.
Using the airshed for the Long Island Sound watershed as an example, the largest FIGURE 7: k
sources of nitrogen emissions are: transportation NOx (39 percent), electric utility NOx Distribution and
(26 percent) and ammonia emitted from animal waste (16 percent). The largest emitters sources of nitrogen
are located in the Midwest (see Figure 7), although local sources can be substantial and emissions to the
play an important role in local air quality. Northeast.
Focusing on nitrogen oxide emissions alone, 54 percent of the total national NOx
emissions originate from transportation sources (e.g. passenger cars, diesel trucks and
recreation vehicles), and 25 percent are emitted from electric utilities (e.g. coal-fired
power plants). Of the ammonia emissions, 83 percent are associated with agricultural
activities. k
FIGURE 8:
Both nitrogen oxides and ammonia can be transported long distances and
Total nitrogen
eventually are deposited on land and water surfaces as nitrate and ammonium in
deposition. From
precipitation (rain, snow, sleet, hail) or as gases and particles. This process is known as Ollinger et al. 1993.
“nitrogen deposition.”
The nitrogen deposition patterns
in the Northeast are related to three
factors: (1) distance from large emission TOTAL NITROGEN
sources, (2) latitude and (3) elevation. DEPOSITION
The western Adirondack Mountains
of New York experience the highest
deposition rates in the region at 12 kg
N/ha-yr (11 lbs N/ha-yr), reflecting (kg N/ha-yr)
their relatively close proximity to 3.32-4.02
Midwest sources (see Figure 8). 4.03-4.75
4.75-5.46
5.47-6.18
6.19-6.90
6.91-7.62
7.63-8.34
8.35-9.06
North 9.07-9.78
9.79-10.50
3
An airshed is the geographic area that 10.51-11.22
contributes airborne emissions of nitrogen to 11.23-11.94
a watershed or other locale of interest. 11.95-12.66
PAGE 9NITROGEN TRENDS IN PRECIPITATION
HUBBARD BROOK EXPERIMENTAL FOREST, NH
40
(microequivalents per liter)
N in bulk deposition
35
nitrate
20
10
ammonium
0
1960 1965 1970 1975 1980 1985 1990 1995
n FIGURE 9:
Year Trends in nitrate
and ammonium in
precipitation. From
Likens and Bormann
Long-term data from the Hubbard Brook Ecosystem Study show that the 1995.
concentration of nitrogen in precipitation has been relatively constant since
measurements began there in the early 1960s (see Figure 9). These relatively high
deposition levels persist in part because the 1990 Amendments to the Clean Air
Act (CAAAs) did not substantially limit nitrogen emissions.
l Nitrogen in fertilizer (11-32 percent)
Nitrogen fertilizer is used throughout the region to increase crop yields and
improve lawn and turf conditions. Based on fertilizer sales data, nitrogen fertilizer is
the second or third largest source of reactive nitrogen in each of the eight Northeast
watersheds analyzed. Of land in the Northeast likely to be fertilized, 60 percent is
pasture and hay, 34 percent is row crops, 5 percent is urban recreational grasses and
1 percent is “other.” The watershed with the highest annual input of nitrogen from
fertilizer per land area is the Hudson River watershed in New York. The lowest levels
are found in the Great Bay watershed in New Hampshire. The sale of nitrogen
fertilizer in the region increased approximately 30 percent between 1965 and 2001.
The use of nitrogen fertilizer on residential lawns is a growing component of fertilizer
use in the U.S.
There is a wide range in fertilizer application rates across the region. However,
more nitrogen is generally applied to the land than can be assimilated by the
vegetation. Some scientists estimate that approximately 20 percent of the nitrogen
in fertilizer leaches to surface or ground waters, with extreme levels reaching as high
as 80 percent for row crops in sandy soils (Howarth et al. 2002).
l Nitrogen in animal feed (1-10 percent)
Animal feed in the form of corn silage, oats and hay is imported to the Northeast
to feed cows, pigs, chickens and other livestock. The watershed with the largest
amount of nitrogen in animal feed per hectare is the Connecticut River watershed due
to relatively high levels of livestock production. Nitrogen in animal feed can become
a pollution source through the excretion of nitrogen-rich manure that releases
gaseous ammonia into the atmosphere and leaches nitrate into local water bodies.
Nitrogen in animal feed is of greatest concern on farms where intensive livestock
production results in more nitrogen-rich manure than the farmer can effectively use
as fertilizer, and where adequate containment or treatment facilities do not exist to
minimize leaching to adjacent surface waters.
PAGE 10Nutrient Management in Agriculture: A Case Study
I nnovative nutrient management projects have been implemented on farms throughout the region.
For example, the Matlink Dairy Farm uses an integrated manure management system for their 675-cow
farm in Chautauqua County, New York. To address a variety of issues including odor, nutrient management
and pathogen reduction, the farm recently installed an anaerobic digester with support from the New York
State Energy Research and Development Authority.
The digester breaks down manure from the cows and produces biogas that the farm uses to meet its
electricity needs and to sell to the grid. The farm boosts gas production from the manure by also digesting waste
from nearby food facilities. The benefits of the digester project are two-fold. First, the digester effluent is stored
and applied to the land in a manner that maximizes nutrient uptake by crops and reduces nitrogen runoff.
Second, the digester relieves pressure on the local wastewater treatment plant that currently lacks the capacity
to remove nitrogen from the waste stream.
Matlink Dairy Farm receives economic benefits from the digester
project through electricity savings, tipping fees for handling food wastes,
bedding material replacement, compost sales, and hot water totaling
$290,000 annually. The annual savings will offset the initial capital
expense of $620,000, making this investment both economically and
environmentally beneficial.
l Nitrogen fixation in croplands (1-8 percent)
Nitrogen fixation is the process in which bacteria living in association with
crops such as soybeans, peanuts and alfalfa (known as leguminous crops), or living
freely in the soil, convert unreactive forms of nitrogen (such as N2) into reactive
forms available for plant growth. The increased cultivation of crops with nitrogen
fixing bacteria adds to the total amount of reactive nitrogen in a watershed. In the
Northeast, nitrogen fixation is primarily associated with increased alfalfa production
for livestock feed (Boyer et al. 2002). Watershed inputs of reactive nitrogen associ-
ated with nitrogen fixation in croplands is low, with the highest percentage occurring
in the Hudson River watershed.
What are the ecological effects of nitrogen pollution
in the Northeast?
Nitrogen pollution contributes to ground-level ozone, acid rain and
acidification of soil and surface waters, disruption of forest processes,
coastal over-enrichment and other environmental issues.
This report examines four of the major environmental effects of nitrogen
pollution in the Northeast: ground-level ozone, acid rain, forest effects and coastal
over-enrichment. Nitrogen also contributes to other issues that are not considered
here, such as groundwater contamination, regional haze, airborne particles and
global climate change.
l Ground-level ozone
Ground-level ozone is formed when nitrogen oxides and volatile organic
compounds (from the vapors of paint, gasoline and solvents, and natural emissions
from plants) combine in the presence of high temperatures and sunlight to form
ozone (O3). In the Northeast, the generation of ground-level ozone is controlled
largely by nitrogen oxide emissions. High concentrations of ground-level ozone
can have adverse effects on both human health and the environment.
PAGE 11On warm summer days,
ground-level ozone concen-
trations in the Northeast often
14
exceed the U.S. Environmen-
% Reduction in Net Primary Productivity
tal Protection Agency (EPA) 12
National Ambient Air Quality
Standard for human health. 10
The current ozone standard
8
is 0.08 parts per million
averaged over an eight-hour 6
period (revised from 0.12
parts per million averaged 4
over a one-hour period).
Based on the older standard, 2
approximately 26 million
0
people live in areas of the Y Y Y A A E E
Y T T H H
Northeast where the standard , N id, N rk, N y, N , C re, M a, M ,V N , N th, M or, M
use c o ad ur y
a lse gton ster, uth e g
was exceeded up to 70 days c Pla Y t b e b n
ra ew ene
c an W
Ch nin nche tsmo za Ba
Sy ke N D en a r Eli
from 1993-1998. It is expected La Sch B M Po pe
that even more people will Ca
be exposed to conditions that
FIGURE 10: k
periodically violate the current more stringent standard.
Ground-level ozone also presents a significant health risk for trees and other Reductions in tree
vegetation in the Northeast. The two major categories of plant effects are injury to growth in the Northeast
leaves and needles, and physiological changes. Ozone comes into contact with plants due to ozone pollution.
through “stomatal conductance,” or the uptake of ozone through small pores on the From Ollinger et al.
tree (stomates). Ozone uptake by plants is greatest during the growing season of 1997.
May to October when the plants are growing most vigorously.
Visual symptoms of ozone stress include
damage to parts of the leaf or needle, known
as “foliar stipling” or “necrotic spotting,” and
premature loss of foliage. Physiological changes
can also occur to the plant without visible signs
of injury. The most pronounced physiological
effect is the reduction in the ability of the
plant to convert sunlight to energy (through
photosynthesis) that is needed to fuel plant growth.
The net effect of this change is a decrease in tree
biomass production, or growth (see Figure 10). Tip necrosis injury on white
pine.
l Acid rain
Rainfall is acidic in much of the Northeast. The average pH (a measure of
acidity) of rain and snowfall at the Hubbard Brook Experimental Forest in New
Hampshire is 4.5. This level is 10-15 times more acidic than unpolluted rainwater.
Recent surveys show that approximately 41 percent of lakes in the Adirondacks
of New York and 15 percent in New England are chronically or periodically too
acidic to support fish and other aquatic life.
Nitrogen in the form of nitric acid is one of the two major constituents of acid
rain (the other is sulfuric acid). As regulatory controls on sulfur dioxide emissions
Purple stipling on
have decreased the amount of sulfate in rain and snow, nitrate has become an
ash leaf due to
increasingly important contributor to acid rain (see Figure 11). Moreover, nitrate
ambient ozone.
is the major driver in seasonal and “episodic” acidification that result in short-term
Acadia National
increases in the acidity of surface waters. These episodes typically occur in the
Park, ME.
spring, fall and winter when trees and other vegetation are not actively growing
and are therefore using less nitrogen.
PAGE 12What are the Health Effects of Atmospheric Nitrogen Emissions?
T he ground-level ozone, particulate matter, and nitrogen dioxide resulting from anthropogenic inputs of
reactive nitrogen can lead to respiratory and cardiovascular health effects.
As mentioned previously, nitrogen oxide emissions can contribute to the formation of secondary
compounds, including ground-level ozone. Ozone reacts with molecules in the lining of the lung, contributing
to adverse respiratory outcomes (Mudway and Kelly 2000). In epidemiological studies, short-term ozone
exposure has been associated with health outcomes ranging from decreased lung function to respiratory
hospital admissions to premature death. Although it is difficult to separate the effects of ozone from weather
(since more ozone forms on hot and humid days) and other air pollutants, studies that carefully account for
these factors have documented a significant independent effect of ozone (Levy et al. 2001). Along with the
effects of short-term ozone increases, there is also some evidence that long-term exposure to ozone can
result in increased asthma development among children who exercise outdoors in high ozone areas
(McConnell et al. 2002) and in chronic decreases in lung function (Kunzli et al. 1997).
Nitrogen oxide emissions also contribute to the formation of fine particulate matter (PM2.5). Nitrogen
oxides can be oxidized to form nitric acid, which can react with ambient ammonia to form ammonium nitrate
particles. While there has been relatively little direct evidence to date regarding health effects of individual
particulate matter constituents, fine particulate matter (PM2.5) as a whole has been linked with numerous
respiratory and cardiovascular outcomes. For example, a study of approximately 500,000 individuals across
the U.S. found that long-term exposure to fine particulate matter was associated with an increased risk of
premature death, principally due to respiratory or cardiovascular disease (Pope et al. 2002). Short-term
exposure to PM2.5 has been associated with premature death as well as respiratory or cardiovascular
hospitalizations, respiratory symptoms, and other morbidity outcomes.
Finally, nitrogen dioxide (NO2) itself has been associated with adverse respiratory outcomes, in part
because it has similar oxidative properties as ozone. Extremely high levels of NO2, more typically found in
indoor environments with combustion sources, have led to symptoms such as cough or shortness of breath.
In homes with gas stoves and associated elevated levels of nitrogen dioxide over longer periods, there is an
increased risk of respiratory illness in children (Hasselblad et al. 1992).
– Jonathan Levy, Sc.D., Harvard School of Public Health
The effects of acid rain are well docu-
mented and are described in detail in the 100
Science LinksTM report Acid Rain Revisited. 90
To summarize, acid rain can cause fundamental
80
Percent of Total Anion Charge
changes in soils, forests and streams. For Sulfate
70
example, acid rain has acidified soils through
the leaching of nutrients such as calcium and 60
magnesium that are important to tree growth 50
and help buffer soils and waters against acid 40
inputs. At the Hubbard Brook Experimental Nitrate
30
Forest, it is estimated that more than 50 percent
20
of the available calcium in the soil has been
10
depleted over the past 60 years due to acid rain
(Likens et al. 1996). 0
1960 1970 1980 1990 2000 2010 2020
In acid-sensitive watersheds with small Year
quantities of available calcium and magnesium
in the soil, acid rain causes inorganic forms of m
FIGURE 11:
aluminum to leach from the soil into streams. Inorganic aluminum is highly toxic The increasing
to fish and other aquatic organisms, even at very low concentrations. Aluminum contribution of
contributes to higher levels of fish mortality during acid episodes than acidity does nitrate to acid rain.
From Likens and
Lambert 1998.
PAGE 13alone. Even brook trout, a relatively acid-tolerant species, cannot withstand inorganic
aluminum concentrations above 3.7 micro-moles per liter (100 micro-grams of alumi-
num per liter). This increase in aluminum can occur even in acid-sensitive watersheds
where the forest retains much of the nitrogen that is deposited from the atmosphere.
For example, in a Catskill, New York watershed that retains up to 80 percent of the
atmospheric deposition of nitrogen, fish populations still cannot survive due to high
levels of aluminum.
l Forest effects
Research to date has shown that acid rain can affect forest health in two ways:
(1) direct impacts on foliage, and (2) reduced stress tolerance associated with soil
changes. The direct impacts on foliage include
the loss of important “membrane-associated”
calcium from tree species like red spruce that
can reduce cold tolerance and induce freezing
of foliage at high elevations. This has lead to
the dieback of 25-50 percent of the large 8000
Wood Production (grams per square meter*)
canopy red spruce in the White Mountains of
7000
New Hampshire, the Green Mountains of
Reference
Vermont and the Adirondacks of New York. 6000
Low Nitrogen (50 kg N/ha)
The reduction in stress tolerance associated with 5000 High Nitrogen (150 kg N/ha)
acid rain is linked to a loss of the available
calcium and magnesium in the soil that tends 4000
to make several hardwood species more 3000
susceptible to insect infestation, disease or
2000
drought. Signs of stress connected to acid rain
have been documented in sugar maple stands 1000
on sensitive soils across the region.
0
In addition to acid rain effects on the Pine Hardwood
forest, high levels of nitrogen deposition may *Results for 8-year period.
change forest processes in other ways. Research
from Europe and the U.S. has identified a
FIGURE 12: k
process known as “nitrogen saturation” that can result from high levels of nitrogen
deposition. Nitrogen saturation occurs when nitrogen deposition exceeds the ability of Changes in forest growth
due to added nitrogen.
the forest to retain all of the nitrogen it receives,
From Magill et al. 2000.
and in its later stages leads to decreased tree
productivity.
One important concept related to nitrogen-
induced change in forests is the highly variable
response of forests to reactive nitrogen inputs
depending on forest type, soil characteristics,
land use history, climate and nitrogen deposition
rates. For example, young vigorously growing
forests and forests with a long history of logging
or agriculture typically have a higher capacity to
Pine stands that received nitrogen retain nitrogen. Therefore, they progress more
additions. Harvard Forest, MA.
slowly toward nitrogen saturation than more
mature forest ecosystems.
Overall, changes in forest growth due to nitrogen deposition are wide-ranging
and difficult to predict. While some forests may experience increased growth in
response to low levels of nitrogen deposition, other forests respond little or not at all.
Research from the Harvard Forest in Petersham, Massachusetts shows that long-term
exposure to very high levels of nitrogen deposition can inhibit growth in pine (Magill
et al. 2000); see Figure 12.
PAGE 1460 60000
Catskills
Adirondacks
a b
50 50000
Forest Area (km2)
Massachusetts
Vermont
Nitrate (µmol/L)
New Hampshire
40 40000
Maine
30 30000
20 20000
10 10000
0 0
0 2 4 6 8 10 12 14 3 4 5 6 7 8 9 10 11 12
FIGURE 13a & b:
k
Estimated N Deposition (kg/N ha-yr) N Deposition (kg/N ha-yr)
Areas with 8 kg N/ha-yr or more tend 36% of Northeast forests a: The relationship
to show high nitrate in streamwater. receive >8 kg N/ha-yr between nitrogen
deposition and
stream nitrate in the
Northeast. From Aber
Regionally, research indicates that forests in the Northeast currently retain 80-99 et al. 2003.
percent of the nitrogen from nitrogen deposition. However, even with high retention,
forestlands show elevated levels of nitrate leaching into streams under conditions of b: Large areas of the
chronic nitrogen loading. A recent study of 350 lakes and streams in the Northeast Northeast receive
shows that spatial patterns of nitrate in streamwater are related to rates of nitrogen high levels of nitrogen
deposition.
deposition. At deposition levels above approximately 7-10 kg N/ha-yr (6-9 lbs
N/acre-yr), stream nitrate concentrations increase with increasing deposition (Aber
et al. 2003); see Figure 13a.
An analysis of forestland in the region shows that approximately 36 percent of
Northeastern forests receive 8 kg N/ha-yr (7 lbs N/acre-yr) or more, and may be
susceptible to elevated nitrate leaching, an early indicator of nitrogen saturation
(see Figure 13b). k
FIGURE 14:
l Coastal over-enrichment Sources of nitrogen
In order to understand the coastal effects of nitrogen pollution in the Northeast, loading to coastal
estuaries.
it is necessary to consider the fate of the reactive nitrogen that has been added to the
region’s watersheds. Once reactive nitrogen
enters a watershed in food, atmospheric
deposition, or fertilizer, some of it is retained
within the landscape, some of it returns 40
to the atmosphere, and approximately
Northeast Atmospheric deposition mid-Atlantic
22 percent (VanBreemen et al. 2002) flows Forest runoff
downstream to coastal estuaries. Nitrogen Agricultural runoff
30 Urban runoff
loading to the estuaries downstream of the Sewage
eight watersheds analyzed in this study is
N Loading to Estuaries
dominated by wastewater effluent (36-81
percent) and atmospheric deposition of
(kg N/ha-yr)
20
nitrogen (14-35 percent); see Figure 14.
The sources of reactive nitrogen to
estuaries in the Northeast differ considerably
10
from those in the mid-Atlantic. For example,
agricultural runoff is the major source of
reactive nitrogen to Chesapeake Bay and
Pamlico Sound (55 percent and 79 percent 0
respectively); see Figure 14.
A
A
D
A
NC
I
H
Y
CT
E
R
M
M
y, M
M
y, M
y, N
N
ay,
ay,
ay,
d,
ay,
d,
ay,
tB
Ba
Ba
Ba
un
kB
un
sB
B
tB
et
So
ts
ke
So
sco
an
ac
ard
ea
ns
et
ea
r it
r im
nd
o
ga
Ca
Gr
us
zz
ap
Ra
lic
rra
Isla
ch
Bu
er
m
es
sa
M
Na
Pa
Ch
ng
as
Lo
M
PAGE 15Reactive nitrogen loading from wastewater
treatment plants in the Northeast is linked to the LAND USE AND
high population density in the coastal zone. Densely NITROGEN IN RUNOFF
populated urban centers along the coastal zone
generate large amounts of reactive nitrogen in RO W CRO P
human waste that is then discharged through
septic systems and wastewater treatment plants.
Unfortunately, conventional septic systems are
not designed to remove reactive nitrogen. Moreover,
U R BAN
most wastewater treatment plants do not employ
Stream N (m g N /L)
tertiary biological nitrogen removal (BNR)
technologies and discharge high levels of reactive
nitrogen to surface waters.
The contribution of reactive nitrogen to coastal SU BU R BAN
waters from atmospheric deposition includes
nitrogen that is deposited directly to the estuary as
well as nitrogen deposited on the watershed that
ultimately is transported downstream to the estuary.
FO R ESTED
Agricultural and urban runoff is also an
important contributor to the loading of reactive
nitrogen in some estuaries. As compared to
undisturbed forests, agricultural, suburban and urban
lands produce nitrogen-rich runoff (see Figure 15).
This reactive nitrogen originates from many sources
including lawn and garden fertilizer, crop fertilizer,
animal manure, urban runoff and sewer overflows. FIGURE 15: k
Coastal ecosystems are naturally very rich in plant and animal life. However, Nitrogen concentrations
since the richness (or productivity) of saltwater ecosystems is naturally limited by in streams draining
the availability of reactive nitrogen, excess nitrogen can lead to a condition of different land types.
over-enrichment known as eutrophication. According to a study by the National
Oceanic and Atmospheric Administration, of 23 estuaries examined in the Northeast,
61 percent were classified as moderately to
severely degraded by nutrient over-enrichment
(Bricker et al. 1999).
The over-enrichment of estuaries promotes
80 1200
the excessive growth of algae. The increased Duration
algal growth can shade-out seagrass beds 70
Area 1000
and other submerged aquatic vegetation that 60
provide critical habitat for fish and other marine 50
800
organisms. Furthermore, when the algae die
40 600
and decompose, oxygen in the bottom water
is consumed. Low oxygen conditions, known 30
400
as hypoxia, can cause fish and shellfish 20
suffocation. Hypoxia has occurred across large 200
10
areas in Long Island Sound each year for the
past decade (see Figure 16). 0 0
1991 1992 1993 1994 1995 1996 1997 1998 1999 2000
Waquoit Bay in Massachusetts is an
example of an estuary where the effects of
elevated nitrogen have been documented FIGURE 16: k
over several decades. Suburban residences The occurrence of low
on permeable soils dominate this watershed where wastewater and atmospheric oxygen events in Long
deposition contribute large amounts of reactive nitrogen to the estuary. Long-term Island Sound. Data
research from this site has allowed scientists to quantify the relationship between source: Connecticut
the increase in total reactive nitrogen loading to the estuary and the decreased Department of
eelgrass habitat (see Figure 17). Environmental
Protection.
PAGE 16NITROGEN AND EELGRASS COVER IN WAQUOIT BAY, MA
Pristine seagrass bed
1951 1971 1978 1987 1992
40
24
20 30 Degraded seagrass bed
16
FIGURE 17:
k
20
12
8
The relationship between
10
nitrogen loading and
4
eelgrass coverage
0
0 in Waquoit Bay,
1940 1950 1960 1970 1980 1990 2000 8 12 16 20 24
Massachusetts. From
Valiela et al. 1992.
The degree of eutrophication an estuary can tolerate without adverse effects
depends on the amount of reactive nitrogen it receives and its physical characteris-
tics, such as size, depth, volume of freshwater runoff, and tidal flushing. Even with
these many physical variables, the reactive nitrogen input rate is considered the
major determinant of water quality degradation.
What are the most effective options for reducing
airborne nitrogen pollution?
Controls on vehicle and electric utility emissions of nitrogen oxides
produce the largest reductions in airborne nitrogen pollution.
The U.S. Clean Air Act is the primary federal law governing emissions of
nitrogen to the air. The Act sets National Ambient Air Quality Standards (NAAQS)
and articulates regulatory programs to meet these standards. NAAQS to protect
human health and the environment have been established for six pollutants; three
are related to nitrogen emissions: nitrogen dioxide, ozone and particulate matter.
No air quality standards exist for ammonia.
Congress most recently amended the Clean Air Act in 1990 and established
goals for reducing NOx emissions from vehicles at that time. In 1994, the U.S.
EPA implemented these goals by setting “Tier 1” standards for NOx emissions based
on vehicle type, ranging from 0.4 grams per mile (g/mi) for cars, to 1.0 g/mi for
diesel cars, and 1.1 g/mi for light trucks over 5,750 pounds. In 1999, the U.S. EPA
enacted “Tier 2” of these standards which requires U.S. manufacturers to meet
an average of 0.07 g/mi for passenger vehicles beginning in model year 2004.
In addition to these national standards, several states in the Northeast are considering
policies that would increase the number of super low emission vehicles sold.
PAGE 17Nitrogen-related Air Quality Standards
Pollutant Measurement period Standard
Nitrogen dioxide (NO2) Annual mean 0.053 parts per million
1
Ozone 8-hour average 0.08 parts per million
2
1-hour average 0.12 parts per million
Particulate matter Annual mean 50 micro-grams per cubic meter
(10 micrometers or 24-hour average 150 micro-grams per cubic meter
less in diameter)
Particulate matter Annual mean 15 micro-grams per cubic meter
(2.5 micrometers or 24-hour average 65 micro-grams per cubic meter
less in diameter)
1
Current standard
2
Previous standard
Source: U.S. EPA. http://www.epa.gov/airs/criteria.html
For electric utilities, it is estimated that the 1990 Clean Air Act Amendments
(CAAAs) will result in a 1.8 million metric ton reduction in NOx emissions from
electric utilities by 2010; this is beyond levels that would have occurred without this
legislation. However, the CAAAs did not cap total NOx emissions from electric utilities
and it is possible that emissions could actually increase in the future as energy
generation increases. Recent Congressional proposals call for additional NOx
emissions reductions from electric utilities that range from 56 percent of 1990 levels
to 75 percent of the projected 2010 levels. Most of these proposals include a cap
on nitrogen oxide emissions.
To evaluate the effect that current and potential future policies may have on
airborne nitrogen pollution in the Northeast, we used the model PnET-BGC
(Photosynthesis and EvapoTranspiration – BioGeoChemical). PnET-BGC is a
mathematical model that incorporates climate data, atmospheric emissions and
deposition together with known forest processes to predict soil and stream conditions
(see Gbondo-Tugbawa et al. 2001). The model can be used as a predictive tool to
evaluate the response of forest ecosystems to changing environmental conditions,
including emission scenarios. We applied the model to two well-studied watersheds
under current climate conditions: the Hubbard Brook Experimental Forest in New
Hampshire and the Biscuit Brook watershed in New York.
Airborne Nitrogen Emission Reduction Scenarios
Sector Scenario Reduction in total
nitrogen emissions
Transportation Reduction in NOx emissions consistent with EPA Tier 2 regulations. 24%
90% reduction in passenger car emissions beyond EPA Tier 2 standards
achieved by converting the passenger car fleet to superlow emission vehicles. 29%
Electric utilities 75% reduction in NOx emissions beyond current levels. 10%
Agriculture 34% reduction in ammonia emissions through animal waste treatment. 2%
Integrated 90% reduction in passenger car emissions beyond EPA Tier 2 standards, 75%
reduction in NOx emissions beyond current levels and 34% reduction in
ammonia emissions. 39%
* Each of these scenarios was also run with an additional 75% reduction in sulfur emissions from electric utilities beyond the emission levels
required in the 1990 Clean Air Act.
PAGE 18Chemical Indicators of Potential Ecosystem Degradation
Indicator Threshold
Nitrogen deposition Greater than 8.0 kilograms of nitrogen per hectare
per year (kg N/ha-yr).
Soil base saturation1 Less than 20%.
Stream acid neutralizing capacity (ANC)2 Less than 50 micro-equivalents per liter (µeq/L).
Stream acidity (pH) Less than 6.0.
Stream aluminum (inorganic) Greater than 2.0 micro-moles per liter (µmol/L).
Several emission reduction scenarios that were measurable and regional in scope 1
Soil base saturation
were used to evaluate the environmental effects of reductions in vehicle emissions, reflects the amount of
available nutrient cations
utility emissions and emissions from agricultural activities. (such as calcium and
Next, several indicators of chemical stress associated with nitrogen pollution were magnesium) that buffer the
defined. These indicators are based on the best available estimates of the conditions soil against acidity.
2
ANC is the capacity of a
that tend to cause adverse change related to nitrogen deposition and acid rain (see liter of water to neutralize
Driscoll et al. 2001 and Aber et al. 2003). We then used the PnET-BGC model to inputs of strong acid. At
predict how these indicators are likely to change over time with each policy scenario values less than 50 µeq/L,
a stream is subject to acid
(see Figures 18a and 18b). episodes. Chronic acidity
The PnET-BGC model results provide insight into the relationship between occurs when ANC is less
emissions reductions and ecosystem recovery. According to this analysis: than 0 µeq/L.
1. The emissions reductions called for in the 1990 Clean Air Act Amendments k
will not reduce nitrogen deposition below the target of 8 kg N/ha-yr at the FIGURES 18a & 18b:
Hubbard Brook Experimental Forest or the Biscuit Brook watershed. Model results showing
the connection between
2. Additional reductions in total nitrogen emissions within the airshed of the
nitrogen and sulfur
Northeast (~30 percent) would be needed to achieve the 8 kg N/ha-yr target
emission reductions
in the Biscuit Brook watershed; it currently receives 11.2 kg N/ha-yr. and ecosystem conditions.
Watersheds with higher deposition may require greater emission reductions From Whitall et al.
to reach the 8 kg N/ha-yr target. Watersheds such as the Hubbard Brook In review.
a b
50 10
Stream ANC (µeq/L)
Stream ANC (µeq/L)
40 5
30 0
20 -5
10 -10
0 -15
6.5 5.8
5.6
Stream pH
Stream pH
5.4
6.0 5.2
5.0
4.8
CAAA
5.5 CAAA + utility 4.6
2.0 CAAA + Tier 2 14
Stream Al (µmol/L)
Stream Al (µmol/L)
mobile 12
1.5 CAAA + aggressive 10
mobile
1.0. 8
CAAA + integrated
6
0.5
4
0 2
13
% Soil base saturation
25
% Soil base saturation
12
20
11
10
15
9
10 8
Year Year
Without sulfur reduction
With sulfur reduction
PAGE 19Experimental Forest that receive lower amounts of nitrogen from atmospheric
deposition would reach the 8 kg N/ha-yr target with lower emission reductions.
3. The 1990 CAAAs will not reduce emissions and deposition of acid compounds
(such as nitric acid) enough to completely mitigate adverse chemical conditions
associated with acid rain at the Biscuit Brook or Hubbard Brook watersheds.
4. Under the most aggressive scenario that cuts total nitrogen emissions in the
airshed by 50 percent from current levels, the targets for chemical recovery
from acid rain are not reached at Hubbard Brook within 50 years. However,
substantial improvements do occur, demonstrating that the emission reductions
would have beneficial effects. At Biscuit Brook, the aggressive nitrogen
scenario would achieve some of the targets by 2050, including stream pH
(acidity). The slow recovery from acid rain in both watersheds is related to
the fact that sulfur dioxide is also a large component of acid rain.
5. When cuts in sulfur dioxide emissions from electric utilities of 75 percent
beyond the 1990 CAAAs are considered with nitrogen reductions, it is predicted
that the Biscuit Brook watershed would reach nearly full chemical recovery by
2050. The rate of improvement at Hubbard Brook would increase markedly
under this option.
6. The PnET-BGC model results suggest that sensitive forest ecosystems would
require substantial reductions in nitrogen and sulfur emissions beyond the 1990
CAAAs in order to mitigate ecosystem stress due to acidic and reactive nitrogen
inputs within 50 years.
Reductions in NOx emissions are particularly important in reducing stream nitrate
concentrations during spring, fall and winter when stream nitrate concentrations and
acidity are highest. Another analysis using PnET-BGC shows that proposed
reductions in NOx emissions that are limited to the summer ozone season would not
decrease stream nitrate concentrations much over the short-term. Year-round controls
would be more effective in reducing the total nitrogen load and elevated nitrate
concentrations during the non-growing season over the long-term (Gbondo-Tugbawa
and Driscoll 2002).
What are the most effective strategies for reducing
nitrogen pollution to estuaries?
Nitrogen removal from wastewater at a basin-wide scale is the single most
effective means of reducing nitrogen loading to estuaries in the Northeast.
The U.S. Clean Water Act and Safe Drinking Water Act set water quality standards
for nitrogen in surface waters and groundwater. These standards provide the basis for
regulatory programs implemented by the U.S. EPA. Water quality standards for nitrogen
pollution include standards to protect human health, drinking water and aquatic life.
States are allowed to establish more stringent water quality standards, but must enforce
the federal standards at a minimum.
The federal standards establish a concentration limit for specific forms of nitrogen
in surface waters. However, there is currently no water quality standard that limits
the total loading of reactive nitrogen to surface waters. If excess nitrogen causes
violations of other water quality standards (such as dissolved oxygen), state agencies
are required to develop a U.S. EPA-approved plan to address the reactive nitrogen
loading. The plan, known as a Total Maximum Daily Load (TMDL) plan, must specify
the pollutant loading levels from all contributing sources that can be allowed and
still attain water quality standards. In 2001, the states of Connecticut and New York
adopted a TMDL plan to address chronic dissolved oxygen problems in Long Island
Sound by reducing reactive nitrogen loading to the estuary 38 percent by 2014.
Most of the nitrogen reductions will come from Connecticut and New York, where
a 58.5 percent reduction target has been established.
PAGE 20You can also read