8 Reproducible evaluation of spinal cord dti using an optimized inner volume sequence in combination with probabilistic roi analysis
←
→
Page content transcription
If your browser does not render page correctly, please read the page content below
z med phys. 2009;19(1): 11-20.

—8—
Reproducible evaluation of spinal
cord dti using an optimized inner
volume sequence in combination
with probabilistic roi analysis

F. Laun, B. Stieltjes, M. Schlüter, R. Rupp, L.R. Schad
Introduction

The purpose of this work was to reliably acquire and evaluate                Diffusion tensor imaging (dti) is a versatile imaging technique
diffusion tensor data of the cervical spine. We describe an                  which can reveal structural integrity and directional information
                                                                             of neuronal tissue. It is used in clinical routine for stroke diagnosis 1
optimized, time-efficient inner-volume echo planar imaging
                                                                             and its potential clinical value is under evaluation for
sequence. Multislice capability is achieved by restoring the                 neurodegenerative diseases 2, 3 and for the evaluation of brain tumor
magnetization in neighbouring slices early during the twice                  infiltration 4. Methods for performing brain dti are relatively well
refocused diffusion preparation. The acquired diffusion images               established, but dti of the spinal cord is still challenging due to
showed compelling image quality. Using a probabilistic roi-analysis,         the required high resolution, the susceptibility differences of
                                                                             the involved tissues, and the pulsation of the surrounding csf.
evaluation of fa and adc values was stable and the standard                  The development of a robust, reproducible assessment of spinal                            139
deviation of five measurements was below 4.5% for each value.                cord fiber integrity is of great clinical interest in neurodegenerative
Absolute fa values of a healthy subject were 0.66 ± 0.02 at c2 and           diseases like Multiple Sclerosis or spinal cord injury.
in the range of 0.57 ± 0.03 to 0.61 ± 0.03 at the other vertebraes.             Several methods for improved dti acquisition have been proposed
                                                                             recently. Multishot techniques allow high resolutions but are
Absolute adc-values ranged from 1.14 ± 0.04 µm2/ms at c1 to
                                                                             sensitive to motion-induced phase instabilities. These phase
1.37 ± 0.05 µm2/ms at c5. The fa values of a patient with acute              instabilities can be corrected considerably in post-processing
ischemic spinal trauma were significantly lower. Here, absolute              schemes using navigator echoes 5, 6. Line scan imaging is a multishot
values ranged from 0.36 to 0.42, showing that dti may serve as               technique which overcomes the aforementioned phase problem
                                                                             at cost of time efficiency 7, 8. Nonetheless, single shot techniques
surrogate marker for tissue integrity.
                                                                             are preferable since they ‘freeze’ motion and are inherently
                                                                             insensitive to motion-induced phase instabilities. Single shot
                                                                             Echo-Planar Imaging (epi) is commonly used since it is fast, signal
                                                                             to noise efficient and unlike turbo spin echo sequences, not
                                                                             limited by sar thresholds. The drawback of epi is its sensitivity to
                                                                             field inhomogeneity, especially when long readout trains are used.
                                                                             Readout trains can be shorten by using parallel imaging 9, 10,
                                                                             partial Fourier acquisition and inner volume (iv) techniques 11.
                                                                             While parallel imaging and partial Fourier acquisition are commonly
                                                                             available on clinical scanners, iv-techniques are usually in house
                                                                             developments. Wheeler-Kingshott et al. 12, 13 introduced the zoom –
                                                                             epi technique which is favourable for axial image acquisition
                                                                             although it is not possible to acquire contiguous slices for sagittal
                                                                             images. To overcome this problem, Jeong et al.14 proposed an
                                                                             iv-technique that has multislice capability since it restores
                                                                             magnetization after the readout train. In a later work, Jeong
                                                                             et al.15 proposed a more efficient strategy to restore the

                                                                       reproducible evaluation of spinal cord dti using an optimized inner volume sequence in combination
                                                                                                                                            with probabilistic roi analysis
magnetization, however they employed stimulated echoes
image for image acquisition. Here, we propose an efficient
alternative strategy for multislice iv-imaging by incorporating
the magnetization restoration in the diffusion preparation.
Apart from optimal acquisition schemes, the reproducible
evaluation of dti-derived measures is critical if one aims at using
dti for clinical evaluation. The acquired diffusion data is typically
post processed using hand drawn specified regions of interest (rois).
Especially in small structures like the spinal cord, slight shifts in
roi will lead to large, user induced variations and will hamper
clinical application where differences between healthy and affected
140 tissue may be minimimal. We have recently presented a method 141
for fast, reproducible roi-analysis of dti-derived parameters in
the human brain 16. Here, we evaluate this probabilistic tissue
classification algorithm on dti data of the cervical spine.
Materials and methods
mri Sequence Description
Figure 1 a) Timing table of the proposed sequence. The first 180° pulse is applied in phase-
Figure 1 a shows the timing table of the sequence. Diffusion weighting encoded direction to limit fov. The second 180° pulse is applied globally to restore
longitudinal magnetization and to enable multislice acquisition. b) Principle of the
is achieved by a twice-refocused spin echo diffusion preparation 17. multislice enabled inner volume dti sequence. The fov lies in region II which is the only
The 90° rf-excitation pulse is applied in slice-selection direction region experiencing a spin echo at time te. Magnetization in region III is restored to allow
multslice acquisition. The transversal magnetization of spins in region I decays on a t2*
and the first 180° refocusing pulse is applied in phase-encoded timescale and is spoiled by the gradient blips of the slice selection gradient.
direction to limit field of view (fov). The second 180° pulse is
applied globally instead of in phase-encoded direction to reduce
ghosting artefacts. The two 180° refocusing pulses are separated of the next imaging slice shifts towards region iii. Spins in
by a time τ. The signal is acquired with a standard epi readout region iii experience two 180° refocusing pulses so that the
train and is phase corrected by three gradient echoes which are inverted magnetization is restored. Nonetheless, a part of
acquired after the 90° excitation pulse. the magnetization is lost since the inverted longitudinal
Figure 1 b shows the rf pulses in the imaged slice and the magnetization mz decays on a t1 time scale as described by
surrounding volume during the imaging process. There are three the Bloch equation 18
separate regions. Region i lies in the same plane as the fov and
experiences only the 90° excitation pulse. The signal decays on a ,
t2* time scale, is spoiled by the blips of the refocusing pulses, and
is negligible during the epi readout. In region ii, all three rf pulses where M0 is the equilibrium magnetization. Therefore, it is
are applied and here a spin echo is generated at time te. The fov advantageous to minimize τ with a lower limit of te/2.
on connectivity in the central nervous system — a magnetic resonance imaging study reproducible evaluation of spinal cord dti using an optimized inner volume sequence in combination
with probabilistic roi analysisPhantom and Subject Preparation and Measurement Image Post Processing
To prove that the magnetization restoration during the diffusion Post processing was conducted with NeuroQlab, (MeVis Research
preparation is more efficient than magnetization restoration after GmbH, Bremen, Germany). The acquired images were registrated,
the epi readout train, a water phantom doped with NiSO4 and magnitude averaged and interpolated to a resolution of 1 x 1 x 2
NaCl (1.25 g NiSO4.6H2O+5 g NaCl per 1 kg water) was measured. mm3 using a cubic b-spline function. The tensor was estimated
Phantom images were acquired using three inner volume (iv) using a log-linear model. rois were placed at consecutive
sequences: midsagittal positions of the spinal cord (c1 to c7) between the
1 A conventional iv-sequence without magnetization restoration intervertebral discs. The voxels of each roi were automatically
2 An iv-sequence with magnetization restoration by a second classified into fiber, non fiber, and mixed class voxels using a
180° rf pulse after the epi readout recently described probabilistic classification method 16. Apparent
142 3 An iv-sequence with magnetization restoration during the diffusion coefficient (adc) and fractional anisotropy (fa) values 143
diffusion preparation were calculated only for the fiber class voxels. The mean and
standard deviations were calculated from the 5 measurements.
Imaging parameters were: fov = 128 x 128 mm2, base resolution = Fiber tracking was applied to the diffusion principal eigenvector
64, te = 75 ms, slice thickness = 5 mm, 11 slices, 1 average. field using a deflection based algorithm 19, 20. Termination criteria
The effective repetition time treff = tr/number of slices was was fa < 0.3. The tracking was initialized form two seed rois at
adapted by varying tr between 1.6 and 16.0 s. The signal intensity the c1 and c5 level.
of the phantom was determined in all measurements. For the classification algorithm, it was assumed that the
The spinal cord of one healthy subject was measured five times signal is composed by signal from a fiber class (f), an isotropic
with iv-sequence 3. The measurements were performed on a 3 t background class (b) and a mixture class (m). The partial volumes
mri system using an 12 channel head coil in combination with a of these classes are denoted by πf, πb and πm, such that
4 channel neck array (Magnetom trio, Siemens Medical Solutions, πf + πb + πm = 1. The anisotropy index a = 1 - (λ2 + λ3) / (2λ1) was
Erlangen, Germany, gradient strength = 40, 45 mt/m in xy, z direction, used as measure for the anisotropy. Under certain conditions 4, 16,
slew rate = 180, 220 t/m/s). Parameters were: fov = 200 x 60 mm2, the anisotropy of the mixture class can be described by
resolution = 96 x 29, tr = 6 s, te = 63 ms, slice thickness = 2.1 mm, am = (1 - ρ)af + ρab, where af and ab are the anisotropy indices of
10 slices, 10 averages, b = 0, 650 s/mm2, 6 directions gradient fibre and background class and ρ is the mixture parameter. Let
scheme, bandwidth = 1736 Hz/Px, partial fourier factor = 5/8, fat P(a | f), P(a | b) and P(a | m) be the conditional probabilities that
saturation. The total acquisition time was 7 minutes. a is measured in fiber, background and mixture class. Then, the
Also, diffusion weighted images of the spinal cord of one patient probability to measure a is P(a) = πf P(a | f) + πb P(a | b) + πm P(a | m).
with acute ischemic spinal trauma were acquired. Parameters Here, P(a | f) and P(a | b) are modelled by Gaussian distributions
were identical to the subject measurement. Subject and patient with mean values mf and mb and variances σf and σb. Assuming
measurements received the approval of our institutional review that ρ is uniformly distributed, P(a | m) can be modelled 21 by
board. Written informed consent was obtained.
on connectivity in the central nervous system — a magnetic resonance imaging study reproducible evaluation of spinal cord dti using an optimized inner volume sequence in combination
with probabilistic roi analysis144 Figure 2 Relative signal intensity in the phantom versus treff. Using the same treff, 145
magnetization restoration during diffusion preparation (squares) yields higher
signal intensity than both the classical inner volume technique (triangles) and then
magnetization restoration after the epi readout train (circles). The magnetization is
restored more efficiently because the time of inversed magnetization is reduced.
The a-values of all voxels within the given roi were plotted in
a histogram. Then, the free parameters were detemined using Figure 3 fa map, fa colormap, adc map and fibertracking result.
a probabilistic clustering algorithm 22. With Bayes rule, one finds
P(f | a) = πf P(f | a) / P(a). The expectation values for a value Q
(e.g. Q = fa) of a roi with N voxels is calculated by: the time of inversed magnetization is reduced and therefore,
the longitudinal signal is restored more efficiently.
Probabilistic roi-Analysis of dti-Derived Parameters of
the Spinal Cord
Results
Figure 3 shows a fa map, a fa-colormap, an adc map and diffusion
Phantom measurements weighted images of a mid-sagittal slice of the healthy spinal cord
obtained in the subject measurements. Visually, the fa is constant
Figure 2 shows the relative signal intensity versus treff=tr/number over the range of the cervical spinal cord. On the colormap, the
of slices for the phantom measurements. orientation of the principal eigenvector is color encoded, e.g. blue
Using the same treff, the proposed magnetization restoration signifies a cranio-caudal orientation, the main fiber direction is
during the diffusion preparation (squares) yields higher signal represented correctly. On the adc map, the csf which surrounds
intensity than both the conventional iv-technique (triangles) and the spinal cord is markedly more intense then the spinal cord.
the iv-sequence with magnetization restoration after the epi At height of the vertebral discs, slight image distortions are
readout train (circles). Thus, using the proposed sequence, visible, but altogether, the image quality is compelling.
on connectivity in the central nervous system — a magnetic resonance imaging study reproducible evaluation of spinal cord dti using an optimized inner volume sequence in combination
with probabilistic roi analysisC1 C2 C3 C4 C4
FA 0,384 0,335 0,367 0,424 0,370
ADC 1,219 1,385 1,222 1,233 1,1230
(µm2 /ms)
Table 1 fa and adc values of the patient measurements. Compared to the healthy subject,
the fa is significantly decreased, while the ADC is slightly increased.
Figure 4 A large roi is exemplarily hand drawn on a mid-sagittal slice of the spinal cord
including the spinal cord and csf. Its voxels are automatically classified into fiber (yellow),
non fiber (green) and mixed class (partial volume) voxels (blue).
146 147
In figure 4, a large roi is shown exemplarily on a mid-sagittal
slice of the spinal cord. Its voxels are automatically classified into
fiber (yellow), non fiber (green) and mixed class (partial volume)
voxels (blue). Since the roi does not have to be drawn precisely,
the evaluation process is fast and independent of the actual
windowing and shape of the roi.
Figures 5 a and 5 b show the determined fa and adc values at
different mid-sagittal positions of the spinal cord. The evaluation
was stable, the standard deviation of all values was below 4.5% in
the five repeated measurements. The mean fa is constant from c1
(fa = 0.61 ± 0.03) to c7 (fa = 0.57 ± 0.02). Only at c2, the mean fa is
slightly increased (fa = 0.66 ± 0.02). The adc shows a variation of
0.2 µm2/ms between smallest and largest value. It is smallest at c1
(adc = 1.14 ± 0.04 µm2/ms) and largest at c5 (adc = 1.37 ± 0.05 µm2/ms)
and decreases at lower levels of the spinal cord
(adc = 1.19 ± 0.04 µm2/ms). The small standard deviation (below
4.5%) shows that the combination of acquisition and classification Figure 5 Measured fa (a) and adc (b) at different mid-saggital positions of the healthy spinal
is stable and reproducible allong the complete cervical spinal cord. cord (c1 to c7) as evaluated with the probabilistic classification approach. The mean and
the standard deviation are calculated from 5 measurements. The measurement is stable,
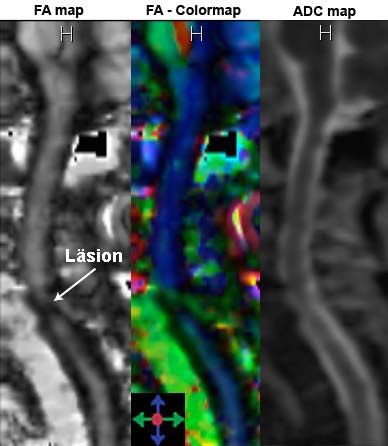
Figure 6 shows a fa map, a fa colormap and an adc map of a the standard deviation at all levels of the cervical spine was below 4.5%.
mid-sagittal slice of a patient with acute ischemic spinal injury.
At the level of the lesion, the diffusion anisotropy vanishes.
The image quality is comparable to the subject measurements Discussion
and the classification is independent on roi variation as shown
before in the healthy subject measurements. Determined absolute The aim of this work was to develop a robust method to obtain
values are listed in table 1. The measured fa is markedly decreased dti-derived parameters of the spinal cord. This is indispensable
(fa » 0.4 when compared to the healthy subject (fa » 0.6). for detection of relatively small changes of spinal cord integrity
on connectivity in the central nervous system — a magnetic resonance imaging study reproducible evaluation of spinal cord dti using an optimized inner volume sequence in combination
with probabilistic roi analysisdistortions. The proposed mr imaging sequence constantly
yielded compelling image quality and enabled tissue classification
of the cervical spine. The slight image distortions at the level of
the vertebral discs had only minor influence on the total image
quality. adc and fa evaluation was stable at the full length of
the cervical spine, the evaluated fa and adc values of the same
subject varied by less than 4.5%.
As shown in previous publications 16, the tissue classification
proved to be robust for a wide range of tensor shapes and initial
roi sizes, where it was successfully applied to detect small
pathological changes in fa of the corpus callosum (about 15%).
148 In the patient measurements presented here, the employed 149
methods allowed a reliable determination of the fa. The fractional
anisotropy was clearly diminished when compared to the subject
measurements. Hence, the determination of the fa may be a well
suited surrogate marker for tissue integrity of the spine in future
studies.
The measured adc value at the c5 level was increased by about
0.2 µm2/ms compared to the adc at the c1 level. Kharbanda et
al. presented data 23 indicating that csf pulsation has a stronger
influence on diffusion measurements at the lower cervical spinal
cord. This can lead to an increased partial volume effect and to
an additional spin dephasing in voxels with non-uniform spin
Figure 6 fa map, fa colormap and adc map of a mid-sagittal slice of a patient with with acute velocity. The spin dephasing reduces the measured signal and
ischemic spinal injury. The image quality is as good as in the subject measurement. increases the measured diffusion strength, which could explain
The fa around the lesion is markedly decreased to about 0.4.
the observed slight increase of adc found in our experiments.
Despite the good reproducibility, the determination of the true
absolute fa and adc values is still a challenge. Partial volume
that may occur in disease and under therapy. The method to effects between the spinal cord and the surrounding csf may not
obtain robust parameters consists of two steps: an mr sequence only occur in plane but also in slice-selection direction. Complete
which yields constant image quality needs to be developed and csf suppression 24 by inversion recovery could be an option for
a post processing scheme which minimizes user-independent measurements with a reduced partial volume effect. However,
diffusion values should be applied. inversion recovery was not implemented since this combination
Compared to conventional inner volume (iv) techniques suffers from a reduced snr efficiency. Moreover, partial volume
and previously published IV-techniques with magnetization effects also occur between grey and white matter tissue since
restoration 14, the approach proposed here is more signal-efficient the imaging resolution is currently at the brink of distinguishing
and allows the usage of a twice-refocused spin echo diffusion properly between grey and white matter.
preparation which diminishes eddy current induced image Measured fa values are well within the range reported in
on connectivity in the central nervous system — a magnetic resonance imaging study reproducible evaluation of spinal cord dti using an optimized inner volume sequence in combination
with probabilistic roi analysisprevious publications. However, there is a wide spread of reported more drastically and independently of the employed coil design.
values. E.g. Mamata et al.25 reported fa values of 0.66 ± 0.03 to In conclusion we present an optimized combination of imaging
0.70 ± 0.05, Clarke et al.26 reported fa = 0.64, Wheeler-Kingshott and evaluation method for spinal cord dti. It proves to be robust
reported fa = 0.55 at c1 and fa values ranging from 0.65 ± 0.03 at over several measurements and the dti-derived parameters are
c2 to 0.58 ± 0.03 at c6. Ries 27 et al. measured fa values ranging evaluated in a user independent fashion. This enables the use
from 0.65 to 1.02, with an average fa = 0.83 ± 0.11. Here, the measured of dti for evaluation of spinal cord imaging. It was shown that
fa may be larger than one if megative eigenvalues are measured the measured fa of the spine in a patient with acute ischemic
due to noisy images. Bammer et al.28 reported fa values of the spinal cord injury is markedly decreased. Hence, the fa may be
wm matter of 0.60 ± 0.03 and of the gm of 0.18 ± 0.03, while Wilm a surrogate marker for spinal cord function and tissue integrity.
et al.29 reported fa = 0.67 ± 0.10 for the wm and 0.56 ± 0.14 for This will be evaluated further in ongoing studies.
the grey matter, Rossi et al. 30 reported fa = 0.74 ± 0.04. This wide
150 spread of reported values may reflect the effect of conventional 151
roi analysis with its inherent user dependence, and may also be
influenced by the a wide range of employed sequence types, like
epi 28, 29, 30, zoom-epi 13, line scan diffusion imaging 25 and fast spin
echo sequences 28. Also, the employed image resolution, signal to
noise ratios, field strengths and acquisition times varied, which
causes different severity of partial volume, noise bias and patient
motion artefacts. Thus, care has to be taken when comparing
different studies which used varying sequences and post
processing schemes.
An alternative method to decrease the echo train length is
parallel imaging 10. One advantage of parallel imaging is that treff
may be chosen even shorter than with magnetization restoring
inner volume imaging. Even when magnetization restoration
is used, the signal intensity decreases due to the time of
magnetization inversion between the 180° pulses. On the other
hand, using parallel imaging, pulsation effects of surrounding
tissue like the heart, the lungs and the aorta may degrade overall
image quality, whereas these regions cancelled out using iv.
Also, parallel imaging is not favourable when the coil sensitivity
does not change significantly in phase-encoded direction and
thus, with suboptimal coil design, snr decreases due to an
enlarged g-factor. For brain studies, head coils with 32 or more
channels start to become available for clinical scanners. But for the
cervical and the thoracal spine, acceleration factors larger than
three will not be available on most clinical scanners in the coming
years. Moreover, with iv, the echo train length can be shortend
on connectivity in the central nervous system — a magnetic resonance imaging study reproducible evaluation of spinal cord dti using an optimized inner volume sequence in combination
with probabilistic roi analysisReferences Interleaved Multislice Reduced FOV Single-Shot Diffusion-Weighted EPI
(2D ss-rFOV-DWEPI). Magn Reson Med. 2005;54:1575-1579.
1 W arach S, Chien D, Li W, Ronthal M, Edelman RR. Fast Magnetic Resonance 15 Jeong EK, Kim SE, Kholmovski EG, Parker DL. High-Resolution DTI of a localized
Diffusion-Weighted Imaging of Acute Human Stroke. Neurology. 1992;42:1717-1723. volume using 3D single-shot diffusion weighted Stimulated Echo-Planr Imaging
2 Horsfield M, Jones D. Application of Diffusion-Weighted and Diffusion Tensor MRI (3D ss-DWSTEPI). Magn Reson Med. 2006;56:1173-1181.
to White Matter Diseases: a Review. NMR in Biom. 2002;15:570-577. 16 Schlüter M, Stieltjes B, Hahn HK, Rexilius J, Konrad-Verse O, Peitgen HO. Detection
3 Lim KO, Helpern JA. Neuropsychiatric Applications of DTI - a Review. NMR in of Tumor Infiltration in Axonal Fiber Bundles Using Diffusion Tensor Imaging.
Biomedicine. 2002;15:587-593. Int J Med Robot Comput Assist Surg. 2005;1:80-86.
4 Stieltjes B, Schlüter M, Didinger B, Weber MA, Hahn HK, Parzer P, Rexilius J, 17 Reese T, Heid O, Weisskoff RM, Wedeen VJ. Reduction of Eddy-Current-Induced
Konrad-Verse O, Peitgen HO, Essig M. Diffusion Tensor Imaging in Primary Brain Distortion in Diffusion MRI Using a Twice-Refocused Spin Echo. Magn Reson Med.
Tumors: Reproducible Quantitative Analysis of Corpus Callosum Infiltration and 2003;49:177-182.
152 Contralateral Involvement Using a Probabilistic Mixture Model. Neuroimage. 18 Torrey H. Bloch Equations with Diffusion Terms. Phys Rev. 1956;104(3):563-565. 153
2006;31:531-542. 19 Lazar M, Weinstein DM, Tsuruda JS, Hasan KM, Arfanakis K, Meyerand ME, Badie
5 Atkinson D, Counsell S, Hajnal JV, Batchelor PG, Hill DLG, Larkman DJ. Nonlinear B, Rowley HA, Haughton V, Field A, Alexander AL. White Matter Tractography
Phase Correction of Navigated Multi-coil Diffusion Images. Magn Reson Med. Using Diffusion Tensor Deflection. Hum Brain Mapp. 2003;18(4):306-21.
2006;56:1135-1139. 20 Weinstein D, Kindlmann G, Lundberg EC. Tensorlines: Advection Diffusion based
6 Liu C, Bammer R, Kim D, Moseley ME. Self-Navigated Interleaved Spiral (SNAILS): Propagation through Diffusion Tensor Fields. Proceedings IEEE Visualization.
Application to High-Resolution Diffusion Tensor Imaging. Magn Reson Med. San Francisco, CA, 1999;249–253.
2004;52:1388-1396. 21 Noe A, Gee JC. Partial Volume Segmentation of Cerebral MRI Scan with Mixture
7 Gudbjartsson H, Maier SE, Mulkern RV, Mórocz IA, Patz S, Jolesz FA. Line Scan Model Clustering. Information Processing in Medical Imaging: 17th International
Diffusion Imaging. Magn Reson Med. 1996;36:509-519. Conference. LNCS 2082. Springer-Verlag, Heidelberg, p.423-430.
8 Murphy BP, Zientra GP, Huppi PS, Maier SE, Barnes PD, Jolesz FA, Volpe JJ. Line 22 Laidlaw DH, Fleischer KW, Barr AH. Partial-volume Bayesian Classification of
Scan Diffusion Tensor MRI of the Cervical Spinal Cord in Preterm Infants. J Magn Material Mixtures in MR Volume Data Using Voxel Histograms. IEEE Trans Med
Reson Imaging. 2001;13:949-953. Imag 1998;17(1),74-86.
9 Cercignani M, Horsfield MA, Agosta F, Filippi M. Sensitivity-Encoded Diffusion 23 Kharbanda HS, Alsop DC, Anderson AW, Hackney DB. Effects of Cord Motion on
Tensor MR Imaging of the Cervical Cord. Am J Neuroradiol. 2003;24:1254–1256. Diffusion Imaging of the Spinal Cord. Magn Reson Med. 2006;56:334-339.
10 Pruessmann KP, Weiger M, Scheidegger MB, Boesiger P. SENSE: Sensitivity 24 Hirsch JG, Bock M, Essig M, Schad LR. Comparison of Diffusion Anisotropy
Encoding for Fast MRI. Magn Reson Med. 1999;42:952-962. Measurements in Combination with the FLAIR-Technique. Magn Reson Imaging.
11 Feinberg DA, Hoenninger JC, Crooks LE, Kaufman L, Watts JC, Arakawa M. Inner 1999;17:705-716.
Volume MR Imaging: Technical Concepts and their Application. Radiology. 25 Mamata H, Jolesz FA, Maier SE. Apparent Diffusion Coefficient and Fractional
1985;156:743-747. Anisotropy in Spinal Cord: Age and Cervical Spondylosis-Related Changes.
12 Wheeler-Kingshott CA, Trip SA, Symms MR, Parker GJ, Barker GJ, Miller DH. J Magn Reson Imaging 2005; 22:38-43.
In Vivo Diffusion Tensor Imaging of the Human Optic Nerve: Pilot Study in Normal 26 Clark CA, Barker GJ, Tofts PS. Magnetic Resonance Diffusion Imaging of the
Controls. Magn Reson Med. 2006;56:446-451. Human Cervical Spinal Cord in vivo. Magn Reson Med 1999;41:1269-1273.
13 Wheeler-Kingshott CA, Hickman SJ, Parker GJ, Ciccarelli O, Symms MR, Miller 27 Ries M, Jones RA, Dousset V, Moonen CTW, Diffusion Tensor MRI of the Spinal
DH, Barker GJ. Investigating Cervical Spinal Cord Structure Using Axial Diffusion Cord. Magn Reson Med 2000;44:884-892.
Tensor Imaging. Neuroimage. 2002;16:93-102. 28 Bammer R, Augustin M, Prokesch RW, Stollberger R, Fazekas F. Diffusion-Weighted
14 Jeong EK, Kim SE, Guo J, Kholmovski EG, Parker DL. High-Resolution DTI with 2D Imaging of the Spinal Cord: Interleaved Echo-Planar Imaging is Superior to Fast
on connectivity in the central nervous system — a magnetic resonance imaging study reproducible evaluation of spinal cord dti using an optimized inner volume sequence in combination
with probabilistic roi analysisSpin-Echo. J Magn Reson Imaging 2002;15(4):364-73.
29 W ilm BJ, Svensson J, Henning A, Pruessmann KP, Boesinger P, Kollias SS. Reduced
Field-of-View MRI Using Outer Volume Suppression for Spinal Cord Diffusion
Imaging. Magn Reson Med 2007;57:625-630.
30 Rossi C, Boss A, Lindig TM, Martirosian P, Steidle G, Maetzler W, Claussen CD,
Klose U, Schick F. Diffusion tensor imaging of the spinal cord at 1.5 and 3.0 Tesla.
Rofo 2007;179(3):219-24.
154
on connectivity in the central nervous system — a magnetic resonance imaging studyYou can also read