MONITORING GROUND DEFORMATION USING SENTINEL-1 PSINSAR AND RTS MEASUREMENTS IN THE CONTEXT OF THE GRAND PARIS EXPRESS PROJECT - JISDM 2019
←
→
Page content transcription
If your browser does not render page correctly, please read the page content below
4th Joint International Symposium on Deformation Monitoring (JISDM), 15-17 May 2019, Athens, Greece

            Monitoring ground deformation using Sentinel-1 PSInSAR and
         RTS measurements in the context of the Grand Paris Express project
   Abdeljalil NAHLI1, Elisabeth Simonetto2, Maxime Tatin3, Stéphane Durand4, Laurent Morel5, Vincent
                                               Lamour6
   1
     GeF, CNAM-ESGT, 1 Bd Pythagore, 72000 Le Mans, France, (abdeljalil .nahli@gmail.com)
   1
     Cementys, 9 Rue Léon Blum, 91120 Palaiseau, France (abdeljalilnahli@cementys.com)
   2
     GeF, CNAM-ESGT, 1 Bd Pythagore, 72000 Le Mans, France, (elisabeth.simonetto@lecnam.net)
   3
     Cementys, 9 Rue Léon Blum, 91120 Palaiseau, France, (maximetatin@cementys.com)
   4
     GeF, CNAM-ESGT, 1 Bd Pythagore, 72000 Le Mans, France, (stephane.durand@lecnam.net)
   5
     GeF, CNAM-ESGT, 1 Bd Pythagore, 72000 Le Mans, France, (laurent.morel@lecnam.net)
   6
     Cementys, 9 Rue Léon Blum, 91120 Palaiseau, France, (vincentlamour@cementys.com)

 Key words: Grand Paris Express; Tunnel; Ground deformation; Sentinel-1; PSInSAR; RTS.

 ABSTRACT
    The Grand Paris Express project consists in the construction of new tunnel sections, stations and additional
 structures. Like all underground works, this can cause ground movement around the construction sites,
 especially neighbouring buildings and surface transport network like roads and railways. To monitor the
 movements, an automatic monitoring system composed of a network of robotic total stations (RTS), control
 points and monitoring targets attached to neighbouring structures is designed and set up. The aim of this system
 is to provide the real-time coordinates and displacements of the targets in a three-dimensional system. Although
 the system provides the most reliable, height frequency and real-time measurements, which is required in this
 field, it presents some practical difficulties especially on construction sites located in a dense urban area like
 Paris. Inter-visibility limitations and lack of stable control points are the most encountered cases. This work
 reports in the context of the Grand Paris Express project the challenges of displacements monitoring and
 describes the RTS monitoring system installed by Cementys. The ground-motion monitoring is also investigated
 using the radar interferometry (InSAR) considered as a complementary survey technique. This study is using
 PSInSAR (Permanent Scatterer InSAR). Even if X-band data are currently available in this area, this first
 experiment focuses on the use of C-band Sentinel-1 images. The results show the limits and the advantages of
 such images in this context.

                   I. INTRODUCTION
  In the context of Grand Paris Express project, we are               II. CONTEXT OF GRAND PARIS EXPRESS
involved in the hearth of tunnelling monitoring with            Grand Paris Express (GPE) is currently the largest
Cementys Company. Actual topographic monitoring              urban infrastructure project, not only in France but also
system (Emery, 2019) offers most reliable                    over the whole Europe. It offers another dimension to
measurements required for structural health assess.          the Parisian transport network through the creation of
But some limitations related to this technique, notably      four new automatic metro lines (15, 16, 17, and 18) and
low spatial density and coverage of measurements, lead       two extensions of the existing line 14. It will be also
us to an interest in the PSInSAR technique. Indeed, we       connected to the existing metro network. One aim is to
showed for instance the potentials of PSInSAR                provide more transport fluidity by creating direct links
technique for ground deformation monitoring due to           inside the Île-de-France country avoiding passing
the tunnel excavation in the city of Rennes using            through Paris centre. 200Km of the Grand Paris Express
Sentinel-1 data (Nahli et al., 2018).                        metro lines will be mostly underground tunnels.
  We will present in this paper the context of Grand         Additionally, 68 new stations will be created along the
Paris Express Project, then we will describe the installed   lines (Figure 1) (SGP, 2018).
monitoring system followed by a short description of         Construction works usually begin by the realization of
PsInSAR processing. Next, we will present the first          the stations, which involves digging a box volume from
results of both techniques followed by an analysis of the    the surface after building support foundations, and
advantages and limitations of each technique                 then the construction of the tunnels joining the stations
separately based on presented results. Finally, we will      (SGP, 2019a). Around 2000 tons of materials are
discuss the interest of combining these techniques and       extracted every day mostly by Tunnel Boring Machines
show their complementarities in the context of               (TBM). The residual comes from stations digging (SGP,
tunnelling monitoring over dense urban area.                 2019b).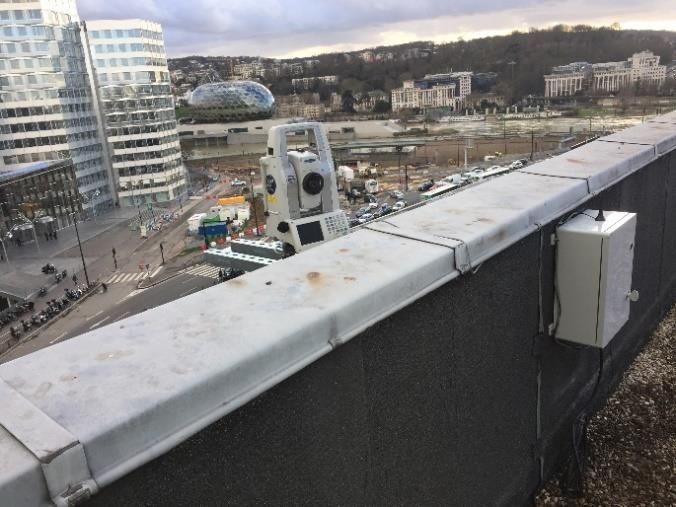
4th Joint International Symposium on Deformation Monitoring (JISDM), 15-17 May 2019, Athens, Greece
Figure 1. Grand Paris Express project: extended and new metro lines (www.societedugrandparis.fr)
Regarding the existence of cavities on historical structural movement is also essential to know and
exploitation areas and quarries, materials are prevent potential risks. For this reason, in this work,
sometimes injected first to backfill the cavities and potentially impacted structures are monitored using
reinforce the ground before the realization of stations topographic targets, levelling, inclinometers etc.
or tunnels (SGP, 2016). III. ACTUAL AUTOMATIC MONITORING SYSTEM
Injections, digging and excavation works can lead to
As part of the underground works of GPE, Cementys
ground deformations in depth but also on the surface,
is involved in the monitoring of deformations on the
of several millimetres to several centimetres (Kavvadas,
surface (works sites and neighbouring) and in the
2005; Kontogianni et al., 2005). Consequently, vital
underground (tunnels, excavations) within the area of
infrastructures within the geotechnical influence area
geotechnical influence. This monitoring is carried out by
of the works could be affected by these deformations.
topographic measurements (levelling, robotic total
Especially buildings, roads, bridges, railway networks
stations) and geotechnical auscultation measurements
and sensitive networks.
(inclinometers, extensometers, piezometers, etc.). The
Deformations over Paris were monitored using radar
company is responsible for the monitoring several lots
interferometry and explained in relation with the
of the GPE project (Figure 1), namely:
underground structure of the city and human Line 14: One lot GC03 on line 14 south.
exploitations. In (Le Mouélic et al., 2002; Fruneau et al., Line 15: Two lots (T3A and T2C) on line 15 south.
2004), the authors studied vertical deformations Line 16: Two lots (1 and 2) in the north.
around Haussman-Saint-Lazare Eole railway station The monitoring of 3D movements before, during, and
between 1993 and 1998 using C-band images from ERS after the execution of the works is a necessary
and linked it to water pumping and underground works procedure to ensure the durability of the structure in
on this site. (Koudogbo et al., 2018) carried on a study the short and long terms, to verify the impact of the
of historical deformations on Paris and presented the work on the environment and the concerned buildings
case of a settlement zone in the path of Grand Paris and alert in case of abnormal evolution or questioning
Express line 15 using C-band images from ERS and X- of security.
band images from TerraSAR-X. This site is located on The specifications prescribe the monitoring of
underground exploitation area and shows an important infrastructures in the area of geotechnical influence at
settlement. a certain frequency, varying typically between one and
These examples show the complexity of the two times per hour. This measurement frequency is
underground structure of the city, which is taken in determined according to the sensitivity and
consideration during excavations works. Monitoring vulnerability of the structure.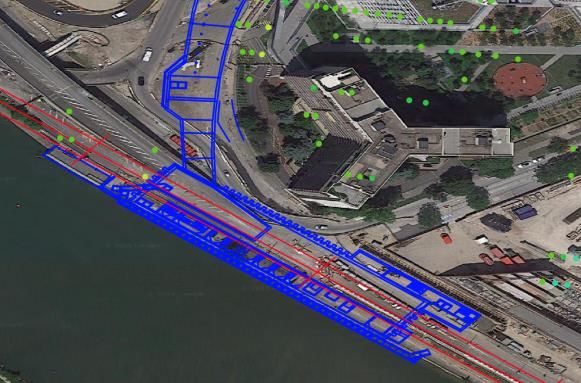
4th Joint International Symposium on Deformation Monitoring (JISDM), 15-17 May 2019, Athens, Greece
Before the start of the project, it is essential to IV. INSAR DATA AND METHODS
identify the structures located in the influenced area
We exploited PSInSAR technique (Ferretti, 2001;
and assess their sensitivity to settlements and
Hooper, 2006) with Sentinel-1 radar images1 to study
vibrations. Then, plans of auscultation are established
structural movements before and during excavation
describing the devices of auscultation which will be set
works on GPE.
upon the field. These devices incorporate various
61 Sentinel-1 images were chosen on the descending
surveying techniques: topographic, geotechnical and
orbit 8. The images are acquired in IW mode and cover
optical. Then, as soon as the sensors are installed on the
Paris city area during a time span of almost 2.5 years
surrounding structures, we carry out initial
from 01/17/2016 to 08/10/2018. Only 3 bursts on the
measurements to evaluate its state of health before the
second Swath cover the city and environs including all
beginning of the works. During the progress of stations
the sites monitored using topography.
and tunnel excavations, the sensors continuously
measure 3D displacements. The interpretation of the
measurements is important since it will allow us to warn
if the alarm thresholds are exceeded.
A topographic survey network is generally composed
of the following elements:
1. Robotic Total Station (RTS): piloted automatically by an
integrated software that instructs the total station to turn,
target a prism and take an observation of angles and
distance.
2. Reference points: considered to be fixed and whose
coordinates are known. These points are used to locate the
RTS during measurements;
3. Monitored points: they consist in prisms that are
located in the influenced area and those coordinates are to
be determined. Their calculated coordinates are compared
with the initial coordinates in order to evaluate the
Figure 3. The footprint of the Sentinel-1 image used in this
displacement of the monitored structure.
study from the descending orbit number 8.
We exploited this dataset using SNAP v6.0 with
Sentinel-1 Toolbox (S1TBX)2, which is a software from
ESA and Stanford Method for PS (StaMPS) v4.1b
(Hooper, 2006). The processing chain consists of three
steps: interferograms generation using S1TBX, data
export for StaMPS format and PSInSAR processing using
StaMPS. Full processing chain is described in details for
instance in (Nahli et. al, 2018). The two first parts are
fully automated owing to the informatic developments
proposed in (Foumelis et al., 2018). The third step
mainly consists in Matlab functions. The results contain
the detected PS location, their mean displacement
velocity over the period and the times series of the total
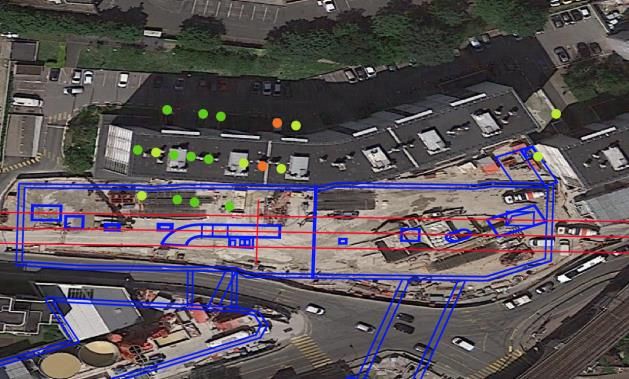
Figure 2. Robotic Total Station for monitoring buildings on displacement. The displacement are indicated in the
line 15 line-of-sight of the radar sensor.
The RTS performs a measurement cycle in which it V. FIRST RESULTS FROM TOPOGRAPHY AND PSINSAR
targets all the points to be monitored. The acquired
Among other sections, Cementys is responsible of the
data are transferred to the Cementys server via a data
monitoring of two lots of line 15 South (Figure 1)
logger. The sent file is then processed to calculate the
excavation works. This section extends over a length of
position of the station and the relative displacement
12 km from the Ile de Monsieur to Villejuif Louis Aragon
with respect to the initial coordinates. The processing
train station. Entirely underground, it integrates 3
chain ends with the visualization of the measurements
on a platform allowing the analysis and the underwater passages (Seine). We are interested her in
the lot T3A including two new stations, four ancillary
interpretation of the measurements.
works and the tunnel that connect them.
1 2
www.sentinel.esa.int/web/sentinel/technical- www.step.esa.int/main/toolboxes/sentinel-1-
guides/sentinel-1-sar toolbox/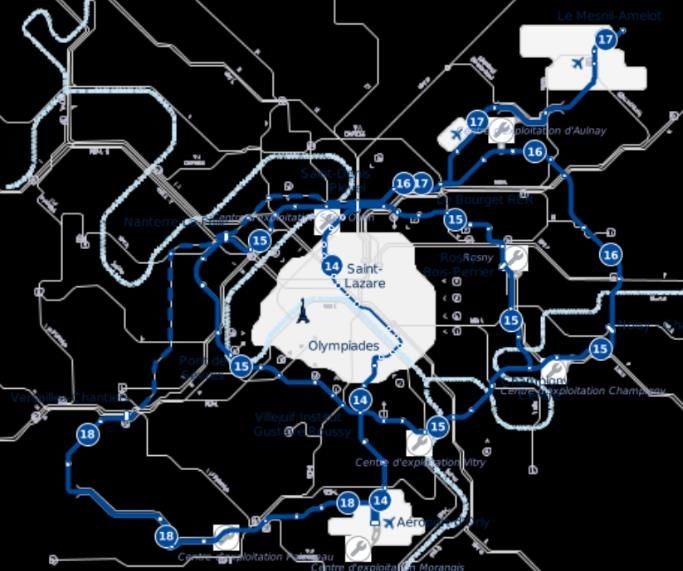
4th Joint International Symposium on Deformation Monitoring (JISDM), 15-17 May 2019, Athens, Greece

   Construction works already began on the stations
Pont De Sèvre (PDS) and Issy-RER (Issy) in 2018. The
tunnel will be inserted from Ile de Monsieur ancillary
work by august 2019. It will excavate 3937m to join Fort
d’Issy-Vanves-Clamart station passing by Pont de Sèvre,
Issy-RER stations and the ancillary structures.
   Construction sites and surrounding structures are
instrumented. Robotic total stations monitor hundreds
of targets installed on buildings, railways and roads. We
present two cases where important displacements
where measured around stations. The first one is a
building on the edge of the excavations works of Issy-             Figure 5. Vertical displacements time series of an optical
RER station and the second example is a dock alongside                     target installed on Pont de Sèvre dock.
the Seine River where Pont de Sèvre station is under
construction.                                                   B. PSInSAR monitoring results
A. Topographic monitoring results                                 Regarding the observed displacements measured by
  Issy-RER station is constructed in a high-density area        topographic method, we choose to study the same two
of buildings and infrastructures. We choose to deal with        structures.
a building near to the station where prisms are installed         For the Issy-RER station, we have detected a dozen of
on the fronts of two floors. Collected data on a time           PS on buildings in the surrounding, while no point were
span of one-year shows that this building suffers from          detected on the surface of excavations site. PS on the
important movements in vertical direction. It reaches           middle of a neighbour building have the most important
more than -7mm from the beginning of 2019 (Figure 4).           velocity, which reaches more than -6mm/year (Figure
These displacements began in April 2018 to reach -5mm           6). PS time series show that the building has undergone
in Jun 2018. A steady period is observed until                  a settlement since 2017 that has gone faster from 2018
December, then the subsidence resumes. Besides,                 after a period of stability between August of 2017 and
these displacements remain below the fixed thresholds.          April of 2018.

   Figure 4. Vertical displacements time series of an optical
          target installed on a building in Issy-RER

  Pont de Sèvre station is constructed under a dock of
the Seine River where a range of 13 prisms were
installed alongside with a spacing of 10m.
Measurements show that the dock has undergone a
rapid settlement between mid-July of 2018 and mid-
August (Figure 5). It reaches 10cm on middle of the
subway station. Referring to the works scheduled, the              Figure 6. Top: Dectected PS (colored points) around the
                                                                 Issy-RER Station, overlayed on 6/26/2018 view in Google
dock was demolished to be reconstructed again.
                                                                 EARTH. We also represent the construction project in blue
                                                                and red lines (origine de la donnée). The colors of the points
                                                                represents their velocity in mm/year. Bottom: time series of
                                                                     the total displacement of a PS on a building in mm.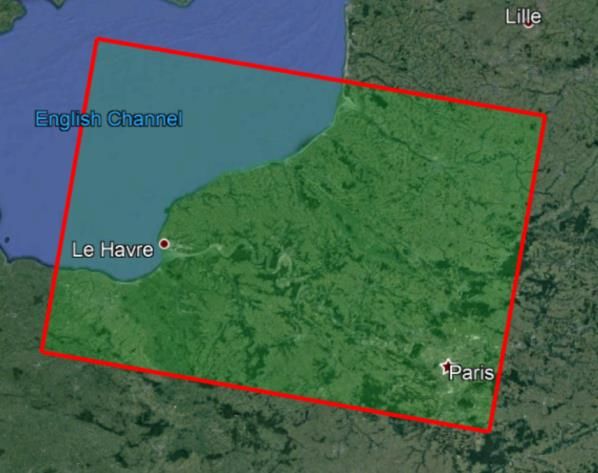
4th Joint International Symposium on Deformation Monitoring (JISDM), 15-17 May 2019, Athens, Greece

  On Pont de Sèvre station, no PS were detected on the           a regional deformation. Moreover, historical
surface of excavation site neither on the dock. This shall       measurements cannot be obtained using this
be due to the loss of coherence after changes on                 technique. Usually, the period of initial measurements
surface and the important movement of the dock. PS               is limited to only one month before works because of
located on the building are stable. Moreover, some of            the cost of additional time of monitoring.
PS located on the north roads present a small                       PSInSAR technique with a high-density measurement
subsidence, which reaches almost -3mm/year. The time             points, wide coverage and also a long time coverage can
series of the nearest PS to the station show that a              overcome most of these limitations. Knowing that
continuous subsidence at this point began on March               Sentinel-1 data are available from 2014, an historical
2018. It reaches -15mm as maximum value.                         study of structures along at least 3 years will allow to
                                                                 detect any seasonal behaviour or potential movements
                                                                 like continuous subsidence or uplift which should be
                                                                 taken in consideration before constructions works. It
                                                                 could also help to define vulnerable structures.
                                                                    Another key point is the spatial density of PsInSAR
                                                                 measurements, which reaches few thousands of points
                                                                 per km² in an urban area like Paris. Giving that almost
                                                                 PS are naturally located on building and raised
                                                                 structures like bridges, which behaves like a corner
                                                                 reflector, we can monitor these structures within the
                                                                 influenced area notably those which are not visible in
                                                                 topographic monitoring. In addition, several PS being
                                                                 detected on structure’s fronts, especially in case of high
                                                                 raising and slender structures, will allow to calculate
                                                                 some derived deformation parameters like structure’s
                                                                 global and differential settlement which are essential to
                                                                 assess the structural health.
                                                                    PSInsar technique has also some limitations in the
                                                                 context of tunnel excavations. First, measurements
                                                                 frequency is limited to 6 days (with Sentinel-1 images)
                                                                 which is not enough to survey in real time the
                                                                 construction works but the global trends of
    Figure 7. Top: Dectected PS (colored points) around the      deformations. It allows also to cover non visible
  Issy-RER Station, overlayed on 6/26/2018 view in Google
                                                                 structures in topography at least once a week. Notably
 EARTH. We also represent the construction project in blue
and red lines (origine de la donnée). The colors of the points
                                                                 that non visible structures are usually located far away
represents their velocity in mm/year. Bottom: time series of     from the construction sites and monitoring
the total displacement of a PS on Pont de Sèvre dock in mm.      prescriptions are less imposing in term of
                                                                 measurements frequency in that case.
                      VI. DISCUSSION                                A second limitation is the distribution of PS. Indeed,
  We showed through this paper the first results of              the density is high but the location of these points is
topographic and PSInSAR monitoring in the context of             critical in some cases. Especially for vulnerable
Grand Paris Express.                                             structures like railways and roads, where detected PS
  The topographic monitoring system makes it possible            using Sentinel-1 data are not enough to assess the
to continuously measure 3D displacements in real time            structure stability. Even for buildings, the number and
with a precision in the millimetre order and a high              the distribution of PS are determined by the building
frequency. However, this system is limited by the                geometry and its orientation relatively to satellite line
constraints of low spatial density of measurement                of-sight. Surface around stations construction sites
points, target visibility and the cost of installation. This     changes after earth works, causing a temporal
makes it difficult to ensure a monitoring of all                 decorrelation. For this reason, it is rare to detect PS on
surrounding structures in a dense urban site like Paris.         construction sites surface. In this case, ground
Besides, the installation of the RTS and optical targets         movements cannot be measured directly, only its effect
needs many interventions on the monitored site.                  on neighbouring structures is measured.
Concerning      the      neighbouring      buildings,    an         We can also mention a limitation related to the
authorisation is required to install optical targets.            technique. Real movement is underestimated when it is
Furthermore, measurements are relative to some                   projected to the line-of-sight of the satellite especially
reference points and it is not always easy to identify           if the horizontal component of the movement is
references outside the influenced area. In the either            significant. 3D movement retrieval using descending
case we cannot detect whether they are suffering from            and ascending orbits data can be a solution also.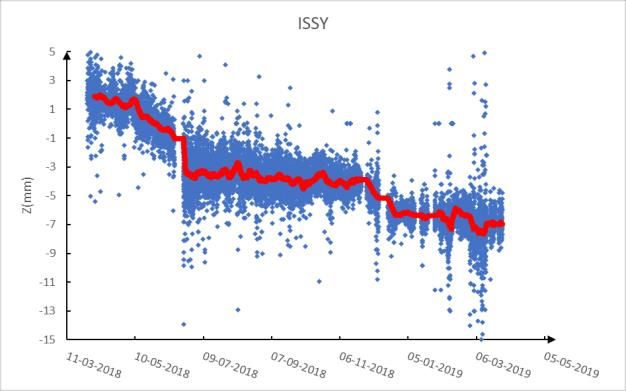
4th Joint International Symposium on Deformation Monitoring (JISDM), 15-17 May 2019, Athens, Greece

   Finally, the position of PS is in some way “random”              Foumelis, M., Blasco, J. M. D., Desnos, Y. L., Engdahl, M.,
and one PS cannot be easily associated to an optical                  Fernández, D., Veci, L., ... & Wong, C. (2018). ESA SNAP-
target. So to carry on a precise and punctual                         StaMPS Integrated Processing for Sentinel-1 Persistent
                                                                      Scatterer Interferometry. In IGARSS 2018-2018 IEEE
comparison        of    PSInSAR       and      topographic
                                                                      International Geoscience and Remote Sensing Symposium
measurements, references and monitored points of
                                                                      (pp. 1364-1367). IEEE.
both techniques must be collocated. This is achieved by
                                                                    Fruneau, B., Rudant, J. P., Deffontaines, B., & Prunier-
identifying the physical nature of PS points during the
                                                                      Leparmentier, A. M. (2004). Suivi des déplacements
historical study and materializing them with optical                  verticaux par interférométrie radar: exemple de la gare
targets during monitoring. A second interesting solution              Haussmann-Saint-Lazare (Paris). Revue française de
is “to choose” the position of the PS point by installing             géotechnique, (106-107), 103-110.
a corner reflector and equip it with an optical target.             Hooper, A. J. (2006). Persistent scatter radar interferometry
Regarding the size and the cost of a C-band corner                    for crustal deformation studies and modeling of volcanic
reflector, this can be possible only for a limited number             deformation. Ph. D. Thesis.
of PS points. Reference points for example, can be                  Kavvadas, M. J. (2005). Monitoring ground deformation in
equipped with integrated optical target and corner                    tunnelling: current practice in transportation tunnels.
reflector.                                                            Engineering Geology, 79(1-2), 93-113.
                                                                    Kontogianni, V. A., & Stiros, S. C. (2005). Induced deformation
                      VII. CONCLUSION                                 during tunnel excavation: evidence from geodetic
                                                                      monitoring. Engineering geology, 79(1-2), 115-126.
  PSInSAR technique has several promising advantages
in the monitoring field, but it presents also some                  Koudogbo, F., Urdiroz, A., Robles, J. G., Chapron, G., Lebon, G.,
                                                                      Fluteaux, V., & Priol, G. (2018). Radar interferometry as an
constraints making it difficult to rely as single technique
                                                                      innovative solution for monitoring the construction of the
for tunnelling works monitoring. Combining PSInSAR
                                                                      Grand Paris Express metro network–First results. In World
with topography may improve the monitoring system                     Tunnel Conference.
by benefiting from the advantages of both techniques.
                                                                    Le Mouélic, S., Raucoules, D., Carnec, C., King, C., & Adragna,
We forecast in next studies to implement an integral                  F. (2002). A ground uplift in the city of Paris (France)
monitoring system based on the complementarity of                     detected by satellite radar interferometry. Geophysical
PSInSAR and topography. In a first time, using Sentinel-              research letters, 29(17), 34-1.
1 images, we will improve our results by integrating                Nahli, A., Simonetto, E., Merrien-Soukatchoff, V., Durand, F.,
more images for the historical analysis; Combining                    & Rangeard, D. (2018). Sentinel-1 for monitoring tunnel
ascending and descending orbits data for 3D movement                  excavations in Rennes, France. Procedia computer science,
retrieval when it is possible (for comparable PS                      138, 393-400.
detected in both dataset); Using TRAIN toolbox for                  Société du Grand Paris [SGP] (2016). Combler les carrières
reducing atmospheric noise; Investigating a way to                    pour creuser en toute sécurité. Retrieved 30 March, 2019
improve PS detection on individual structures in                      from:
particular on railways and roads. In a second time, we                https://www.societedugrandparis.fr/gpe/actualite/combl
will move to X-band to be able to carry on more detailed              er-les-carrieres-pour-creuser-en-toute-securite-621
analysis on infrastructures and in order to retrieve more           Société du Grand Paris [SGP] (2018). Le Grand Paris Express en
precise PS location. We think in installing optical targets           résumé.     Retrieved      30    March,      2019     from:
and GNSS antenna on PS locations or some radar corner                 https://www.societedugrandparis.fr/gpe/le-grand-paris-
                                                                      express-en-resume
reflectors on a limited number of structures. We will
exploit these systems not only for techniques                       Société du Grand Paris [SGP] (2019a). La construction et la
comparison but for combining these techniques.                        mise en service. Retrieved 30 March, 2019 from:
                                                                      https://www.societedugrandparis.fr/gpe/comprendre/les-
                                                                      techniques-de-construction-177
                 VIII. ACKNOWLEDGEMENTS
                                                                    Société du Grand Paris [SGP] (2019b). Le chantier dans la ville.
   The authors are thankful for the free using of StaMPS,             Retrieved        30        March,         2019         from:
SNAP/S1TBX and automated codes from (Foumelis et                      https://www.societedugrandparis.fr/gpe/comprendre/le-
al.; 2018). Sentinel-1 data were provided by ESA and                  chantier-dans-la-ville-176
topographic data were provided by Cementys.

                         References
Chris Emery (2019). Building under Paris. Retrieved 30 March,
  2019,                                                 from:
  https://www.geoconnexion.com/publications/geo-
  international/issue/march-april-2019-international-
  issue/article/building-under-paris
Ferretti, A., Prati, C., & Rocca, F. (2001). Permanent scatterers
  in SAR interferometry. IEEE Transactions on geoscience and
  remote sensing, 39(1), 8-20.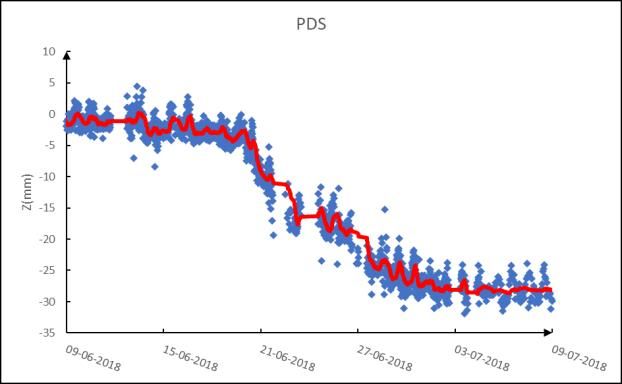
You can also read