Clustering of Cities by Craigslist Posts
←
→
Page content transcription
If your browser does not render page correctly, please read the page content below
Clustering of Cities by Craigslist
Posts
Charles Johnson and Michael Kim, Stanford University - CS 229

                                            14 December 2012

        e aimed to evaluate the similarity be-           the 11,000 most recent posts at the time of collection.

W       tween US cities by clustering them
        based on postings from the classifieds
website Craigslist. Craigslist is a data source
                                                         We initially created feature vectors and clustered
                                                         based on city codes (e.g. at the level of Palo Alto);
                                                         however, as we expanded our dataset, we found that
that could provide particular insight into               there were far too many city codes to work with and
the character of a city because the content              most of the cities were small, unrecognizable ones.
is community-driven and contains unfiltered              Instead, we chose a list of 55 major metro areas
natural language. Our clustering was per-                based on “America’s Best Cites” (Business Week
formed agnostic to geographic location so as             2012). With these 55 metro areas, we collected the
to determine a more nuanced indicator of                 1000 most recent posts for each city, which served as
similarity. Here, we report our methods for              the dataset for the work that follows.
creating feature vectors from the raw posts
and our results from subsequently clustering
the cities. We experimented with features
that considered the metadata, categorical dis-           Initial Clustering
tribution, as well as the natural language
of posts. After generating feature vectors               As a first pass, we created feature vectors from the
for each city, we applied two clustering al-             batches of 1000 posts by calculating three meta
gorithms, k-means and mean shift, and then               data: the average post length, the average title
compared their outputs. Clustering with k-               length, and the average number of images used
means produced fairly consistent, promising              per post. Instead of using these raw features, we
clusters, whereas clustering with mean shift             normalized them in order to weight the features
did not produce any meaningful clusters. Our             equally against one another. Otherwise, a feature
results from clustering could prove useful as            which is naturally larger (like post body length
an input to supervised learning problems that            compared to post title length) would artificially
involve cities, or the clustering may be inter-          create larger distances between vectors. As a first
esting as a qualitative metric in and of itself.         pass, we simply normalized all values of a each
feature vector.                                          feature dimension by dividing by its maximum
                                                         observed value, moving the values of all features
                                                         onto a [0, 1] scale.
Data Collection
                                                         We used these three-dimensional feature vec-
                                                         tors as input for the k-means clustering algorithm.
To obtain data from Craigslist, we elected to use        Prior to actually running k-means, we plotted the
the 3taps API (3taps.com), an API for querying           average within cluster distance versus the number
up-to-date and historical posts from all of Craigslist   of clusters in order to determine a reasonable value
in a JSON format. The JSON response includes             for k. Based on figure 1, we chose the smallest
source data from the posts such as post titles, post     reasonable value of k that minimizes the average
bodies, and post categories, as well as additional       within cluster distance. The curve is promising
annotations such as location codes at varying            because it does have a natural “knee” where we can
granularity.                                             choose an optimal value for k1 .
                                                          1
For our exploratory work, we collected a dataset of           Stanford NLP website: “Cluster cardinality in k-means”

                                                                                                           Page 1 of 5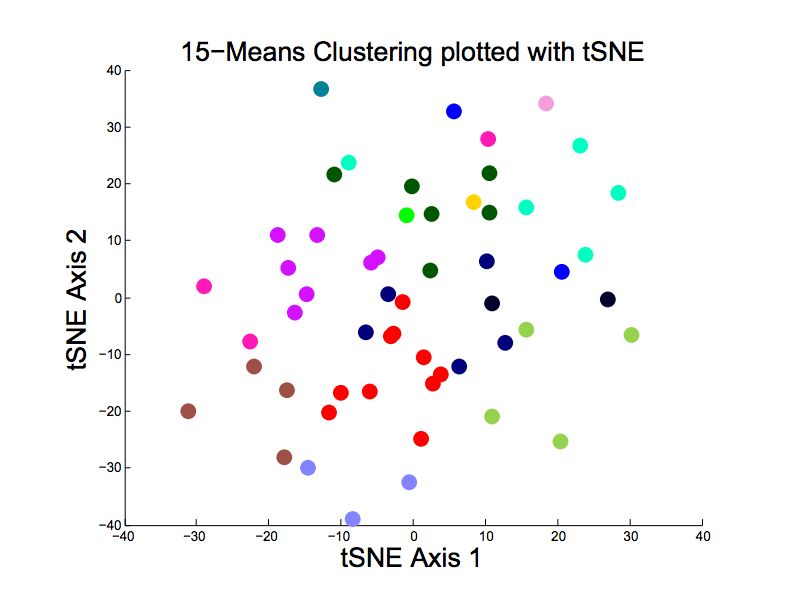
categorical information of the posts. Conceptually,
the natural language and categorical data seem to
be the likely sources of any intangible characteristics
of the cities that might be similar and thus influence
clustering.
Categorical Features
On Craigslist, posts are categorized under seven ma-
jor buckets: ‘For Sale’, ‘Vehicles’, ‘Housing’, ‘Dis-
cussion’, ‘Community’, ‘Jobs’, and ‘Services’. For
each city, we calculated the percentage of its posts
that were in each category. Furthermore, within each
Figure 1: Average Euclidean Distance from Nearest Cen- category for each city, we also calculated the percent
troids. of posts that were unpriced (i.e. free or not related
to any transaction) and the average price of those
posts that were priced. This created a total of 21
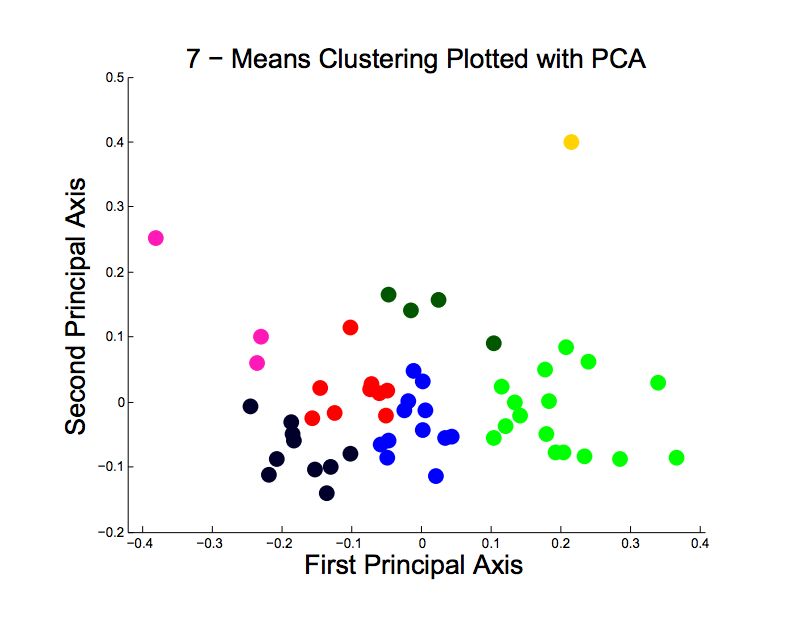
Figure 2 shows an example run of k-means clustering new feature dimensions.
on these initial feature vectors. In order to quali-
tatively analyze the clustering of the feature data,
we performed principal component analysis on the
feature vectors so that we could plot them in two di- LDA Features
mensions. Qualitatively, the initial clustering seems
reasonable but not fantastic. There are distinct clus-
In addition to the categorical features described
ters which appear to be reasonably grouped, but
above, we also computed features of the natural lan-
there certainly is not clear separation between the
guage used in the posts using an LDA topic model.
centroids.
We used the Stanford Topic Modeling Toolbox to
run LDA on the post titles and bodies from each
of the Craigslist categories, creating a set of topics
discussed within each category. We experimented
with various techniques to preprocess the post titles
and bodies before running LDA, such as keeping or
removing stop words and setting a minimum word
length. The topics that seemed most promising were
produced from posts that ignored case and punctua-
tion and had a minimum word length of 5. We also
filtered out stop words and the 20 most common
words from each category and required that a word
occur in at least 10 posts.
Upon inspection of the ‘topics’ generated by LDA,
we observed that the model using these rules seemed
Figure 2: 7 - means clustering plotted with PCA to find vectors of words that seemed fairly inuitive.
Once we had generated topics, we created feature
vectors for each city by concatenating the average
per-document topic distribution for each category.
Feature Expansion Because many cities had very few posts in the ‘Discus-
sion’ and ‘Community’ categories, we did not include
Though the initial clustering results were favorable, these in the expanded feature vector.
looking exclusively at meta data ignores the poten-
tially informative and valuable natural langauge and
Page 2 of 5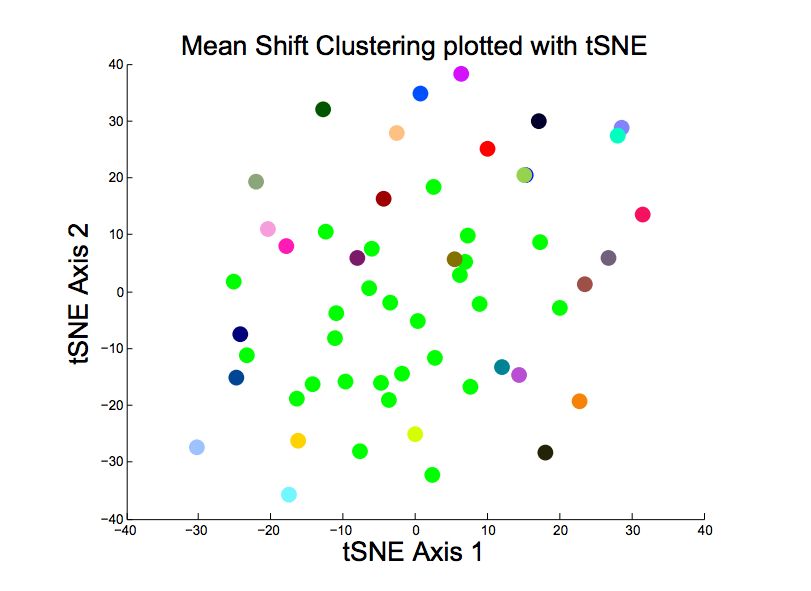
more arbitrary. Nonetheless, after running the clus-
    system      iphone      season       dryer      mattress
                                                                tering with various values, 15 clusters seemed to work
     laptop
  computer
                 phone
               samsung
                              level
                           stadium
                                        washer
                                        kitchen
                                                    furniture
                                                      queen
                                                                fairly well. Because we were working with such a
    power
      audio
                 galaxy
                 sprint
                           parking
                             lower
                                         silver
                                        jewelry
                                                      brand
                                                   mattresses
                                                                high dimensional feature space (roughly R170 ), PCA
      video     verizon     upper        brand        spring
      drive      screen     group     bedroom          patio    was somewhat ineffective in visualizing the clusters.
   speakers      mobile      yards     sectional      frame
  windows       phones     various     diamond       delivery   Instead, we used the tSNE algorithm for visualizing
   memory        repair       state    delivery     outdoor
     digital      trade   thursday      leather     pillowtop   the clusters in a plane2 .
    screen     unlocked       field   microfiber      plastic
     sound      tmobile    football     electric     springs
    remote      service     sunday     stainless      pillow
     player       white       party       rings       quality
   wireless     android      cheap     warranty     warranty
    display     broken     monday     appliances       plush
  processor       store   together       white       support
   monitor      factory   weekend         steel    foundation
     stereo       green     playoff      works       bedding

 Figure 3: Examples of topics from ‘For Sale’ Posts

Clustering Results

In this section, we lay out the results of clustering
the cities according to their expanded feature vec-
tors. We used the same normalization technique as
described above. We also experimented with other          Figure 5: k-means on expanded feature vector
normalization methods throughout, but the results
did not change significantly.                         An example run of k-means is shown in Figure 4.
                                                      The clusters seem to be reasonably distinct and well
K-Means                                               grouped. However, even with the tSNE algorithm,
                                                      the high-dimensionality of the feature vectors makes
                                                      the visual evaluation of the clustering quite diffi-
Once again, we plotted the average within cluster
                                                      cult.
distance versus the number of clusters.

                                                                Mean Shift

                                                        Because the within cluster distance curve for k-means
                                                        was not particularly compelling, we decided to experi-
                                                        ment with the mean shift clustering agorithm3 . Mean
                                                        shift does not presuppose the number of clusters as
                                                        an input to the algorithm but rather takes a band-
                                                        width parameter which affects the convergence rate
                                                        and number of clusters. Before implementing any
                                                        sophisticated choice of bandwidth, we experimented
                                                        with a range of values. We in turn found that there
                                                        was no bandwidth parameter that produced any rea-
                                                        sonable clustering. If the bandwidth parameter was
                                                        too large, then there would be only one cluster, and
                                                        if too small, there would be only singletons. Further-
Figure 4: Average Euclidean Distance from Nearest Cen- more, in all of the intermediate values there was one
          troids.                                       dominant cluster and the remaining clusters would
                                                        be all singeltons or memberless centroids. Figure 5
As can be seen in Figure 4, this distance curve does 2 Using a matlab implementation written by Dr. Laurens J.P.
not have a natural ‘knee’ as the initial distance curve     van der Maaten of Delft University of Technology
had. Unfortunately, this makes a choice of k slightly 3 Using Matlab File Exchange submission by Bart Finkston

                                                                                                           Page 3 of 5
shows an example plot of such. For this application,
SAN
the mean shift algorithm proved a worse method JCS HON CHI
RAL PHI
TLS LIN
than k-means. SEA
CTN NYM DEN NAS
CTN SFO
HON IOW PIT POR AUT
KAN ATL BOI
RAL LEK WAS
SLT DAL PHX ANC
OKL
IDO CUO MIW JAF
STL ABU MAW MIN OMA
CLE TPA
COO HOU DES SAT
DET NEO ORL
RON LIT LAX
CIN
BIR BOS
Figure 7: Abstract representation of Pseudo-Clusters
pseduo-clusters are self-contained, some contain over-
laps with other pseudo-clusters. These overlaping
cities represent cities that were strongly correlated
Figure 6: Mean Shift on expanded feature vector
to both groups. Even though they were not as highly
correlated, we can still interpret this to mean that
the two pseudo-clusters which share some cities, are
Correlation through Iteration of more related than any two pseudo-clusters chosen at
K-Means random.
While the results from our trials of k-means seemed
promising, the clusterings were unsatisfying for two Discussion
main reasons. Firstly, the feature vectors that were
used as input to k-means were in such high dimension Using the small set of three meta data features,
that plotting the clusters in two or even three dimen-k-means clustering performed reasonably well. How-
sions in a meaningful way proved nearly impossible. ever, we were more interested in the rich categorical
Secondly, the individual runs of k-means frequently and natural language features of the posts. We
produced slightly different clusters, possibly due to expanded the feature vector to include categorical
the random initialization of the algorithm and the data as well as average LDA topic weights within
lack of obvious separation of clusters. each category for each city. The clustering on this
To circumvent both these issues, we aimed to pro- expanded feature space was reasonably promising
duce clusters with a greater confidence by grouping but certainly presented some drawbacks. Herein we
cities that were clustered across multiple runs. In- discuss the results in more depth.
stead of relying on a single run of k-means, ran the
algorithm 100 times and looked at the frequency Though this new feature space is certainly
with which cities were clustered together. We gen- more conceptually compelling for the purpose of
erated ‘pseudo-clusters’ by grouping together cities evaluating the similarity of cities, it is generally
that were clustered together more than 50% of the known that the easiest clustering algorithms,
time. We found that these psuedo-clusters provide a including k-means, 4
do not perform well for high-
more stable and reliable measure of whether cities dimensional data . The reason, briefly, is that with
are similar or not by executing this process multiple random initialization, it is possible to get stuck in
times and comparing the results. Figure 5 presents an a local optimum prior to converging to a global
example of a pseudo-clustering. While not graphed optimum. This is one plausible explanation for
in a real space, this type of representation allows the less-than-ideal within cluster distance curve
us to understand more about which cities are re- for the expanded feature vector. Ideally, the
lated to one another and also about how they are 4 Ding et al.: “Adaptive dimension reduction for clustering
related. For instance, we note that while many of the high dimensional data”
Page 4 of 5distance curve would sharply descend, forming or disliked visiting a similar city in the past, where
a bend in the curve near lower values of k, but the measure of similarity in this case could be based
in our case the curve was close to being linear, on the clusters we produced. With a supervised
which suggests a non-optimal convergence for problem like this, we could quantitatively evaluate
most values of k. More sophisticated algorithms whether using the clustering as an input improved
for high-dimensional clustering have been devel- or degraded the accuracy of predictions.
oped, which we discuss in our section on future work.
Furthermore, with such a supervised frame-
The mean shift algorithm performed notica- work we could also perform a more sophisticated
bly worse than k-means. One possible hypothesis analysis of our feature space using feature-wise
is that mean shift, using a Gaussian Kernel, is cross-validation. In other words, we could remove
attempting to converge on distinct normal-like a subset of the features (such as vehicle topics)
cluster distributions, and so with only 55 data points and observe the effect on the performance in the
it is unlikely to have separate clusters that appear to supervised predictions. This could be a fantastic
have any normally distributed qualities about them tool towards better understanding the feature
simply because the separate clusters would be too space before embarking on any attempts to employ
sparse. Admittedly, a more thorough understanding complicated high-dimensional clustering methods.
of the mean shift algorithm is necessary to evaluate Nonetheless, there is a decent amount of literature on
any hypotheses of its poor performance. k-means based high-dimensional clustering methods.
After setting up the framework to numerically
Lastly, we can ask ourselves what it means evaluate the clustering in a supervised setting and
for two cities to be clustered together given our exploring the feature space with cross-validation,
model of the feature vector. On first pass, the if the results continue to be promising it would
clusterering does not map to any obvious features of certainly be worthwhile to attempt to implement
a city such as its geography, population size, wealth k-means based algorithms specifically tailored for
and economic activity. While it seems tempting high-dimensional feature vectors.
to interpret this as a red flag–that something
must be wrong with the clusters–in fact this might Even further down the road, one exciting ap-
suggest that our clustering discovers some intangible plication of the methods we use here would be to
similarity that can’t be found with standard metrics. track the clusters of cities throughout time. Because
Testing the true quality of the clusters as a new all Craigslist posts have a timestamp, extending
metric of similarity would require further tests which the methods described here, we could track the
are discussed below. relationships of cities throughout time, effectively
viewing not only how cities are related but also how
they trend and interact on a personal level.
Future Work
The results of k-means clustering on the expanded
feature vector are a promising start, but a num-
ber of steps need to be taken to improve the
clustering method further as well as to numeri-
cally evaluate the results as we iterate on the method.
Before moving forward and applying more
complicated clustering algorithms, an exciting and
valuable metric would be to apply the clustering
results as an input to an already explored supervised
learning problem. An example problem could be
predicting whether someone will enjoy visiting a
particular city to which they have never been (via
couch-surfing or a hotel stay). For this problem, it
could be very relevant whether they have enjoyed
Page 5 of 5You can also read