ENSURING URBAN RESILIENCE - R.Srinivas Town and Country Planner Town & Country Planning Organization Ministry of Housing and Urban Affairs ...
←
→
Page content transcription
If your browser does not render page correctly, please read the page content below

ENSURING URBAN RESILIENCE

              R.Srinivas
       Town and Country Planner

 Town & Country Planning Organization
  Ministry of Housing and Urban Affairs
          Government of India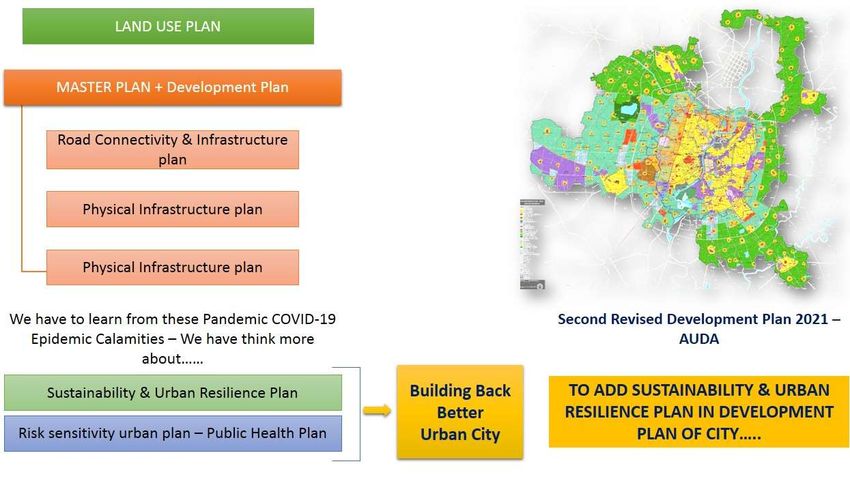
•   Highly urbanized and developed countries are worst
COVID PANDEMIC: URBAN CENTRIC VIRUS SPREAD…..                   affected
 S.No/Continent   Country     No of Cases    %              •   Million plus cities like New York, London,Paris,Rio De
                                                                Jenario and Mumbai have witnessed huge no .of +ve
                              (Lakh)         Urbanization       Cases
 1 N. America     USA         29.35          82.3           •   200,000 illegally subdivided hyper-dense dwellings—
                                                                apartments, basements, attics, lofts and industrial
 2 Europe         UK          2.84           83.4               sheds—across New York City
                                                            •   Concentrated mainly in the outer regions of Queens,
 3 Europe         Italy       2.41           70.4               the Bronx, and eastern Brooklyn (all COVID-19
                                                                hotspots 25 within the city) Density ranges between
 4 Europe         Spain       2.97           80.3               15000-20000 persons per sq km
 5 Europe         France      1.66           80.4           •   As per Greater London Authority, Greater London’s 32
                                                                boroughs, as many as 12 in Inner London have a
 6 Europe         Germany     1.97           77.3               population density of over 10,000 people per sq km.
                                                            •   Boroughs of Hackney, Islington and Tower Hamlets
 7 Europe         Turkey      2.04           75.1               have densities of close to 16,000 people per square
                                                                kilometre, while in Kensington and Chelsea, Lambeth,
 8 Europe         Russia      6.74           74.4               Hammersmith        and    Fulham,    Southwark     and
 9   ASIA         China       0.83           59.2               Westminster, the density is close to 13,000 people per
                                                                sq km.
 10 ASIA          Iran        2.37           74.9           •   In Italy most coronavirus-affected cities and regions
                                                                early in Italy are Lombardy, followed by Emilia-
 11 ASIA          India       6.73           33                 Romagna, Veneto, Marche, and Piemonte. Milan, the
                                                                second most populous Italian city, is located in
 12 N. America    Brazil      15.78          86.6               Lombardy.
 13 Australia     Australia   0.08           86             •   In France, Auvergne-Rhône-Alpes,Burgundy-Franche-
                                                                Comté, Brittany, Grand Est, Hauts-de-France and Île-
Source: 2018 Revision of World Urbanization Prospects           de-France are most affected
Covidvisualizer.com as on 29.5.2020 at 10.00 AM             Urbanization affects the epidemiology of
                                                            emerging infectious diseases
The 733 districts of India have
                      been broadly divided into Red
                      Zones, Orange Zones and Green
                      Zones.

                      Zone classification determines the
                      kind of restrictions placed on the
                      movement of people and supply
                      of goods in a district.

                      30 municipal areas have been identified for
                      stricter measures. The selected municipal areas
                      are: Brihanmumbai or Greater Mumbai, Greater
                      Chennai, Ahmedabad, Thane, Delhi, Indore,
                      Pune, Kolkata, Jaipur, Nashik, Jodhpur, Agra,
                      Tiruvallur, Aurangabad, Cuddalore, Greater
                      Hyderabad,    Surat,   Chengalpattu,   Ariyalur,
                      Howrah, Kurnool, Bhopal, Amritsar, Villupuram,
                      Vadodara, Udaipur, Palghar, Berhampur, Solapur
                      and Meerut.
                      Situation as on 1.5.2020

                      Red Zone Districts:130
                      Orange Zone Districts :284
                      Green Zone Districts:319
Source: India Today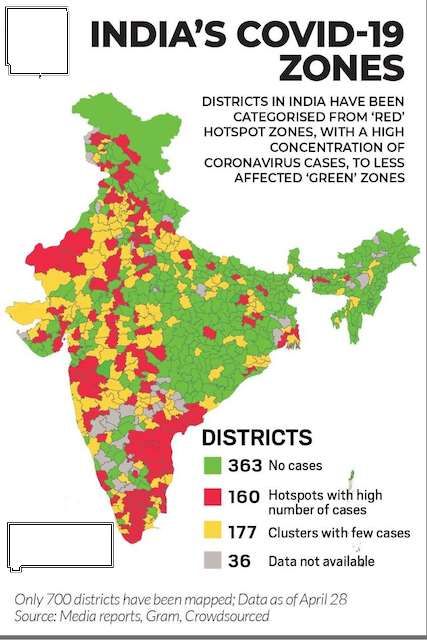
Cities       Population   Density     Cases(as on   Cases per lakh
             (millions)   (Persons    6.7.2020                       TOP 15 CITIES WITH NO                        TOP CITIES WITH CASUALTIES PER
                          Per Sq Km   2.00P M                                                                     1 LAKH POPULATION:
                                                                     OF +CORONA CASES
Mumbai       18.41        15517       83237         889                                                           Greater Mumbai: 51
                                                                     •     All are million plus cities.           Delhi:            27
Delhi        16.31        19960       97200         880
                                                                                                                  Amdavad:          26
Amdavad      6.35         11470       21715         389              •     Except         Hyderabad,              Pune:             26
                                                                           Coimbatore and Jodhpur all             Chennai           22
Indore       2.16         11569       4810          241
                                                                           are covered under Smart                Indore:           12
Jaipur       3.07         6285        3510          115                    cities.                                TOP CITIES WITH Covid +cases 1
Pune         5.04         32554       26956         862                                                           LAKH POPULATION
                                                                     •     These cities constitute 65%            Chennai:     1432
Hyderabad    7.74         4110        17650         471                    of the total cases                     Mumbai:      889
Thane        1.26         14361       45833         3641                                                          Pune:        862
                                                                     •     53    million   Plus    cities         Delhi:       880
Chennai      8.69         26553       66538         1432
                                                                           together constitute :71.55 %           Mallapuram: 622
Agra         1.74         10577       1267          79                     of casualties for total urban          Aurangabad: 533
                                                                           casualties
Bhopal       1.88         6290        2984          165
                                                                         All India Confirmed Case                          674312
Jodhpur      1.13         13438       2948          279
                                                                         All India Deaths                                   19289
Lucknow      2.90         6266        1341          47                   Covid Cases in Million Plus cities               4.02 Lakh
Surat        4.58         13304       5714          127                  Covid Deaths in Million plus cities                  13802
                                                                         Share in Covid Cases of Million plus
Vadodara     1.18         6485        2504          142                  Cities                                               59.45%
                                                                         Share in Covid Deaths of Million plus
Coimbatore   2.15         9950        712           67
                                                                         Cities                                               71.55%
Bengaluru    8.49         11470       8345          98                   Source- https://www.covid19india.org/ As on 29 May, 2020 11:41 AM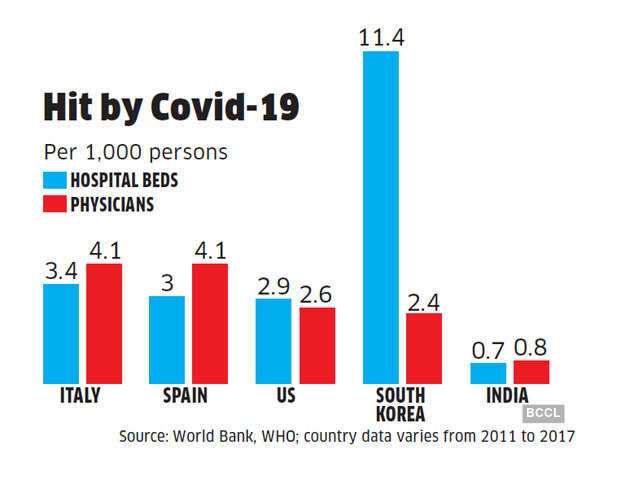
DISTRIBUTION OF HOUSEHOLDS BY
NUMBER OF ROOMS IN INDIA (2001-2011)
HHs (in %)
No. of rooms 2001 2011 How to ensure social
distancing when
Total Urban Total Urban country’s more than
No exclusive room 3.1 2.3 3.9 3.1 half of the households
One room 38.5 35.1 37.1 32.1 Reside in one or two
rooms
Two rooms 30.0 29.5 31.7 30.6
Three rooms 14.3 17.1 14.5 18.4 The urban population in the
country, which is 31.8 percent
Four rooms 7.5 8.7 7.5 9.3 in 2011, is expected to
increase to 38.6 percent by
Five rooms 2.9 3.3 2.6 3.3 2036. The urban growth
would account for over three-
Six rooms and above 3.7 4.0 2.8 3.3
fourth (73 percent) of total
Proportion of two ,three and four rooms households increased during population increase by 2036.
Out of the total population
census 2001-2011. Share of single room’s households has gone down.
increase of 30.7 crores during
However , the %age of households having no room increased from 2.3% 2011-2036 in the country, the
to 3.1% share of increase in urban
population is expected to be
22.4 crores.
STATUS OF HEALTH FACILITIES
Hospital Beds per 1,000 population: 0.7
Doctors per 1,000 population: 0.8
Ambulance per 1,000 population: 3.0
No. of Paramedics per 1,000 population: 2.1
No of ICU Beds per 100,000 population : 2.3
Pandemic Resilient cities
Benchmarking for Health Facilities
Incorporating Health Impact
Assessment while preparing the Local
Area Plan or Neighbourhood Plans
Focus on Senior citizens with co-
morbities
Equity in Distribution of Hospitals with
priorities on emergency Services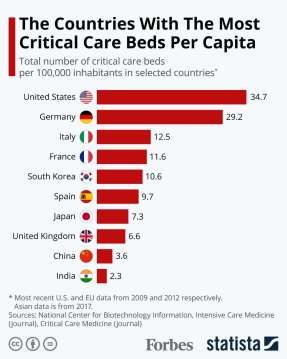
AVAILABILITY OF DOCTORS AND COMPARISON WITH OTHER COUNTRIES AND POPULATION GROWTH.

                                                       Medical doctors (including
                                                         general practitioners,                                                No. of positive cases up to
Country                                Year               specialists & others)          Medical doctors/ 10,000 people               24 April 2020
United States                          2017                    1,698,252                              26.12                              902,582
Italy                                  2018                     482,272                               39.77                              192,994
Spain                                  2017                     361,326                               38.72                              219,764
Germany                                2017                     702,390                               42.48                              150,383
China                                  2017                    2,828,999                              19.80                               82,816
France                                 2018                     424,674                               32.67                              114,657
Iran                                   2018                     259,208                               15.84                               89,328
United Kingdom                         2018                     377,078                               28.11                              148,377
Switzerland                            2017                     72,648                                42.95                               28,894
Turkey                                 2017                     299,994                               18.49                              107,773
India                                  2018                    1,159,309                               8.57                               24,942
  Sr. No.         City                                Population in 1951                Population in 2011                Population growth

  1               Mumbai                                        2,966,902                      16,434,386                              454%
  2               Delhi                                         1,744,000                      12,877,470                              638%
  3               Kolkata                                       2,956,475                      13,205,697                              347%
  4               Chennai                                       1,416,056                      6,560,242                               363%
  5               Bengaluru                                      778,977                       5,701,446                               632%
  6               Hyderabad                                     1,085,722                      5,742,036                               429%
  7               Ahmedabad                                      788,300                       4,525,013                               474%
  8               Pune                                           488,419                       3,760,636                               670%
   Source Global Health Observatory and Census of India/ Observer Research Foundation
PANDEMIC RESILITENT CITY:GUIDELINES The study will assess the following key areas. To understand the concept of resilience and its indicators in urban planning To explore how it is different from conventional planning and its importance in the present scenario To identify resilience gaps in the existing urban planning framework To suggest planning norms/programs for building urban resilience To suggest the ways on how to incorporate the recommendations in existing legislative framework/regulations regarding URDPFI Guidelines,2014 and Model Building Bye Laws,2016 To mainstream disaster resilience (natural and manmade) in Master Plan for cities and towns
Revisiting guidelines and regulations for managing Pandemics • Urban and Regional Development Plan Formulation and Implementation Guidelines,2014 • Model Building Bye Laws,2016 These have to be revisited with regard to: FAR Prescriptions Density allocation/Management Intensification of land uses along transit corridor Mixed use development City sprawl vs compact development Provision of open spaces Health Infrastructure Time to rethink overall ‘sustainability’ quotient of densities as it should life- threatening in the face of pandemic of the scale and magnitude of COVID-19. Unrestrained population densities in cities put severe pressure and undermine and overwhelm existing public health systems.
URDPFI GUIDELINES :AMENDMENTS TO BE SUGGESTED
Section(s)      Existing Provision        Amendments/Addendum to be suggested
1.5.5           Special Purpose Plan      Contents for Pandemic Resilient Plan to be suggested
1.5.7           Projects/Research         Taking up Research in Pandemic Resilience
2.2.5           Specific Purpose Plan     To be taken up in the Emergency situation
2.2.5           Disaster Management       Section on Pandemic Resilience as a part of Master
                Plan                      Plan/Zonal Plan /Local Area Plan
4.5.2           Delineation of            Delineation of Containment Zone or Areas with regard to
                Area/Region               vulnerability to Epidemic /Pandemic
4.8             Composition of            Inclusion of Chief Medical officer/ Disaster Management
                Committees for Planning   Officer
                Committee
5.3             Distribution of Landuse   Revisiting the Areas to be kept under green and blue
                                          infrastructure
5.3.8           Medi city                 Strengthening the Health Infrastructure in terms of dedicated
                                          Pandemic Treating Hospitals
8.4.3           Health Care               Benchmarking in terms of No of Doctors/para medics/ICU
                Infrastructure            facilities availability per 1000/1 lakh population
9.2             Simplified Development    Provision of medical facilities in Industrial Zone/Mixed use
                Regulations               zones/Primary Activities Zone
MODEL BUILDING BYE LAWS: AMENDMENTS TO BE SUGGESTED
• Most of the States have amended their Building Bye Laws on the lines of Model
Building Bye Laws of TCPO/MoHUA
Sction(s) Existing Provision Amendments/Addendum to be suggested
3.1 Flexible FAR Depending on the carrying capacity and density
management
3.10.4 Development Controls on Health Mandatory provision of Isolation Wards( 5% of the FAR
Centers and Nursing Homes to be allotted to these services) necessary provisions
such as High Efficiency Particulate Arrestance (HEPA)
4.2/4.3.1. Habitable Room Minimum built up space for EWS/LIG
2
3.4.5 Resettlement and Slum in-situ Minimum Plot Size
upgradation or Regularization of
Unauthorized colonies
3.4.6 Low Income Housing Minimum Plot Size
4.3.44 Water and sanitary requirements Keeping in view of social distancing in assembly
buildings As per 69th round of NSSO Built-up area per family for the poorest 60% of the urban population is 380 square feet (sq ft). Average space per person, excluding the circulation area in the house, is 72 sq ft. This is even less than the built-up area of 96 sq ft recommended for a prisoner in India . Average per capita space for the owners of rented house or slum dwellers in city areas is only 42 sq ft. In recent past , FSI used as a tool of planning is rooted with the idea of tradability and maximum profit. Leverage for providing additional dwelling units for Slum Redevelopment Optimum FSI and density management PPP role in providing the housing for slums.
Prescribing average built up space for Slums redevelopment or Housing for EWS keeping in view the social distancing amid Pandemic 5 crore migrants have retuned to natives which gives an idea that they have no housing security. Rapid spread of the COVID19 virus and the high death rates seen in hyperdense megacities across the world :Wakeup call for urban planners, designers, policymakers and administrators to reconsider the long-held belief that denser cities are indeed better cities.
Decentralised urbanisation holds the key to healthy urban growth. (Moving away from Primate Centric Urbanization) Decentralized governance will assist several viable cities to grow and share amongst them the urbanization pressures that are currently concentrated on a handful of urban centres. Need for streamline the Integrated Development of Small & Medium Towns scheme from the point of view of densities with greater financial capacity, functional liberty, and empowerment. Health Facilities in the containment zone must be geo- tagged and information should be made available through mobile applications in view of any epidemic /pandemic.
INPUTS TO MOHUA PRIOR TO LOCKDOWN Identify, isolate, and care for patients early, including providing optimized care for infected patients while approving the layouts/building plan, clear cut marking of space for isolated ward has to be ensured. The isolation ward should not function as temporary arrangement and every hospital must certify that they have space for isolation ward while obtaining the Occupancy – cum-completion certificate. All hospitals must be geo tagged so as to facilitate visit of affected persons without any delay. Buildings should be properly sanitized, especially those areas that are damp and there is restricted sunlight. While preparing building design, it has to be ensured that proper sunlight is accessed in the buildings, especially hospital buildings that are frequented by the patients.
GIS mapping for vulnerable areas Prepare GIS map of a city where the incidences of virus spread or areas vulnerable to virus (Areas to be mapped where the visits may be restricted) Perform routine environmental cleaning Routinely clean all frequently touched surfaces in the workplace, such as workstations, countertops, and doorknobs. Use the cleaning agents that are usually used in these areas and follow the directions on the label. Aadditional disinfection beyond routine cleaning is recommended at this time. Provide disposable wipes so that commonly used surfaces (for example, doorknobs, keyboards, remote controls, desks) can be wiped down by employees before each use.
MINISTRY OF HEALTH DIRECTIONS GIVEN ON 30.4.2020 Containment zones in these RED districts have to be delineated based on: Mapping of cases & contacts. Geographical dispersion of cases and contacts. Area with well demarcated perimeter . Enforceability Depending on above factors: For colony/mohallas/municipal wards or police-station area/municipal zones/towns etc. as appropriate can be designated as containment zones. Rural areas - villages/clusters of villages or group of police stations/gram panchayats/blocks etc. as appropriate can be designated as containment zones. Area should be appropriately defined by the district administration/local urban body with technical inputs from local level. In the spirit of effective containment, it is advisable to err on the side of caution. Buffer zone around containment zone has to be demarcated.
Development Plan-2021 AUDA

Source: Amdavad Urban Development Authority+ CEPT University
ROLE OF SMART CITIES:INTEGRATED COMMAND AND CONTROL CENTRE
How does ICCC facility help city respond? Notable actions taken
Data integrated onto single platform for
ICCC is leveraged as war rooms better insights enabling accurate
decisions in a tough environment
• 24x7 “war-room” for multiple depts. to coordinate surveillance,
Process change alongside tech
contact tracing, helplines, quarantine tracing etc.
implementation e.g. using PAS2 & VMD3
• Live data visualization & data based decision making for city for city wide messaging
Authorities
Ecosystem of partners to deliver
One stop shop for all initiatives outcomes such as public sector, NGOs
• Citizen helpline, complaint platform, counseling, etc. in city's response e.g. Bhopal took
HP & PwC's help to build its ICCC
telemedicine centre etc.
COVID-19 tracking dashboard
• Field visits, MMUs1, sanitization efforts coordinated centrally
• Virtual training centre for healthcare and relief staff
Source: Smart City Mission Directorate ,MOHUA,May,2020VARIOUS COVID-19 RESPONSE INITIATIVES MANAGED CENTRALLY IN THE ICCC
5
Surveillance and dashboard Real time patient tracking Online training centre
Surveillance and dashboard Real time patient tracking Online training centre
Online medical consultation Patient support platforms 24*7 citizen helplines
Source: Smart City Mission Directorate ,MOHUAWAY FORWARD Revisiting the planning guidelines/model building regulations with both short and long term strategies (Pandemic Resilient Cities). Positives of Smart City Mission and its strong interface with GIS and Real Time Data Flow. Density Management …availability of disaggregated data and possibilities of micro zonation though Local Area Plans Strong GIS interface with ICC Room ….Mapping of vulnerable areas vis-à-vis Medical/Health facilities. Revisiting our redevelopment policies as well as transit oriented policies.(Density allocation while recommending redevelopment) Focus should be on redistribution of population along with decentralisation of economic activities…I am a firm believer that this will definitely create economic opportunities for migrant laboures Time is ripe for having the National Policy for Relief and Rehabilitation for COVID19 and it should have the representation of Ministry of Health,MoHUA,MHA,MoCA,DPIIT, MoR and MoF clearly highlight the role of Urban Planning in mitigating the pandemic.
THANKS TO ALL PARTICIPANTS
OF COURSE…..

        STAY SAFE AND STAY HEALTHY
You can also read