9th MEETING OF THE SCIENTIFIC COMMITTEE
←
→
Page content transcription
If your browser does not render page correctly, please read the page content below

9th MEETING OF THE SCIENTIFIC COMMITTEE
                              Held virtually, 27 September to 2 October 2021

                                                       SC9-SQ02
                    Summaries of Squid Genetics Programmes in SPRFMO
                                               Squid Working Group

1. Introduction
In 2018, (Paragraph 183 SC6-Report) the SC recommended that members and CNCPs participating in the
jumbo flying squid fishery join in the genetic analysis work for this species. This included encouraging the
exchange and sharing of jumbo flying squid samples. Then, during the following 2019 SC meeting (Paragraph
259 SC7-Report), several presentations were made on sampling design for genetic analysis and different
genetic techniques, and the SC agree to use standardized approaches for sample collection and genetic
analysis, which means that the Squid Genetics Programme was launched. Although it has been affected by the
global COVID-19 pandemic, the Programme has continued to make progress in 2020 and 2021. This summary
is based on templates for comparison of Squid Genetics Programmes that were submitted to the SPRFMO
Scientific Committee Squid Working Group by Chile (Annex 1), China (Annex 2), Korea (Annex 3) and Peru
(Annex 4) in July 2021.
    •   SC9 is requested to note the progress of SPRFMO Squid Genetics Programmes
    •   Members with active Squid Genetics Programmes are requested to complete the Squid sample
        exchange form and exchange samples of squid for genetic analysis in order to compare and extend
        squid genetics programmes among SPRFMO Members.

2. Sample size and position
Samples are collected from catches of the fisheries, thus where and how to obtain these samples, on the sea
or in port, in the high seas or in jurisdictional waters, depends on the fleet dynamics of each individual
Member. All samples are recorded with detailed biological information such as sex, length and so on, however
generally only mature squid are selected to use to do genetic analyses. The exception to this is that large squid
with mantle length more than 65 cm are assumed to be large phenotype, so the maturity stage is not essential
in this case. The sample sizes used for of different Members ranged from 90 to 130, covering small, medium
and large phenotypes.
In coastal waters, Chile collected 130 large phenotype Jumbo flying squid from three areas of the EEZ (North
Chile, n=35; Central Chile, n=52; South Chile, n=43) in 2021. Peru collected samples from North, Central and
Southern areas of Peru both close to the coast and offshore, including small (n=48) and medium (n=46)
phenotype squid.
For the high seas fishery, Korea collected 96 squid from different positions of the Convention area (i.e., O1,
O2, O3) between September and December 2019. China collected 90 Jumbo flying squid (large phenotype,
n=18; medium phenotype, n=42; small phenotype, n=30) from three areas during 2018-2019.

                                          PO Box 3797, Wellington 6140, New Zealand
                               P: +64 4 499 9889 – F: +64 4 473 9579 – E: secretariat@sprfmo.int
                                                        www.sprfmo.int
SC9-SQ02
                                                                               Summaries of Genetics Programmes

3. Technique used or plan to be used
Various genetics analysis methods and enzymes are used by different Members. This may cause some
difficulties when comparing the results, but the variation will be useful to explore better and more accurate
ways to assess the population genetic structure of jumbo flying squid.
Chile plan to use the DArTseq technique to obtain the SNPs but the restriction enzymes are yet to be
determined. Amplifications of COI and ND2 mitochondrial genes by PCR are already being conducted in their
laboratory.
Peru has prepared libraries for analysing SNPs using ddRAD-Seq technology, using restriction enzymes EcoRI
and SbfI, and libraries will be sequenced and analysed later. In addition, they sequenced and analysed two
mtDNA genes, the cytochrome c oxidase subunit I (COI) and the NADH dehydrogenase (ND2), considering the
DNA extraction used for SNPs analysis.
China used the Genotyping-by-sequencing (GBS) technique to develop the high quality SNPs, and the GBS
libraries were performed following two restriction enzymes (TaqI and MseI).
Korea developed SNP markers using GBS technology, using restriction enzymes PstI and MspI to prepare
libraries.
4. Preliminary results
Because of the influence of the COVID-19 pandemic in 2020 and 2021, the progress of genetics analysis has
been significantly delayed. However Members are continuing to progress this work, and some are already
achieving preliminary results.
Results from China show low genetic diversity and genetic differentiation in each phenotype. Their work
indicated that the three phenotypes (small, medium, large) did not differentiate significantly. The work also
suggested that the population appeared to be seriously inbred.
5. Next steps
It was noted that different Members appear to be using different techniques, for example different enzymes.
It was suggested that although data is easier to exchange than samples, in the first instance sample exchange
and the application of different techniques to the same samples will give further information about how big
the differences are.
Members agreed to introduce a process for the exchange of squid tissues to facilitate and increase the
robustness of SPRFMO squid genetics research. A Squid sample exchange form is available on Teams which
lets Members inform one another of squid samples that they have available or that they would like to request,
in order to compare and extend squid genetics programmes among SPRFMO Members. This template was
circulated on 30 July 2021.
1) If a Member would like to request genetics samples for use by their programme there is a "Sample requests"
tab which they complete with their contact information and a description of the kinds of samples they are
interested in. This information, using as many rows as necessary, is sent to the Secretariat.
2) If a Member would like to make genetics samples available for use by other programmes there is a "Samples
available" tab which they complete with their contact information and a description of the kinds of samples
they are able to share. This information, using as many rows as necessary, is also sent to the Secretariat.
3) The Secretariat will circulate a compiled list of genetics samples requested and offered.
4) The Members can then contact the Squid genetics sampling Coordinator of a programme with which they
would like to exchange samples (either requesting or making available). They can make arrangements for how
and when the samples will be sent, and any logistical arrangements such as who will pay for shipping.
5) Details of the samples sent can be completed in the "Samples sent" tab and sent to the Secretariat so that
a register can be maintained.

                                                                                                            2
SC9-SQ02
                                                                                    Summaries of Genetics Programmes

                             Annex 1 Chile Genetics Programme

              POPULATION GENETICS OF JUMBO SQUID IN CHILEAN WATERS

                                             Chris�an M. Ibáñez
                                         Universidad Andres Bello, San�ago, Chile

1.- Sample collection

 Sampling     Sampling                    Sample    Mantle length Maturity
                             Phenotype
   date          area                    number          (cm)         stage
May 2021     North Chile       Large        35          63-87      II-III
May 2021     Central Chile     Large        19          71-83      II-III
April 2021   Central Chile     Large        33          59-74      II-III
June 2021    South Chile       Large        43          67-86      II-III           North
                                                                                                  Coquimbo
                                                                                                 Quintay
                                                                                    Central      San Antonio
                                                                                                 Lebu
                                                                                    South

                                                                                                                 3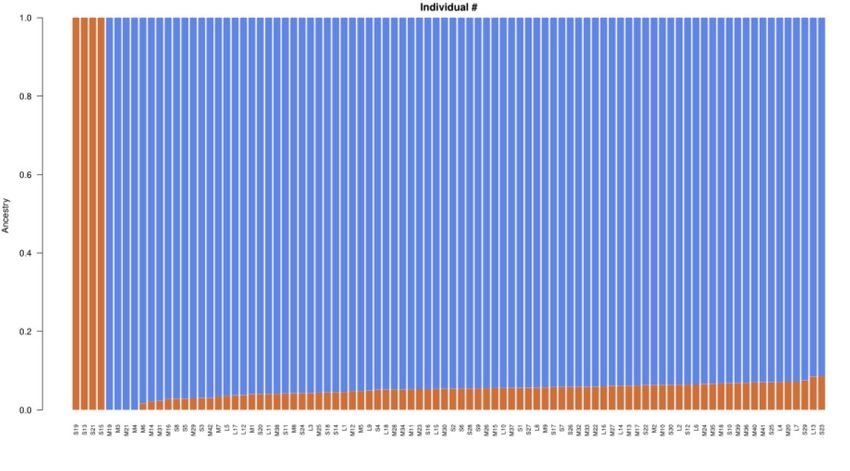
SC9-SQ02
                                                                                                 Summaries of Genetics Programmes

 2.- DNA extraction

Extrac�on method Concentra�on             OD260/280          OD260/230       Total weight    Completeness
Saline                100.1-2447.3     1.98-2.03        1.81-1.99          1-5µg/µl         Good condi�on

                                                                    Also, amplifica�ons of COI and ND2 mitochondrial genes by
                                                                    PCR are already being conducted in our laboratory.

3.- Libraries preparation and sequencing

         Technology         Restric�on                Size               Sequencing
                             enzymes                                      pla�orm
   DArTseq              To be determined     75 – 150 pb            IlluminaHiSeq

                                     For SNPs, we deposited mantle �ssues inRNAlater, which will
                                     be sent to Australia for analyses.

                                                                                                                              4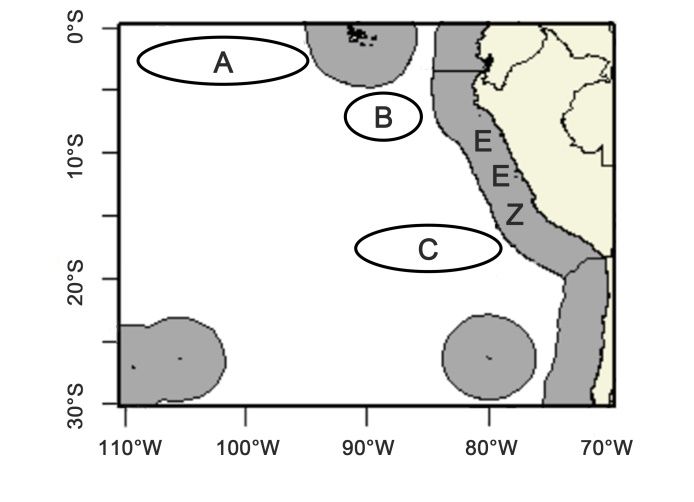
SC9-SQ02
                                                                              Summaries of Genetics Programmes

We expect to find similar results to those reportedin previous research:

•       First, an absence of gene�c popula�on structureof jumbo squids from the South Pacific.
•       Second, a low gene�c diversityrelated to recent popula�on expansions.
•       Third, an absence of gene�c divergence between the phenotypes associated to size at maturity.

        Jumbo squid samples

                         List of bioinformatic analyses and respective software

                             Steps                           So�ware name
                     Gene�c diversity analysis                    Arlequin
                          Evolu�onary tree                          BEAST
                    Popula�on gene�c structure                    Structure
                Principal component analysis (PCA)                    R
                                  Fst                             Arlequin
                           Divergence �me                           BEAST
                      Effec�ve popula�on size                        BEAST

                                                                                                           5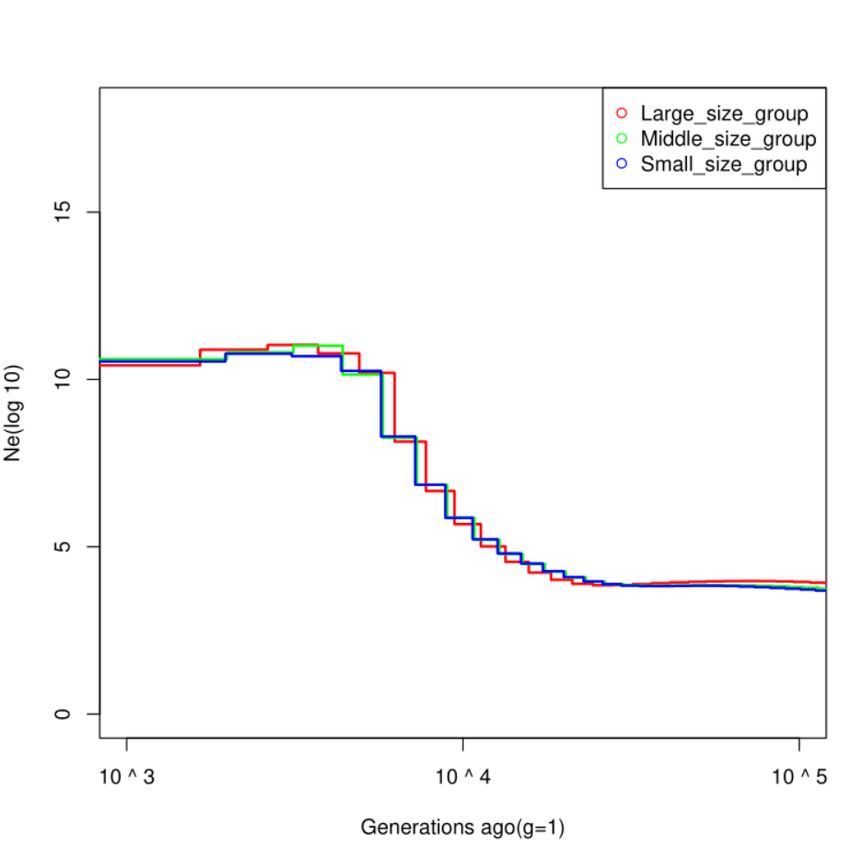
SC9-SQ02
                                                                        Summaries of Genetics Programmes

 Annex 2 China genetics study of Jumbo flying squid, methods and results

                                Congcong Wang, Gang Li, Hao Xu

            National Data Center for Distant-water Fisheries, Shanghai Ocean University

Summary

As mentioned during the SC7 meeting in 2019 (ref.: paper SC7-SQ12), we selected 90 individuals
from three phenotypes, large phenotype (n=18), medium phenotype (n=42) and small phenotype
(n=30), and extracted genomic DNA from muscle. The Genotyping-by-sequencing (GBS) technique
was used to develop the high quality SNPs, and the GBS libraries were performed following two
restriction enzymes (TaqI and MseI).

A total of 41,914 highly credible SNPs were obtained using GBS. The results showed low genetic
diversity and genetic differentiation in each phenotype. Heterozygote deficiency and inbreeding have
led to this low level of diversity. According to population differentiation, genetic structure and the
population genetic distance, the three phenotypes did not differentiate significantly and did not form
geographical isolation. It is suggested that the three phenotypes should be regarded as a management
unit.

1 Sample collection

90 Jumbo flying squid (large phenotype, n=18; medium phenotype, n=42; small phenotype, n=30)
were collected in 3 areas of the South East Pacific during 2018-2019 (Figure 1). Detailed sampling
information are resented in Table 1. For the small and medium phenotypes, only matured squid were
selected.

                                                                                                     6
SC9-SQ02
Summaries of Genetics Programmes
Figure 1 Illustration of sampling area
Table 1 Sampling time, area and biological information of samples
Sample
Sampling date Sampling area Phenotype Mantle length (cm) Maturity stage
number
2018.10 76°28′W-81°19′W/17°52′S-20°31′S Large size 18 100-120
2019.08 79°32′W~86°04′E/3°33′~20°31′S Medium size 42 30-60 >III
2018.08 95°25′W-106°59′W/1°26′S-3°09′S Small size 30 15-25 >III
2 DNA extraction
The genomic DNA was extracted from approximately 50 mg of muscle using a modified phenol-
chloroform procedure following the described by Gu et al. (2013). In addition, to obtained the high-
quality genomic DNA, digested 1 hour with RNase A in 37℃ (Takara, Japan) for removing RNA.
The purity and concentration of DNA inspected on NanoDrop2000, the completeness detected by 1%
agarose gel electrophoresis, and the specific requirements are shown in the Table 2.
Table 2 The specific requirements of genomic DNA
Extraction Concentration OD260/280 OD260/230 Total weight Completeness
method
modified
phenol- No serious
≥15 ng/µl ≥1.8 ≥1.5 ≥800 ng
chloroform degradation
procedure
3 Libraries preparation and sequencing
7SC9-SQ02
Summaries of Genetics Programmes
The GBS technique was used to develop the high quality SNPs, and the GBS libraries were performed
following two restriction enzymes (TaqI and MseI, New England Biolabs, NEB, USA) digesting the double-
strand genomic DNA for several fragments which size for a range of 500-600 bp. A sample-specific adapter
was ligated to the end of digested fragments and then pooled together. After filtration, about 500 bp of
fragments remained in the pooled mixture. The target GBS tags were amplified with specific primer to produce
the final 500 bp size product for constructing sequencing library, and then sequencing on Illumina HiseqTM,
PE150.
Quality control was carried out on the data obtained by sequencing, and low-quality data were filtered to obtain
clean data. Based on the putative loci and the maximum likelihood framework identify the SNPs, which further
screened by the parameters (MAF ≥ 0.05, missing ratio ≤ 0.2, the lowest depth=2 ), obtained high quality
SNPs for genetic analysis.
Table 3 The information of library and sequencing
Technology Restriction Size Sequencing platform
enzymes
Genotyping-by-sequencing (GBS) TaqI and MseI 500 bp Illumina HiseqTM, PE150
4 Data analysis
4.1 Genetic analysis
The population genetic diversity was analyzed by Populations, and the statistical values including the
private SNPs number (Private), observed heterozygosity (Obs-He), expected heterozygosity (Exp-
He), observed homozygosity (Obs-Ho) expected homozygosity (Obs-Ho), the Nucleotide diversity
(Pi), population coefficient of inbreeding (Fis) (Catchen et al., 2011). The Fis was used to assessed
whether exist inbreeding cause generate a hidden population, lead to reduction in heterozygosity
(Catchen et al., 2013).
The Obs-He and Exp-He of large phenotype were 0.21210 and 0.26069, respectively. The Obs-He of
middle phenotype was 0.21518 and the Exp-He was 0.26826. The Obs-He and Exp-He of small
phenotype were 0.21512 and 0.26673, respectively. This showed that the average Obs-He in the three
phenotypes was relatively low, and that the Exp-He was slightly higher, indicating a decrease in
genetic diversity. Fis values were positive, ranging from 0.18562 to 0.20974, which suggests that
inbreeding may have occurred within the populations. Loss of heterozygosity leads to an increase in
homozygosity, which resulting an increase in inbreeding withdrawal rates and a decrease in genetic
8SC9-SQ02
Summaries of Genetics Programmes
diversity, as well as a decrease in the ability of species to cope with adverse environmental conditions
(Yang et al., 2000). According to the results of genetic diversity parameters, effective management
measures should be taken to reduce the loss of heterozygosity and inbreeding as much as possible in
order to protect the genetic diversity of Jumbo flying squid.
Table 4 The statistical values of genetic diversity
Phenotype Private Obs-He Obs-Ho Exp-He Exp-Ho Pi Fis
Large size 0 0.21210 0.7879 0.26039 0.73961 0.26913 0.18562
Middle size 49 0.21518 0.78482 0.26826 0.73174 0.27207 0.20974
Small size 9 0.21512 0.78488 0.26673 0.73327 0.27185 0.20071
4.2 Population genetic differentiation
The software named bayscan 2.1 was used to analyze the genetic differentiation index (Fst). The Fst
is an important parameter to measure the extent among populations. The result was shown in the
Table 5.
Note: Fst: 0~0.05, low genetic differentiation between populations;
0.05~0.15, medium genetic differentiation exists between populations;
0.15~0.25, comparatively high genetic differentiation exists between populations;
> 0.25, high genetic differentiation between populations. (Wright S,1965)
Table 5 Population pairwise Fst values of populations based on the SNP
Fst/Nm Large size Middle size
Large size
Middle size 0.0128729
Small size 0.0160474 0.0112939
The RAxML 8 was used to phylogenetic analysis calculated the genetic relationship between samples
and represented it by a tree-like diagram. The analysis based on the SNPs and maximum
9SC9-SQ02
Summaries of Genetics Programmes
likelihood algorithm. According to the relationship between individuals, the evolution of samples can
be expressed intuitively. The phylogenetic tree constructed by maximum likelihood method (Figure
2) showed that there was no significant clustering between individuals of different phenotypes.
Figure 2 Maximum likelihood evolutionary tree based on SNP sites
We assessed the proportion of phenotypic variance by using principal component analysis (PCA)
with GCTA 1.26.0 (Price et al., 2006). The distance between the sample points represents the genetic
distance between the samples, and the principal component clustering of the samples is obtained. The
result of principal component analysis (PCA) showed (Figure 3) that the three phenotypes were not
clustered and could not be well distinguished, which was consistent with the results of genetic
differentiation index analysis.
10SC9-SQ02
Summaries of Genetics Programmes
Figure 3 Principal component analysis (PCA) of Jumbo flying squid was implemented in GCTA
In the population structure investigation, we used a free available software program ADMIXTURE
1.3.0 which depends on the model-based Bayesian analyzed all of the samples based on the filtered
SNPs locus. Briefly, the number of subpopulation (k) of samples were estimated ranged from 2 to 19,
the optimal K determined by the cross validation (CV) error (Cross validation error), where the lowest
position of CV error corresponds to K. According to the K value corresponding to the lowest point
of CV error, the optimal number of clusters is determined as 2 (Figure 4), as shown in Figure 5. K=2
suggests that all samples in this study may have come from two primitive ancestors.
Figure 4 Cv Error value corresponding to each K value
CV, cross validation
11SC9-SQ02
Summaries of Genetics Programmes
Figure 5 Population structure of all samples when divided into two genetic components and each color
represents one putative ancestry background
4.3 Population history
Analysis of historical population dynamics can be used to deduce the evolutionary characteristics of
a population, such as divergence time, effective population size and gene flow. In this study, effective
population size was estimated by Pairwise Sequentially Markovian Coalescent (PSMC), an R
software package, which is a statistic that describes the density variance of heterozygous SNP loci in
different regions of the genome. Population differentiation time was calculated using Beast2
(Bouckaert et al., 2014), which analyses the molecular sequence phylogeny conditions, based on the
Bayes evolutionary theory. The Markov Chain Monte Carlo (MCMC) algorithm was used to obtain
the average space of the tree (Gutenkunst et al., 2009). The beauti and TreeAnnotator programs were
used to calculate the divergence time.
The differentiation time of three phenotypes is shown in Figure 6. It can be seen that the middle
phenotype group was differentiated from the group about 800,000 years ago, the large phenotype
group and the small phenotype group were diverged about 600,000 years ago.
12SC9-SQ02
Summaries of Genetics Programmes
Figure 6 Population differentiation time plot was based on Bayesian phylogenetic analysis system
The historical effective population dynamics is shown in Figure 7. As a whole, the trend of effective
population size in these three phenotypes was consistent. The rapid expansion time was estimated to
be approximately 20,000 to 6,000 years ago, the effective population size was rose rapidly from about
104 to about 1011.
Figure 7 Historical effective population dynamics of Jumbo flying squid
Supplementary material
13SC9-SQ02
Summaries of Genetics Programmes
Table 6 List of bioinformatics analysis software
Steps Name of software
Genetic diversity analysis Populations
( https://catchenlab.life.illinois.edu/stacks/comp/populations.php)
Evolutionary tree RaxML/FastTree version 8
(https://github.com/stamatak/standard-RAxML)
Population genetic structure Admixture1.3.0
(http://www.genetics.ucla.edu/software/admixture/)
Principal component analysis (PCA) GCTA 1.26.0
(http://cnsgenomics.com/software/gcta/#Overview)
Fst Bayscan 2.1
(http://cmpg.unibe.ch/software/BayeScan/versions.html)
Time of divergence Beast2 2.5.2
(http://www.beast2.org/)
Historic changes in effective PSMC 0.6.5-r67
population size
(https://github.com/lh3/psmc)
References
Bouckaert R, Heled J, D Kühnert, Vaughan T, Drummond AJ. BEAST 2: A Software Platform for Bayesian
Evolutionary Analysis. PLOS Computational Biology, 2014, 10(4): e1003537.
Catchen JM, Amores A, Hohenlohe P, Cresko W, Postlethwait JH. Stacks: building and genotyping loci, De
Novo from short-read sequences. G3., 2011, 1: 171-182.
Catchen J, Bassham S, Wilson T, Currey M, O’Brien C, Yeates Q, Cresko WA. The population structure and
recent colonization history of Oregon threespine stickleback determined using restriction-site associated DNA-
sequencing. Mol. Ecol., 2013, 22: 2864-2883.
Gu MY, Xu QH. Preliminary study on improved genomic DNA extraction method from Trematomus
bernacchii. Journal of shanghai ocean university, 2013, 22(2): 168-172.
Gutenkunst RN, Hernandez RD, Williamson SH, Bustamante CD. Inferring the joint demographic history of
multiple populations from multidimensional SNP data. PLoS Genetic, 2009, 5: 1-10.
14SC9-SQ02
Summaries of Genetics Programmes
Price AL, Patterson NJ, Plenge RM, Weinblatt ME, Shadick NA, Reich D. Principal components analysis
corrects for stratification in genome-wide association studies. Nat. Genet., 2006, 38(8): 904-9.
Wright S. The Interpretation of Population Structure by F-Statistics with Special Regard to Systems of Mating.
Evolution, 1965, 19(3): 395-420.
Yang R, Yu ZN, Chen ZZ, Kong XY, Dai JX. Allozyme variation within Crassostrea plicatula and Crassostrea
gigas from Shandong coastal waters. Journal of Fisheries of China, 2000, 24(2): 130-133.
15SC9-SQ02
Summaries of Genetics Programmes
Annex 3 Korea Template for presenting the methods and results of
genetics study for Jumbo squid
Short summary
GBS can be used as a fast and cost-effective tool in population genetics, QTL (quantitative trait locus)
discovery, high-resolution mapping, and genomic selection. In this study, we developed single
nucleotide polymorphism (SNP) markers using genotyping by sequencing (GBS) without relying on
the reference genome sequence for population analysis of Dosidicus gigas.
Dosidicus gigas were collected between September and December 2019 from different positions.
Genomic DNA was extracted using the modified cetyltrimethylammonium bromide (CTAB) method.
The extracted 96 genomic DNAs was used as GBS library constructions. The preliminary result of the
study found a set of 1,076 filtered SNPs for further analysis.
1 Sample collection
Table 1. The list of sample collection.
Sampling Sample Mantle Maturity
Sampling date Phenotype
area number length (cm) stage
18-Sep-19 O1 2 31
19-Sep-19 O1 2 28.1, 32.9
20-Sep-19 O1 1 66.5
21-Sep-19 O2 2 26, 28.6
22-Sep-19 O2 2 27, 26.2
23-Sep-19 O2 2 58, 69
25-Sep-19 O2 1 64.5
27-Sep-19 O2 2 62, 64.5
29-Sep-19 O2 3 54 - 61.5
30-Sep-19 O2 3 48.5 - 68
3-Oct-19 O2 1 48
5-Oct-19 O2 2 40.5, 50
9-Oct-19 O2 1 62
12-Oct-19 O2 1 59
13-Oct-19 O2 3 52 - 64
14-Oct-19 O2 3 52 - 56
16SC9-SQ02
Summaries of Genetics Programmes
22-Oct-19 O2 1 57.5
27-Oct-19 O2 2 59.4, 63.5
29-Oct-19 O2 1 62.7
1-Nov-19 O2 3 56.5 - 62
2-Nov-19 O2 2 60.2, 62.2
3-Nov-19 O2 2 57.2, 62.5
4-Nov-19 O2 1 80.5
7-Nov-19 O2 4 53.5 - 69.2
10-Nov-19 O2 2 55.3, 55.5
18-Nov-19 O2 9 53.3 - 61.7
20-Nov-19 O2 4 43.7 - 60.8
21-Nov-19 O2 2 54.3, 59
29-Nov-19 O2 2 60.3 - 64.5
2-Dec-19 O2 4 48 - 62.7
3-Dec-19 O2 2 56, 60.3
4-Dec-19 O2 6 45 - 65.3
5-Dec-19 O2 7 34.2-64
6-Dec-19 O2 4 61.5-67.5
7-Dec-19 O2 2 57.3, 65.5
8-Dec-19 O2 2 63.7, 65.5
10-Dec-19 O3 2 63.5, 64.3
11-Dec-19 O3 1 64.2
17SC9-SQ02
Summaries of Genetics Programmes
Figure 1. The positions of listed sample.
2 DNA extraction
Extraction method Concentration OD260/280 OD260/230 Total Completeness
weight
modified
cetyltrimethylammonium 50ng/µl 1.6~1.8 1.6~1.8 1~2µg pass
bromide (CTAB) method
3 Libraries preparation and sequencing
Technology Restriction Size Sequencing
enzymes platform
PstI (CTGCAG)
GBS (genotyping- 200~300bp HiSeqX
by-sequencing) & MspI (CCGG)
18SC9-SQ02
Summaries of Genetics Programmes
Annex 4 Peru template presenting methods and results of genetics study
of Jumbo flying squid as of July 2021
Summary
- As mentioned during the SC7 meeting in 2019 (ref.: paper SC7-SQ11), we collected mature organisms
from the north, central and south of Peru, during 2018 and 2019. We selected small (n=48) and
medium (n=46) phenotypes and extracted DNA from muscle tissue of the mantle. We prepared
libraries for analyzing SNPs using ddRAD-Seq technology, using restriction enzymes EcoRI and SbfI,
following the protocol from DaCosta and Sorensen (2014) with modifications. Libraries will be
sequenced and analyzed in the next months.
- Also, as mentioned during the SC8 meeting in 2020, regarding the analysis of mtDNA, we sequenced
and analyzed two mtDNA genes, the cytochrome c oxidase subunit I (COI) and the NADH
dehydrogenase (ND2), considering the DNA extraction used for SNPs analysis.
- As explained during the SC8 meeting (ref.: paper SC8-SQ03) no squids of the large-size phenotype
were available during 2018 and 2019. This situation persisted in 2020 and first part of 2021 when, in
addition, the field sampling possibilities and the access to laboratory facilities were severely limited
due to Covid-19 related restrictions.
1. Sample collection
Description of the phenotypes, sample size of each phenotype and the sampling area and time
(recommend mapping).
Sampling
Sampling Sample Mantle Maturity
areas (see Phenotype
date number length (cm) stage
Figure 1)
Nov- North, Small 48 Mean =29 Mature (3
central and (19.3-34.0)
Dec2018, & & 4)
south
Nov-Dec
2019
Nov-Dec North, Medium 46 Mean =60.8 Mature (3
central and (50.0-66.5-)
2019 &4
south
19SC9-SQ02
Summaries of Genetics Programmes
Figure 1. Jumbo flying squid sampling areas for genetic studies (ref.: paper SC7-SQ10)
No squids of the large-size phenotype were available during 2018 and 2019 (ref.: paper SC8-SQ03) and
no samples were collected during 2020 and first part of 2021 due to severe restrictions in sea-going
activities and access to landing sites and field laboratories due to extended Covid-19 related
quarantine and lock-down measures.
2. DNA extraction
Description of the extraction method, the concentration of genomic DNA, the ratios of OD260/280 and
OD260/230, the total weight and completeness.
Extraction Total
Concentration OD260/280 OD260/230 Completeness
method weight
CTAB plus Completed (for
250 ng/µL 1.8 ± 0.14 1.6 ± 0.17 0.8 µg small and
RNAse
medium
treatment phenotypes only)
Figure 2. Agarose gel with DNA extractions
20SC9-SQ02
Summaries of Genetics Programmes
3. Libraries preparation and sequencing
Brief description of the technology for obtaining and analyzing SNPs, including the library, the
restriction enzymes, the final size of PCR product for sequencing and sequencing platform.
Sequencing
Technology Restriction enzymes Size
platform
ddRAD-Seq EcoRI - Sbfl ~ 300 bp HiSeq
4. Data analysis
Very limited or no progress has been made in genetic data analysis due to severe access restrictions
to work offices and laboratories due to extended Covid-19 related quarantine and lock-down
measures.
4.1. Genetic analysis
Description of the software, the private SNPs number (Private), Observed heterozygosity (Obs-He),
Observed homozygosity (Obs-Ho), Expected heterozygosity (Exp-He), Expected homozygosity
(Exp-Ho), Nucleotide polymorphisms (Pi), inbreeding coefficient (Fis).
Table 1. The statistical values of genetic diversity
Phenotype Private Obs-He Obs-Ho Exp-He Exp-Ho Pi Fis
4.2. Population genetic differentiation
Description of the software used to analyze the genetic differentiation index (Fst), the phylogenetic
relationship, population structure and proportion of phenotypic variance.
A general overview description of population genetic differentiation, including the Fst, the
population structure, genetic structure and the population genetic distance.
Fst: 0~0.05, low genetic differentiation between populations;
0.05~0.15, medium genetic differentiation exists between populations;
21SC9-SQ02
Summaries of Genetics Programmes
0.15~0.25, comparatively high genetic differentiation exists between populations;
> 0.25, high genetic differentiation between populations.
Table 2. Population pairwise Fst values of populations based on the SNP
Fst/Nm Phenotype1 Phenotype2 Phenotype3
Phenotype1
Phenotype2
Phenotype3
4.3. Population history
Description of the software used to analyze effective population size and population differentiation
time.
A general overview description of historical population dynamics, such as divergence time, effective
population size.
Table 3 List of bioinformatics analysis software
Steps Name of software
Genetic diversity analysis
Evolutionary tree
Population genetic structure
Principal component analysis (PCA)
Fst
Divergence time
Effective population size
22You can also read