A Comparative Study Of The Effect Of BMI On Labour Outcomes, Delivery Process, And Postpartum Women's Health, At Governmental Hospitals In Two ...
←
→
Page content transcription
If your browser does not render page correctly, please read the page content below

769            International Journal of Progressive Sciences and Technologies (IJPSAT)
               ISSN: 2509-0119.
               © 2021 International Journals of Sciences and High Technologies
               http://ijpsat.ijsht‐journals.org                                                       Vol. 26 No. 1 April 2021, pp. 353-363

    A Comparative Study Of The Effect Of BMI On Labour
 Outcomes, Delivery Process, And Postpartum Women's Health,
       At Governmental Hospitals In Two Libyan Cities
                Obaid A. Alwan1, Fahima A. Albeshti2 , Adel Mahfoud3, and Islam M. Hamoudah4
                      1,2,3
                              Faculty members at the College of Medical Technology - Al-Zawia University
                                                    4
                                                      Al-Zawia Teaching Hospital

Abstract – This clinical study was carried out on postpartum women in two public hospitals during mid-2020. Analysis of collected data
was done by using Descriptive statistics (frequencies and percentages Inferential statistics (X2-test &t-test), p-value less than 0.05
considered to be statistically significant. The 95% confidence interval was used to estimate a value range for an unknown parameter. The
results of comparison between average age, height, weight, and body mass index characteristics of postpartum women for overweight and
normal-weight groups in the study areas were addressed, there was no statistical significance at p 0.05 except for the weight and height
variables in the normal- weight group, which in turn showed statistically significant differences. On the other hand, the results of labor
induction and cesarean delivery were statistically significant in overweight and obese group compared to normal weight in the studied
community at Zawia Hospital, where (Chi-square value = 13.52, p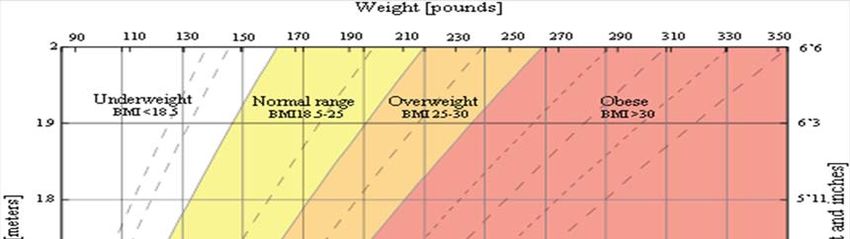
A Comparative Study Of The Effect Of BMI On Labour Outcomes, Delivery Process, And Postpartum Women's Health, At
Governmental Hospitals In Two Libyan Cities

pathologies during pregnancy or postpartum [4, 19]. Obesity and weight gain are conditions characterized by increase
accumulation of body fat, frequently resulting in significant impairment of health and endurance [23]. It is becoming a general
problem affecting health especially in low- and middle-income communities of all ages around the world [3]. World Health
Organization (WHO) and the National Institutes of Health determined weight with body mass index (BMI = weight/(height)2;
where BMI of underweight, normal-weight, overweight, and obese are less than 18.5; 18.5-24.9, 25-29.9, and 30 or greater
respectively [11]. Obesity is classified into obese class I, obese class II, and class III [10,21]. WHO published about 40% of women
have overweight and 15% have obese in women aged 18 years and older in 2016, with a world forecast of about 70 million babies
who are overweight under aged 5 years in 2025[10, 26]. Few studies In the united state of America published on the development
of mothers obesity and its complication in past years,31.8% of women aged 20–39 years were obese in 2011–2012, and increasing
obesity rates, especially class III obesity, have increased significantly between 2005 and 2014[21]. A mother's pre-gestation BMI
is known to affect pregnancy and childbirth results. women who have underweight before pregnancy is at increased risk for
premature labor, small gestational age(SGA), and low birth weight, also associated with adverse health in adulthood, coronary heart
disease, insulin resistance, and hypertension [20]. On the other widespread obesity and weight gain in women childbearing age has
reached epidemiological rate around global [18, 27]. Obesity has an impact on short and long-term general health for both maternal
and child. Weight gain and obesity before pregnancy, during pregnancy, prenatal and postpartum have negative consequences
include menstrual cycle dysfunction, ovulation and infertility before pregnancy, preeclampsia, hypertension and gestational diabetes
(GDM) during pregnancy, cesarean delivery [27]. Also in the postpartum period, they are at a higher risk of thromboembolism,
postpartum depression, and ineffective breastfeeding.
    The inability of physical movement, large breast tissue, and delay in the secretion of lactogenesis II., were the major important
obstacles in starting and sustaining breastfeeding for overweight and obese mothers [11, 17]. For newborns, there is an increased
risk of Macrosomia, stillbirth, and admission to a neonatal care unit. In the long term, babies of obese mothers suffer from impaired
metabolic in utero (fetal programming) and premature death from cardiovascular disease as well as neurocognitive developmental
problems [15, 23].
                                                       II. METHODOLOGY
Study Design and Study Period
   The study consisted of body measurements and a cross-sectional clinical medical condition for each member of the study
population, in addition to conducting various statistical analyzes related to those measurements. The study was focusing on the
health status of pregnant women during labor, delivery, and postpartum woman, at the government hospitals located in two cities
Al-Zawia and Tripoli in the state of Libya. The total duration of the fieldwork for this study was two months in mid-2020.
Sampling Technique and Sample Size
   During the study period, an average of eighteen and twenty-one pregnant women attended daily the Al- Zawia and Al-Galaa
hospitals, respectively. The samples were taken randomly a week by week shifting between Al-Zawia hospital and Tripoli (Al-
Galaa) hospital respectively for a couple of months. Before measuring body weight and height for each patient, his medical file was
received to view and transmit the data needed for this study. The sample size was 150 and 168 postpartum women from Al-Zawia
and Tripoli Hospitals, respectively. Those who were underweight were few, so their measurement values were excluded, and the
sample sizes would be 139 and 155, respectively.
Collection of Clinical Information
    The medical files contain all the data related to the health of the pregnant woman, especially during the period of labor,
childbearing, and the outset period of postpartum. It is a source of several medical points about the cases of elective and emergent
delivery and normal vaginal birth.
Anthropometric Measurement
1. Bodyweight: An electronic weight machine was used to measured body weight. The weight was recorded barefooted and the
scale was calibrated to zero marking every time before use. The weight was recorded in kilogram.

Vol. 26 No. 1 April 2021                                ISSN: 2509-0119                                                        354
A Comparative Study Of The Effect Of BMI On Labour Outcomes, Delivery Process, And Postpartum Women's Health, At
Governmental Hospitals In Two Libyan Cities

2. Height: The height of each member of the study population was measure in a standing position hanging by the side and
barefooted, relaxed way, the vertebral column touching the scale. Height was measured to the nearest 0.1 cm.
3. BMI: Measurement of Body Mass Index (BMI) as the best way to measure the nutritional and health status of a pregnant
woman, an adult BMI chart as shown in figure 1 and an internet calculator were used [7,8].
Data Analysis
    The data set was first checked, cleaned, and entered into the computer from the numerical codes on the form. The data was
edited if there is any discrepancy and then cleaned. The frequency distributions of the entire variables were checked by using IBM
SPSS 22, windows program. For tabular, figures, and a graphical representation, Microsoft word and Microsoft excel 2007 were
used.
Statistical analysis
    The student’s t-test for independent samples was used for the analysis of continuous variables. Heterogeneity chi-square test or
Fisher’s exact test (if numbers were small) was used to compare categorical variables. A P-value of ≤ 0.05 was considered
statistically significant. Binary logistic regression was used to evaluate the odds ratio. All the analyses were carried out using was
used IBM SPSS Statistics 22 & Microsoft office excel 2007.
                                                          III. RESULTS
     In the light study, a total of 318 postpartum women were included in Al-Zawia and AL-Galaa Teaching Hospitals. The sample
size was 150 and 168 postpartum women from Al-Zawia and Tripoli Hospitals, whereas the distribution of the sample according to
body mass index and classified into 11/150 (7.33%) and 13/167 (7.74%) in underweight, 48/150 (32.00%), and 89/168 (52.97%)
as normal-weight, 64/168 (42.67%) and 44/168 (26.19%) overweight, 27/150 (18.00%) and 22/ 168 (13.10%) were obese
respectively. as shown in table 1. The distribution of our study samples was classified and presented in table 1. Although many
classes were presented in underweight, normal-weight, and overweight and obese. However, underweight was the small percentage
of the total population of a study area (7.33%), (7.74%), thus they were excluded from the analysis. Also, the obese group percentage
(18.00%), (13.10%) was added to the overweight. The association between categorical variables at Al-Zawia and AL-Galaa
Hospitals was observed statistically significant in our study by using the Chi-square test ( Chi Square=15.448, p-value =0.000) as
shown in table 2.During the study period, the maternal ages ranged from 18- 42 years, and they were divided into five statistical
categories : (18-22) 12% of Al-Zawia hospital and 17.27% of AL-Galaa hospital, (27-23), (28-32), (33-37) and ( 38-42) and their
percentages were 24%, 21.43%, 26.66%, 32.14%,20.67%, 18.45%, 16.76%, and 10.17% respectively. The higher proportion of the
study population, (26.66%) in Zawia hospital and (32.41%) in AL-Galaa hospital in the age group between 28-32 years as shown in
figure 1.
    There were no significant differences of Al-zawia hospital postpartum women's parameters of age, weight, Height and BMI
values (p
A Comparative Study Of The Effect Of BMI On Labour Outcomes, Delivery Process, And Postpartum Women's Health, At
Governmental Hospitals In Two Libyan Cities
respectively. Statistically, a significant increase has been noticed in labor induction and operative delivery with increasing BMI in
both study areas as shown in tables 6,7. In figure 3, the results show an increased percentage of Caesarean section (58.27%, 53.55%)
and decreased normal deliveries (41.73%, 64.45) in maternal women who were overweight and obese as compared to normal-
weight women at Al-Zawia and Al-Galaa Hospital respectively. Weight gain and obesity were associated with increased risk of
emergency and elective cesarean delivery (32.67%, 34.84%)and (25.18%,27.105) respectively in Al-Zawia and Al-Galaa hospitals
higher than normal delivery as shown in figure 4.
Table (1) Distribution of the sample according their BMI.
Category BMI Percentages Patients BMI
range kg/m2 postpartum women of postpartum women of
for adults Zawia Hospital Tripoli Hospital
Underweight Number Percentage Number Percentage
Severe Thinness < 16 1 0.67% 1 0.60%
Moderate Thinness 16 - 17 2 1.33% 2 1.19%
Mild Thinness 17 - 18.5 8 5.33% 10 5.95%
Normal 18.5 - 25 48 32.00% 89 52.97%
Overweight 25 - 30 64 42.67% 44 26.19%
Obese Class I 30 - 35 15 10.00% 13 7.74%
Obese Class II 35 - 40 10 6.67% 8 4.76%
Obese Class III > 40 2 1.33% 1 0.60%
Table ( 2 ) Statistical independence for population of two study area.
BMI measure Over + Obese Normal Under Sum Chi p- value
weight weight weight square
Location
Zawia Hospital 91 48 11 150 15.448 0.000
Al-Galaa Hospital 66 89 13 168
Sum 157 137 24 318
Table (3) Characteristics of patients the different BMI groups, (over and normalweight).
Characteristic Overweight Normalweight T -test P- 95% CI of Mean
Mean(± SD ) Mean(± SD ) valu difference
e Lower Upper
Age Zawia Hospital )±5.82(31.24 )±6.40(28.17 1.864 0.064 -0.057 1.951
Al-Galaa Hospital )5.65( ±27.15 )5.58(±31.89 0.164 0.870 -0.845 1.009
Body Zawia Hospital )6.69(±161.13 )6.46(±159.60 1.530 0.128 -0.241 1.894
Heigh Al-Galaa Hospital 163.46(±5.55 ) 163.73(±6.21) 1.538 0.162 -0.194 1.563
t
Body Zawia Hospital )9.94(±78.44 70.37(±13.81) 0.328 0.743 -1.858 2.598
Weig Al-Galaa Hospital )10.02(± 79.46 )6.21(±63.09 0.370 0.712 -1.456 2.259
ht
BMI Zawia Hospital )3.70(± 30.08 )1.69(±23.58 0.332 0.740 -0.675 0.947
Al-Galaa Hospital )3.69(±29.77 )1.33(±5123. 1.470 0.144 -0.176 1.202
Vol. 26 No. 1 April 2021 ISSN: 2509-0119 356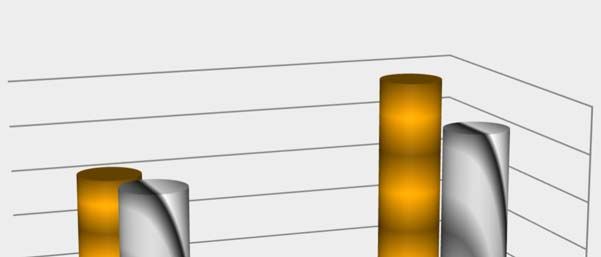
A Comparative Study Of The Effect Of BMI On Labour Outcomes, Delivery Process, And Postpartum Women's Health, At
Governmental Hospitals In Two Libyan Cities
Table ( 4 ) A comparison of the characteristics of the overweight group in the two study areas.
Characteristics Mean(± SD ) T test P - value 95% CI of Mean
difference
Lower Upper
Age Zawia Hospital 31.24(±5.82 ) 0.709 0.479 -2.479 1.169
Al-Galaa Hospital 31.90(±5.58 )
Weight Zawia Hospital 78.44(±9.94 ) -0.634 0.527 -4.196 2.158
Al-Galaa Hospital 79.46(±10.01)
Height Zawia Hospital 161.13(±6.69) -2.478 0.140 -4.667 -0.529
Al-Galaa Hospital 163.73(±6.21)
BMI Zawia Hospital 30.08(±3.70 ) 0.513 0.608 -0.871 1.483
Al-Galaa Hospital 29.78(±3.69 )
Table (5) Comparison of patient characteristics with the normalweight group in the two study areas.
Characteristics Mean(± SD ) T test P- value 95% CI of Mean
difference
Lower Upper
Age Zawia Hospital 28.17(±6.40) 0.951 0.343 -1.089 3.108
Al-Galaa Hospital 27.16(±5.65)
Weight Zawia Hospital 59.96(±6.69) -2.741 0.007 -5.386 -0.871
Al-Galaa Hospital 63.09(±6.02)
Height Zawia Hospital 159.60(±6.46) -3.669 0.000 -5.941 -1.772
Al-Galaa Hospital 163.46(±5.55)
BMI Zawia Hospital 23.51(±1.69) 0.022 0.982 -0.513 0.525
Al-Galaa Hospital 23.51(±1.33)
Table ( 6 ) Tripoli hospital : Labour and delivery outcomes
Normal Overweight + Obese Chi p-value Odds Ratio, 95%
(BMI = 18.6- 25.0) (BMI ≥ 25.1) square CI of OR
N = 101 (65.16%) N = 54 (34.84%)
Labour and delivery outcomes
Labour
Spontaneous 48 (52.2%) 39(44.8%)
Induced 53 (77.9% ) 15( 22.1% ) 8.72 0.003 0.348(0.171 , 0.710 )
Delivery
Spont. Vaginal 56(80.0%) 14(20.0%)
Caesarean section 45(52.9%) 40(47.1%) 12.381 0.000 0.281 (0,136, 0.580)
Vacuum/forceps
Vol. 26 No. 1 April 2021 ISSN: 2509-0119 357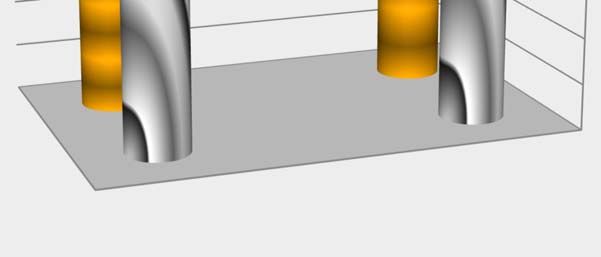
A Comparative Study Of The Effect Of BMI On Labour Outcomes, Delivery Process, And Postpartum Women's Health, At
Governmental Hospitals In Two Libyan Cities
Table (7) Zawia hospital: Labour and delivery outcomes
Normal Overweight + Obese Chi p-value Odds Ratio, 95%
(BMI = 18.6- 25.0) (BMI ≥ 25.1) square CI of OR
N = 59 (42.45%) N = 80 (57.55%)
Labour and delivery outcomes
Labour
Spontaneous 40(58.0%) 29(42.0%)
Induced 19( 27.1% ) 51(72.9% ) 13.52 0.00 3.702(1.818, 7.541)
Delivery
Spont. Vaginal 43(96.4%) 19(30.6%)
Caesarean section 16(20.8%) 61(79.2%) 63.43 0.00 0.116 ( 0,054 , 0.251)
Vacuum/forceps
Figure (1) BMI chart for adults
Source [8]
Vol. 26 No. 1 April 2021 ISSN: 2509-0119 358
A Comparative Study Of The Effect Of BMI On Labour Outcomes, Delivery Process, And Postpartum Women's Health, At
Governmental Hospitals In Two Libyan Cities

                Tripoli
                Zawia

                                                                                                                   35%
                                                                   32,14%
                                                            26,66%       24,00%                                   30%

                                                                                                                           Percentages %
                                                 20,67%                      21,43%                              25%
                                                                                  12,00%17,27%                  20%
                              16,67%                 18,45%
                                                                                                               15%
                                        10,71%                                                                10%
                                                                                                             5%
                                                                                                            0%
                 Zawia
                                                                                               18 ‐ 22
                   Tripoli                                                        23 ‐ 27
                                                                 28 ‐ 32
                                                     33 ‐ 37 Age Periods
                                       38 ‐ 42
                             Figure (2) The Percentage of age of both study area patients

                                                                         58,27%
                 Tripoli
                                                                                   53,55%            60%
                 Al‐Zawia          41,73%                                                           50%
                                                   46,45%
                                                                                                           Percentages %

                                                                                                    40%

                                                                                                    30%

                                                                                                    20%

                                                                                                    10%
                     Al‐Zawia
                                                                                                   0%
                             Tripoli
                                                                                   Caesarean
                                                 Normal                             section
                                                 delivery         Delivery Mode
                             Figure (3) The percentage of Normal and Caesarean section
                                                     Deliveries

Vol. 26 No. 1 April 2021                               ISSN: 2509-0119                                                                     359
A Comparative Study Of The Effect Of BMI On Labour Outcomes, Delivery Process, And Postpartum Women's Health, At
Governmental Hospitals In Two Libyan Cities

               Tripoli                                                           42,45%               50%

               Al‐Zawia                                                                  38,06%
                                                                                                      40%
                                 32,67%34,84%

                                                                                                              Percentages %
                                                     25,18%                                          30%
                                                              27,10%

                                                                                                     20%

                                                                                                     10%

                  Al‐Zawia                                                                          0%
                       Tripoli                                                     Vaginal Delivery
                                                          Elective cesarean
                             Emergency cesarean Modes of Delivery

                                 Figure (4) (The percentage of modes of delivery

                                                        IV. Discussion
    Obesity is one of the major health problems in the world, it has become a global epidemic. WHO has declared obesity as a major
killer disease of the millennium on par such as HIV and malnutrition [13]. BMI anthropometric measurement scale for classifying
obesity and overweight in mothers Body Mass index (BMI) is one of the most widely used indicators anthropometric assessment
of a pregnant woman [1,25]. According to the Institute of Medicine (IOM) and National Research Council (NRC) guidelines, the
optimal weight gains for underweight is 12.7 – 8.1kgs and for obese is 5 – 9.1kgs. Both extremes and excessive or inadequate
gestational weight gain can lead to adverse pregnancy outcomes [12].
    In the current study, the population BMI was distributed into four groups according to WHO. They were 11/159 (7.33%) and
13/168 (7.74 %) of women are classified as underweight in both hospitals. Also 48/150 (32.00 %) and 89/168 (52.97 %) as normal-
weight, 64/150 (42.67 %) and 44/168 (26.19 %) overweight, 15/150 (10.00 %) and 13/168 (7.74 %) as obese I, 10/150 (6.67 %)
and 8/168 (4.76 %) as obese II, 2/150 (1.33 %) and 1/168 (0.60 %) obese III as shown in table 1 . The underweight group at Al-
Zawia and AL- Galaa Hospitals was a small fraction of the total population of each study area, thus they were excluded from the
analysis, also the number of the obese group was added to the overweight in this study. Correlation between categorical variables
of the two study areas in table 2, was observed statistically significant difference at p ≤ 0.05 by using the Chi-Square test (Chi-
square-value = 15.448, and p-value = 0.00). The most significant differences that support our study were the population of two
hospitals related to each other. In the same context, Obaid Alwan 2016 showed that the people of northwestern Libya have similar
food habits and traditions, and these similarities are the type and quality of food, methods of preparation, and the pattern of
consumption [16]. In light of the current study, all the characteristics of the postpartum women groups in Al-Zawia and Al-Galaa
hospitals indicate that there was no significant difference between their variables: age, height, body weight, and BMI values
(p
A Comparative Study Of The Effect Of BMI On Labour Outcomes, Delivery Process, And Postpartum Women's Health, At
Governmental Hospitals In Two Libyan Cities
Tables 4 and 5 showed the comparison between the mean characteristics age, height, weight, and BMI, of postpartum women
for overweight and normal-weight groups in the study areas. There is no statistical significance at p ≤ 0.05 except for the weight
and height variables of the normal weight group, which in turn showed significant statistical differences (p< 0.007, p< 0.000) and
95% CI= (-5.386, -0.871), ( -5.941, -1.772), respectively. Furthermore, the current study has been focused to demonstrate the effect
of BMI on labour and mode delivery outcomes. The incidence of labour induction and cesarean delivery was increased with an
increase in BMI. This observation was obtained by using the chi-square test. The results of labour induction and caesarean delivery
were statistically significant in overweight and obese compared to the normal-weight in the studied population of Zawia hospital as
shown in table 7 and figure2, where (Chi-square value=13.52, p< 0.00, 95% CI of OR = 3.702(1.818, 7.541) and (Chi-square
value=63.43, p< 0.00, 95% CI of OR = (0.116 (0,054, 0.251). On the other hand, table 6 and figure2 showed that there is statistical
significance, in labor induction for normal-weight women compared to overweight and obese at Al-Galaa Hospital where the values
are (Chi-square value=8.72, p< 0.003, 95% CI of OR = (0.348(0.171, 0.710), while the statistical significance of cesarean delivery
in the normal-weight compared to the overweight group was (Chi-square value=12.381, p< 0.000, 95% CI of OR = [0.281 (0,136,
0.580). Figure 4 shows the increase in the emergency and elective cesarean delivery at Al-Zawia and Al-Galaa hospitals population
(32.67%, 34.84%) and (25.18%,27.105) respectively. Meanwhile vaginal delivery was higher in the Al-Zawia hospitals population
higher than Al-Galaa hospital group.
According to other research groups [1,5,6,9,22,25], weight gain and obesity were significantly lower in normal vaginal deliveries
and more in cesarean sections in overweight and obese women. The increase of emergency and elective cesarean deliveries were
similar to what we found in this study, conversely, other studies disagree with our findings [17, 24].
V. CONCLUSION
Within the limits of this study, an association was found between the maternal body mass index (overweight and obesity) with
outcomes of pregnancy complications, such as increased rates of labor induction and cesarean delivery. Although the clinical
reproductive problems of pregnant women in the two study areas were not limited to overweight women, they appeared in the
normal weight category. Where our study focused on the effect of body mass index on before, during, and after childbirth, so our
study is still ongoing to show the effect of body mass index on a pregnant woman after childbirth (postpartum period). This study
recommends the necessity of providing adequate counseling and health care for all women to maintain a normal weight, especially
in childbearing age, to avoid complicated childbirth outcomes.
REFERENCES
[1] Aditi Saini, Syed Masuma Rizvi and Anumodan Gupta.2018 . Body mass index and body adiposity index in maternal obesity
and its implication on the mother and her offspring: A hospital-based prospective observational study. International Journal of
Clinical Obstetrics and Gynaecology; 2(4): 01-05.
[2] Alkhansa Osama Mohamed, Khalda Mirghani Hamza, Asaad Mohammed Ahmed Babker . 2016. Physiological changes in
some hematological and coagulation profiles among Sudanese healthy pregnant women. International Journal of Medical
Science and Public Health. 5:5.
[3] Annick Bogaerts, Lieveke Ameye, Evelyne Martens, , and Roland Devlieger: 2015. Weight Loss in Obese Pregnant Women
and Risk for Adverse Perinatal Outcomes The American College of Obstetricians and Gynecologists. Published by Wolters
Kluwer Health 125: 3.
[4] Ashraf Kazemi, Aazam Dadkhah, Fatemeh Torabi .2020. Changes of Health-Related Quality of Life during Pregnancy based
on Pregnancy Context: A prospective study doi.org/10.21203/rs.3.rs-17798/v1.
[5] Athukorala C, Rumbold AR, Willson KJ, Crowther CA. 2010.The risk of adverse pregnancy outcomes in women who are
overweight or adverse pregnancy outcomes in women who are overweight or obese. BMC Pregnancy Childbirth.;10. 10. 10-
56.
[6] Bhattacharya S, Campbell MD, Liston WA, Bhattacharya S. 2007. Effect of Body Mass Index on pregnancy outcomes in
nulliparous women delivering singleton babies. BMC Public Health; 7:168.
Vol. 26 No. 1 April 2021 ISSN: 2509-0119 361A Comparative Study Of The Effect Of BMI On Labour Outcomes, Delivery Process, And Postpartum Women's Health, At
Governmental Hospitals In Two Libyan Cities
[7] BMI Calculator - Calculator.net https://www.calculator.net › fitness & health.
[8] Body Mass Index (BMI) Charts http://www.vertex42.com/ExcelTemplates/bmi-chart.html .
[9] Cedergren M. 2010. Effects of gestational weight gain and body mass index on obstetric outcome in Sweden. Int J of Obstet
Gynecol 2006; 93:269-74
[10] Fanny Aldana-Parra1 , Gilma Olaya1 and Mary Fewtrell .2020.: Effectiveness of a new approach for exclusive breastfeeding
counseling on breastfeeding prevalence, infant growth velocity and postpartum weight loss in overweight or obese women:
International Breastfeeding Journal. 15:2.
[11] Feyza Ertop,1 Nuray Egelioglu Cetisli. 2020. Postpartum depression breastfeeding in overweight/obese and non-obese
mothers JPMA Vol 70, N.2: 219.
[12] Institute of Medicine, National Research Council Committee. 2009. In Weight Gain during Pregnancy Reexamining the
Guidelines Washington.
[13] Islam A, Khan NA, Ehsan A. Complications of raised BMI in pregnancy. Professor Med J Sep.; 17(3):498-504.
[14] Madhuri Taranikanti. 2018. Physiological Changes in Cardiovascular System during Normal Pregnancy. Cardiovasc Dis
Women-WIN CARS 3:62–67.
[15] Nathalie J. Farpour-Lambert, Louisa J. Ells, Begoña Martinez de Tejada and Courtney Scott. 2018. Obesity and Weight Gain
in Pregnancy and Postpartum: An Evidence Review of Lifestyle Interventions to Inform Maternally and Child Health Policies:
Front. Endocrinol. DOI: 10.3389.
[16] Obaid A. Alwan and Amin O. Igwegbe . 2016. Evaluation of the commonly served Meals at Home and Schools to determine
their Contributions in Meeting the Nutritional Needs of Pupils enrolled for Morning School Hours in selected Schools in Al-
Zawiyya City, Libya. The first scientific conference on food security and food safety. 16 to 17 October 2016. Misrata -Libya.
[17] Oluoch D, Nyongesa P, Mwaliko E, Odunga J. 2018 . Body Mass Index and Pregnancy Outcomes in Expectant Women at
Moi Teaching and Referral Hospital, Eldoret Kenya, WJMER, Vol.17: 1.
[18] Pediredla Ooha,Sri Tanaya ,K. Vandana. 2020. Consequences of maternal body mass index on the pregnancy outcome:
International Journal of Scientific Research vol - 9:11.
[19] Priya Soma-Pillay, Catherine Nelson-Piercy, Heli Tolppanen, Alexandre Mebazaa .2016. Physiological changes in pregnancy,
Cardiovascular Africa Journal of Africa. Volume 27: 2.
[20] Rathnamma P and Deepika N. 2020. Study of the effect of BMI and maternal weight gain during pregnancy on maternal and
fetal outcome. International journal of clinical Obstetrics and Gynaecology; 4(3): 16-21.
[21] Roland.Devlieger ,Lieveke Ameye , Tinne Nuyts ,elat . 2020. Reappraisal of Gestational Weight Gain Recommendations in
Obese Pregnant Women of 337,590Briths Obes Facts.13:333–348.
[22] Sahu MT, Agarwal A, Das V, Pandey A. 2007. Impact of maternal body mass index on obstetric outcome. J Obstet Gynaecol
Res.;33.9-655: (5).
[23] Santo Monte, Oriana Valenti, Elsa Giorgio. 2011. Maternal weight gain during pregnancy and neonatal birth weight: a review
of the literature J Prenat Med. 5(2): 27–30
[24] Scott-Pillai R, Spence D, Cardwell CR, Hunter a., & Holmes VA. 2004-2011. The impact of body mass index on maternal
and neonatal outcomes: a retrospective study in a UK obstetric population. BJOG: An International Journal of Obstetrics and
Gynaecology. 120:932.
[25] Van Der Linden EL, Browne JL, Vissers KM, et al. 2016 . Maternal body mass index and adverse pregnancy outcomes: a
Ghanaian cohort study index and adverse pregnancy outcomes: a Ghanaian cohort study Obesity.24:215-222.
Vol. 26 No. 1 April 2021 ISSN: 2509-0119 362A Comparative Study Of The Effect Of BMI On Labour Outcomes, Delivery Process, And Postpartum Women's Health, At
Governmental Hospitals In Two Libyan Cities
[26] World Health Organization: World health statistics .2016. https://www whoint/gho/publications/world_ health_
statistics/2016/en Accessed 21 Sept 2018.
[27] Yvon E.G. Kim D.G, Elise O.etal . 2020. The impact of interpregnancy weight change on perinatal outcomes in women and
their children: A systematic review. https://doi.org/10.1002/oby.21210.
Vol. 26 No. 1 April 2021 ISSN: 2509-0119 363You can also read